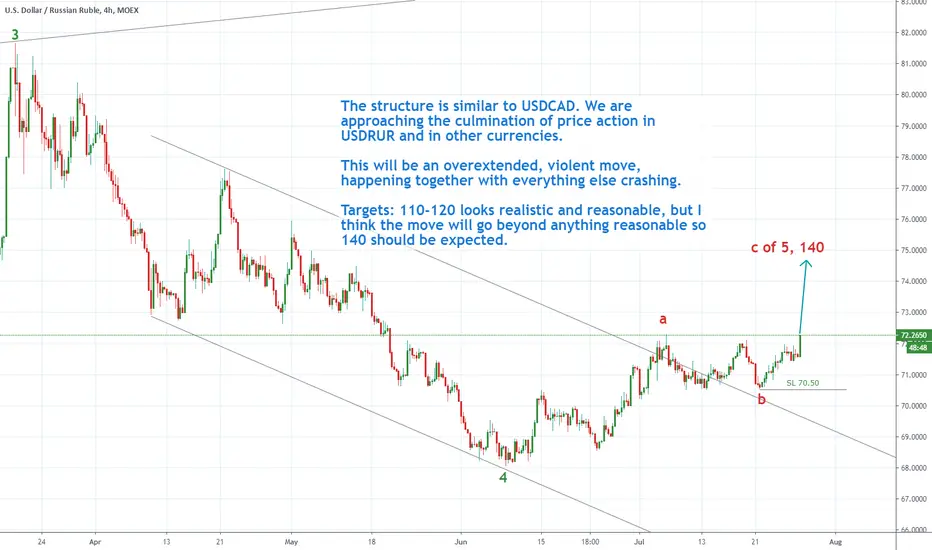
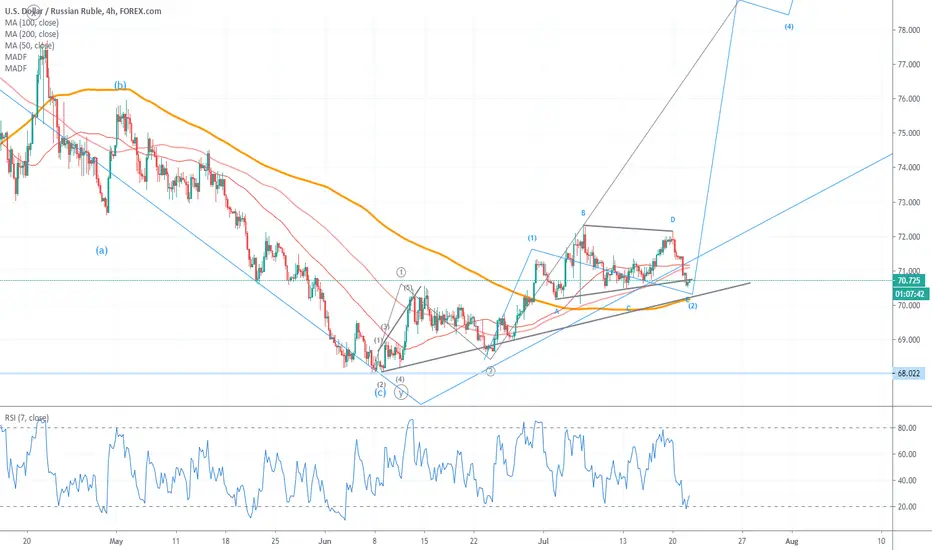
Wave C of 5 of an ending wedge about to startThe structure is similar to USDCAD. We are approaching the culmination of price action in USDRUR and in other currencies. This will be an overextended, violent move, happening together with everything else crashing. Targets: 110-120 looks realistic and reasonable, but I think the move will go beyond anything reasonable so 140 should be expected.
USDRUB_TOM trade ideas
The decision of the Central Bank of RussiaThe decision of the Central Bank of Russia to reduce its interest rates to help their economy was very costly. It strained the strength of the Russian ruble, allowing the greenback to regain its dominance over the trading pair. Prices are now projected to go up towards their resistance level as the ruble faces several hurdles ahead of it. The move should allow bullish investors to prop up the 50-day moving average over the 200-day moving average to maintain their lead. Just last week, the Central Bank of Russia decided to reduce their interest rates from 4.50% to about 4.25%, making a 25-basis point cut. There aren’t any scheduled reports due today for Russia, the next one is due on Thursday, July 30 and it will be the central bank reserves. Bears are hoping that the number won’t go down as it will further add pressure to the ruble. And as for the US dollar, it’s success in the USD/RUB trading pair doesn’t mean that it’s strong against other currencies.

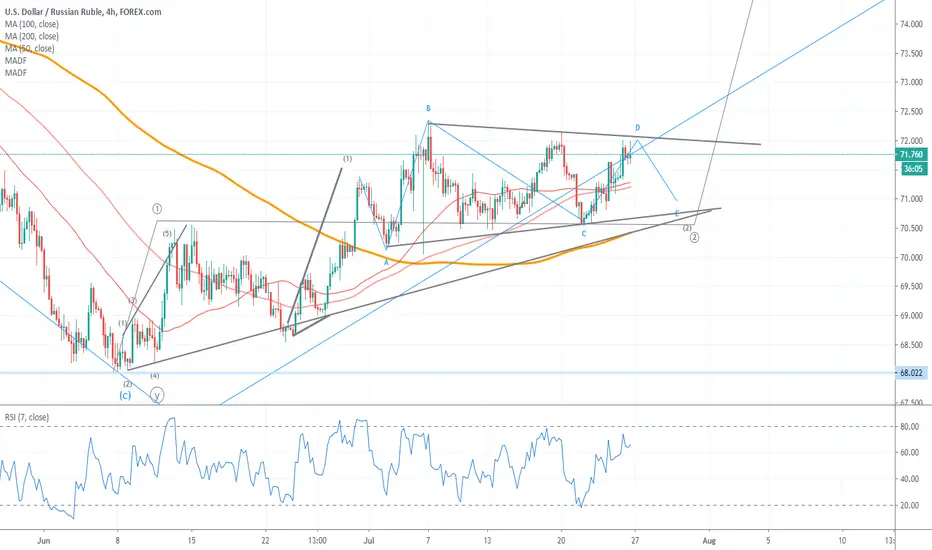
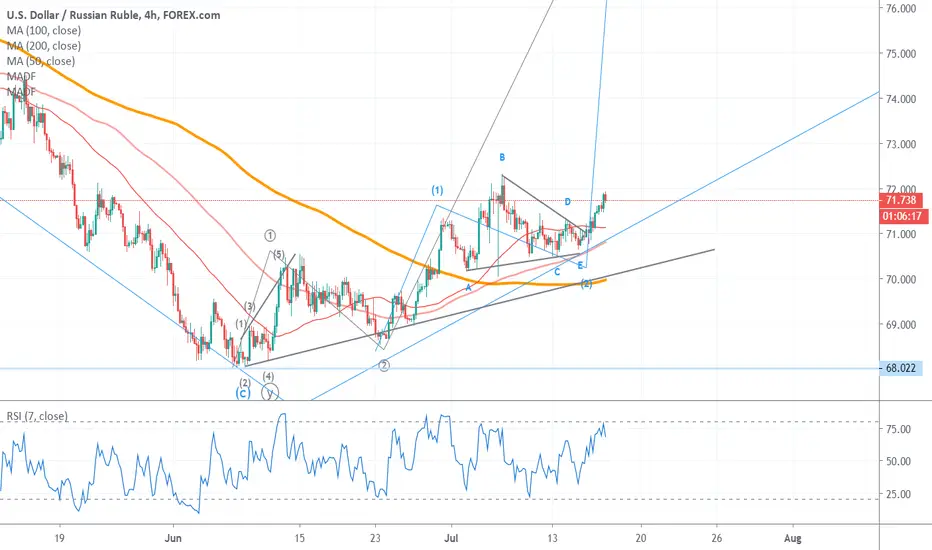
USDRUB Daily UpdateI have updated the chart. The triangle is more pronounced than initially thought and on 4H chart is supported by MAs.

The RUB is slowing down by the intense pressure on its backThe Russian ruble is slowing down by the intense pressure on its back, but the buck is not strong enough to save itself from bears. The trading pair’s prices are widely projected to remain bearish but will slightly slow down. Prices should still head down and reach its support level, reaches ranges last seen in early March. The Russian ruble is faced with both challenges and support that is causing a push and pull effect in prices. Traders are considering the strong performance of crude oil prices in the commodity market which is greatly fueled by demand hopes and vaccine hopes. Another factor to be considered is that there are two main pressure points that could cause a reversal once prices hit their support. The first one is the foreign policy issues and the second is widening investors’ suspicion. Powerhouses from the West are accusing Russia of trying to steal the developments made for the coronavirus vaccine, threatening sanctions on Moscow.
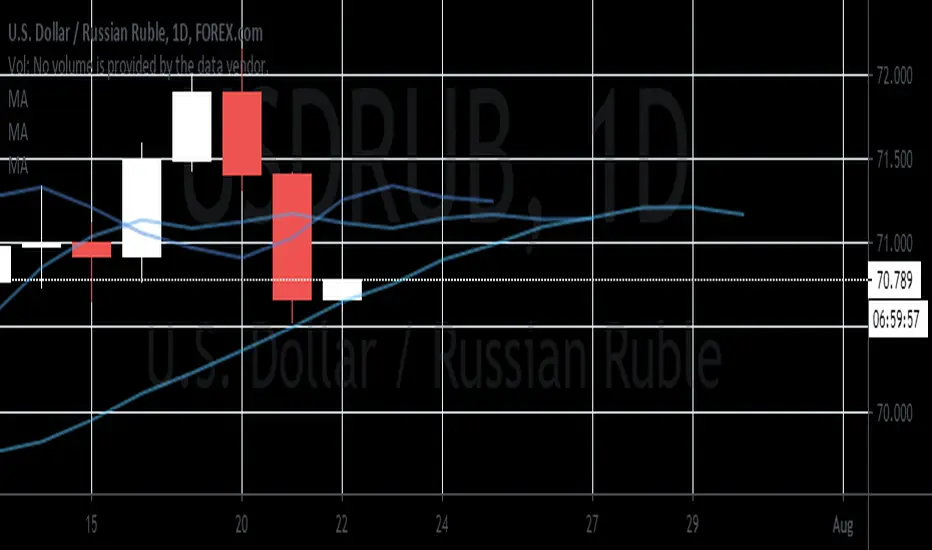

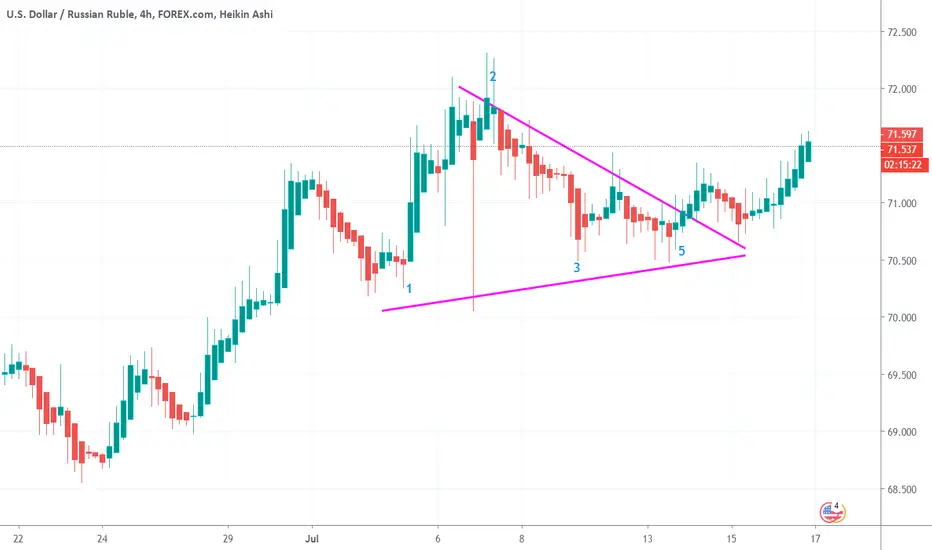
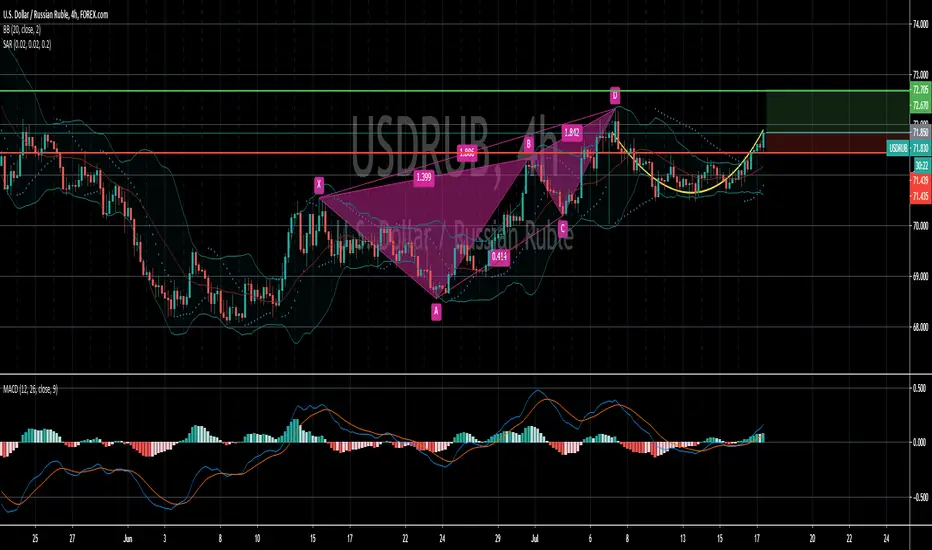
The market has created a clear double top The market has created a clear double top on the fib retracement level and currently is testing a support structure.
Price is still supported by the ema 21 and the upper channel.
When the price will manage to break below the structure and consequently below the ema and also break the channel we can set a nice short order according with our strategy.
–––––
Follow the Shrimp 🦐
Here is the Plancton0618 technical analysis, please comment below if you have any question.
The ENTRY in the market will be taken only if the condition of Plancton0618 strategy will trigger.


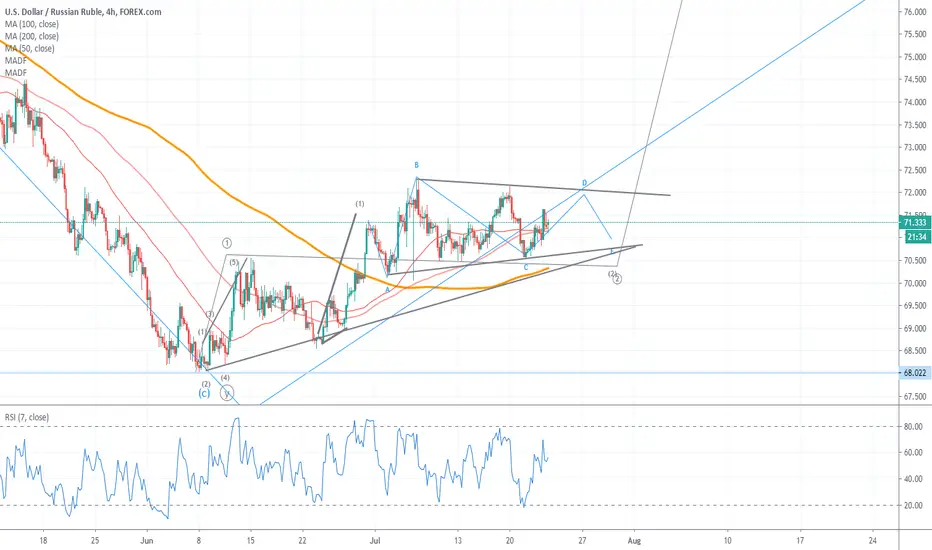
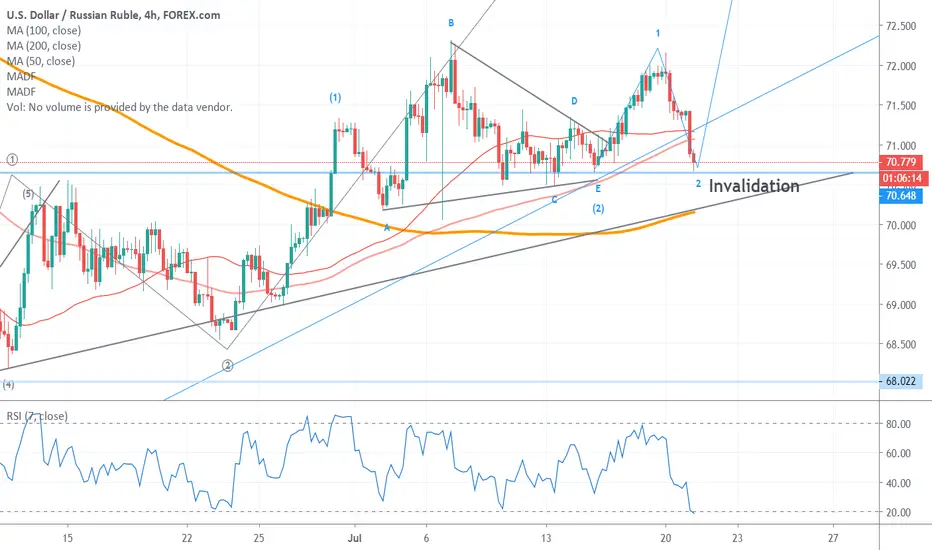
USDRUB UpdateReviewed the count slightly. RSI supports wave analysis. Oil is considered to be at peak (a few hours or a day before the reversal if not happened already). Stocks may have reversed already.
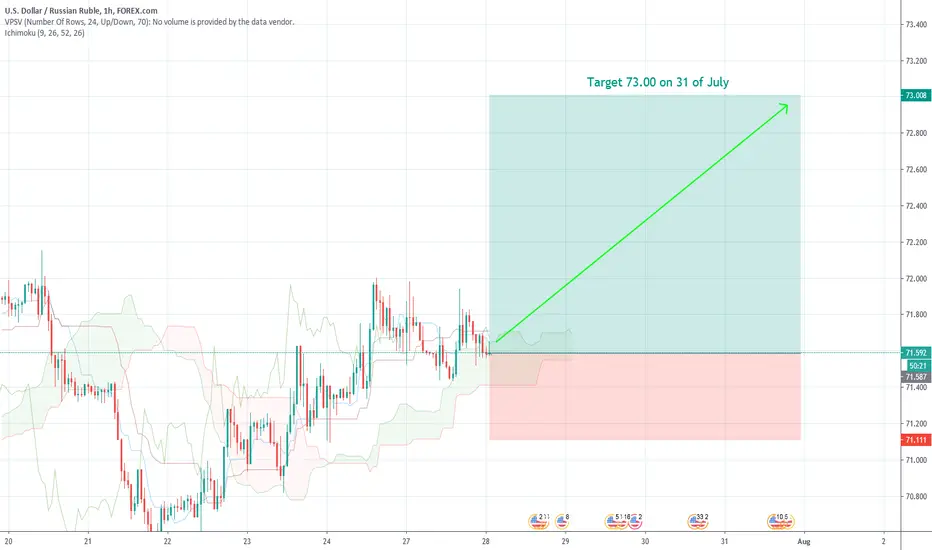
USDRUB flat correctionWe didn't touch resistance at 73 and moved into deep correction. Will wait for powerful move through resistance to new heights, at least 75-76.


USD RUB DAILY TIMEFRAMEthe price is bullish as the chart shows
tp1 weekly M formation neckline
tp2 monthly ici

USD RUB DAILY TIMEFRAMElooking for long tp1 is tha weekly M formation neckline
and tp2 will be ICI on the monthly

USDRUB updateUSDRUB also rushed to correct together with a bounce in RTSI and oil defying the rules of gravity.

USDRUB UpdateAlthough oil is creeping up, the USDRUB can rally. Maybe it is todo with a new wave of US sanctions; alternatively because of internal fiscal policy changes.
USDRUB UP 4 HOURSAfter a huge growth that began after the New Year's holiday, the USDRUB currency pair made a strong downward movement and almost returned to its original positions. But recent events in Russia related to the vote on the change of the constitution, began to question the stability of the Russian currency. The media are talking about a possible devaluation of the Russian currency. And there are a number of significant reasons for this. This is the situation associated with the global epidemic, and the instability of the commodity market, and changes in the political and constitutional system of the country. Also, in turn, the dollar can be expected to strengthen due to a possible drop in oil prices.
USDRUB, Triangle Symmetrical Bottom (bullish)STATUS = Confirmed
CURRENT CONFIDENCE = 60%
TARGET (EXIT) PRICE = 71.916700 RUB
BREAKOUT (ENTRY) PRICE = 71.230000 RUB
DISTANCE TO TARGET PRICE = 0.51% (36.8 pips)
EMERGED ON Jul 16, closing price
CONFIRMED ON Jul 16, 07:01 AM (UTC)
WITH CONFIDENCE LEVEL = 67%
Tickeron AI shows that the Symmetrical Triangle Bottom pattern forms when the price of a pair fails to retest a high or a low and ultimately forms two narrowing trend lines. As the support and resistance levels consolidate, it forms a triangle (15). Symmetrical Triangles are characterized by the upper line sloping downward and lower line sloping upward. The price movement inside the triangle should fill the shape with some uniformity, without leaving large blank areas.
This pattern is commonly associated with directionless markets, since the contraction (narrowing) of the market range signals that neither bulls nor bears are in control. However, there is a distinct possibility that market participants will either pour in or sell out, and the price can move up or down with big volumes (leading up to the breakout).
Trade idea
If the price breaks out from the top pattern boundary, day traders and swing traders should trade with an UP trend. Consider buying a pair or a call option at the breakout price level. To identify an exit, compute the target price by adding the pattern height from the breakout point. The height of the pattern is the difference between the highest high and lowest low.
To limit potential loss when price suddenly goes in the wrong direction, consider placing a stop order to sell at or below the breakout price.