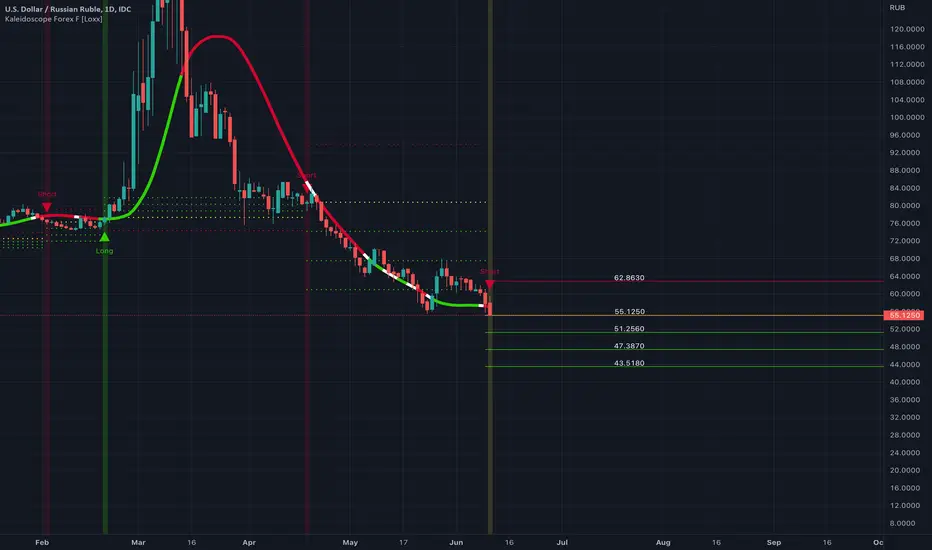
Ruble Up 25% against USD since start of "Special Operations"After an expected dump a V shaped recovering quickly took place.
The chart has notes on happenings along the way.
In an upward trend RUB/USD looks to have a firm foundation at +25% after 170 days since the start of "Special Operations".
USDRUB_TOM trade ideas


Week08 - USDRUB | Reversal PatternBullish Head and Shoulders is forming on currency pair USDRUB, target points are defined with the stoploss.

Short the RubleLooking to me like the Run for the Rub is over. put in a clear Head and shoulders pattern.

BTC Longs - Ruble BTC chartsTop left BTC longs
Bottom left BTC USD chart
Top right RUBLE RUBLE USD chart
Bottom right RUBLE BTC chart
the RUBLE BTC chart is highly correlated with the BTC chart. The liquidations were added as the Ruble price rises and it looks like they were adding margin because it doesent show liquidations, just a run up and flat, run up and flat. I believe they are at a break even point around 32k so that has to be some HEAVY resistance that BTC needs to break through to keep running up to my target of 39k

GOLD AND IRON COUNTRIES WILL BUY PAPER CountriesLUXCASH LLC Global Macro Report
Bangkok, Thailand: News Update from:
Government Treasury Risk Analyst JULIAN MURTAGH-LUX I
Date: 7/19/22
Time: 9:07 PM ICT
Ticker Updates:
WTI: 101.51 USD (-1.07%)
Brent: 105.2 USD (-1.04%)
Gold: 1,712.48 USD (.20%)
Silver: 18.79 USD (.66%)
USDJPY: 137.599 (-.52%)
EURUSD: 1.02337 (.93%)
GBPUSD: 1.20123 (.57%)
BTCUSD: 22,151 (3.17%)
ETHUSD: 1,538 (4.51%)
*I apologize for the short post, I will try to make a 5-10 page report soon with more in depth analysis and wider scans on the markets with technical graphs and currency inflow and outflow measurements.
First of all, I would like to take the time to say a prayer for the people of the world suffering from the Government Corruption, Satanism and Child Abuse. My heart is with you all and I pray for your health.
We are seeing heat waves across Europe which is causing a psychological uptemp in aggression amongst these nations, we are as a result seeing a risk off tone from the USD and a deployment of capital into other fiats such as AUD, JPY, EUR and GBP. Additionally, BTC and ETH saw decent boosts with heavy booms on MATIC. This is following fundamental news that MATIC is working with DIS (Disney) for NFT’s on their blockchain. As said before, I see MATIC as a high competition factor for ETH with a long term possible overhaul against ETH. We are seeing decent boosts on ETH, but the fraction in the ETH community is quite apparent where the POS vs POW (Proof of Stake vs Work, a mining mechanism to authenticate transactions) become a major argument in the space. Personally, it seems very apparent to me that greedy miners are charging an arm and a leg for a simple ETH move and for this reason I hold 0 ETH and only trade it on leverage. I will admit I dipped my toes in the leverage markets briefly and got half burned and half soothed by the markets. I saw a very high ROI on a simple deposit, but this can compound for better or worse if risk is not properly analyzed. I still keep 97% of deposits in dark pool money wallets and do not even look at if (this is my daughters retirement fund.)
On a large scale we see that Ukraine vs Russia is causing a global upheaval of seismic proportions and this is causing a flee to commodities, bonds and FX. I personally believe we saw a dead cat bounce on the Equity sector and there is more pain to come. I see the main turning point occurring in Q4 2022. We are seeing Russia meet with African leaders to export vital food resources such as grain and wheat to make sure the flow of food is consistent. At this point, we are seeing a Russia, China, India, Iran and Brazil pact forming against the West (USA and Europe.) I suspect that cross border payments are actually being done in alternative currencies from the dollar and the rise in the DXY is just an artificial long before we see a de-dollarization of the world. This to me is similar to the 2008 crisis where the LIBOR rate was manipulated by the City Of London Bankers to keep housing mortgages flowing, but as defaults rose, the rate could not be suppressed anymore. As I have said before, I see this default cycle occurring with nations and not households. I am suspecting we will see a Central Bank collapse in many countries and these Gold and Iron backed countries such as Russia and China come up and sweep up the holdings for pennies on the dollar. Additionally, I think a transition to a semi-crypto payment system will be apparent. I think that most central banks and multinational firms are actually using XRP for cross border transactions.
It is also interesting to see the bifurcation in the crypto sphere where LTC is being delisted (Bitkub to mention one) due to the Mimble Wimble privacy upgrade which makes LTC compete with the likes of XMR and DASH. Lastly, Mike Saylor mentioned ADA might be a security and Hoskinson responded with a violent retort. I must admit, I take Saylor’s side, not from the definitive standpoint, since we know only the SEC knows what a security is (half-joke), but it is clear, the SEC will not touch BTC and has outright labeled it a Commodity to be ruled by the CFTC. Let us not forget, ETH had an ICO. ICO’s to me scream securities, they are basically like IPO’s. If you are caught funding or promoting unregistered securities, the SEC will hunt you down and hawk you like a bat out of hell, and that is to put it nicely. ADA also had an ICO. If you think of things through the eyes of the public, I am sorry you will never find the full truth. You must look at things through the eyes of a dark pool money hedge fund manager on the top floor of a London or Hong Kong skyscraper. Then you will understand that pump and dumps are the best way for them to move money from low to high states of energy.
Last point, it looks like Voyager and Celsisus are filing for bankruptcy and stole all their clients' money. Just to give everyone a heads up, Gemini lends to Genesis who lends to Three Arrows, Three Arrows are who caused the bankruptcy of Celsius and Voyager since they were buying s*** NFT’s and leverage trading beyond reason.
KEEP YOUR FUNDS ON COLD WALLETS. PLEASE STAY SAFE AND REMEMBER, MORE THAN HALF OF THESE PEOPLE DO NOT WORSHIP GOD, THEY WORSHIP SATAN AND MONEY, WHICH IS WHY THEY ACT THE WAY THEY DO.
Peace and Love,
ALL RIGHTS RESERVED: JULIAN MURTAGH-LUX I

Will the Russian Ruble keep appreciating vs other currencies?The truth is that the most likely answer is yes, the Ruble will keep going higher. Russia is a massive commodities exporter, from oil & gas, to wheat, and therefore there is a constant bid for its currency due to the natural demand for its resources. As Russia is hit by several sanctions, it is very hard for them to buy stuff from outside of Russia, and therefore even less money is flowing out of the country. The government has also imposed capital controls, and it is hard for its citizens to sell their currency for USD, EUR etc.
The Central bank also raised rates from 5% in 2021 up to 20% post invasion, and have now dropped rates to 11%. Even though that's still a pretty high number and inflation in Russia is much higher than 11%, however this rate is still much higher than what many countries are offering. A 9% cut in interest rates couldn't even bring the currency down, a major sign of strength.
However in my opinion the most important aspect is that Russia has very low debt and could take the hit, while most other countries can't raise rates without breaking everything. They also have significant amounts of Gold, and what remains to be seen is what happens to their FX reserves that have been frozen. If they totally lose these reserves then the currency could suffer, but for now it is possible that they get their reserves back. Forcing 'hostile' countries to pay them in Rubles isn't as important as people think, as they could have accepted payments in Euros for example, and then used that money to buy their own currency. This was mostly a power play and a statement that energy sanctions are futile.
Now in terms of TA, the Ruble got insanely oversold after having a huge breakdown (USDRUB breaking out), but when the dust settled, many people who were short were forced to cover as their brokers wouldn't allow them to trade the Ruble. Many accounts were probably blown up due to the whole sanctions, capital controls and so on, that made it very hard for traders to go long or short. As USDRUB started coming down, longs were getting crushed and everyone had to start closing their positions. The market became illiquid and unstable, and mainly damaged those betting against the Ruble.
At the moment USDRUB has gotten incredibly oversold, as it broke the S3 Yearly Pivot, as well as the S3 Monthly Pivot, and broke the 2020 Covid low, as well as the 2017-2018 lows. The bounce is mostly driven by technical reasons (taking out stops & being oversold), as well as the 3rd rate cut. However in terms of TA, it looks pretty likely that it is heading for 36$. The whole reversal from 160 all the way down here is still very bearish and an indication that lower prices are coming. The rejection at the diagonal resistance is pretty bearish, and the entire 2013-2015 rally / breakout could be reversed. In the short term the market could trade between 55 & 70, but in the long term it is going to go lower.

USDRUBwe looking to visit of biden to saudia arabic if they agree on agreement to produce more oil we should seen this happen to Rubble becouse they can block more and more oil of russia after that and economic of russia that will be fallen

Ruble Beast Mode against US DollarRuble is in Beast Mode against US Dollar.
Recent dip, but still strong and above all meaning moving averages on the 3 day chart starting at "Special Operations".

Ruble vs. USD - Holding Strong While DXY PumpsThe Ruble is dumping a bit against the USD.
For some reason (maybe because the DXY is pumping) USOILSPOT, Gold, and Silver are dumping today along with yesterday.

USDRUB Long (LongTerm forecast)lack of production, an overabundance of the currency, as well as a decrease in imports and exports, will lead the ruble to collapse in this fall. This is only my own opinion.

Gold Standard ?I heard they're backing part of their currency with gold.
Of course it could easily be a bluff or a trick of some sort,
after all this is a government we're talking about.

RUBUSD: - a technical price correctionI made my last Ruble review before February 24th, so there was a downtrend after that. However, the goal was ultimately achieved twice (I circled).
Now I see a significant increase against the backdrop of political manipulation, however, the market is the market and after a strong increase, a correction is always implied.
Target - 0.013600

RUBUSD: Mean reversal incomingRSI alert (worked pretty well in the past)
Volatility alert
DOuble deviation from range
I smell long-term mean reversal for Ruble
Will see

USDRUB. Bullish scenario- Educational purposes only!
- Trade at your own risk!
- Main language - Russian

Usdrub buy 53Usdrub testing bottom bolinger on 4hr.
At the same time on 1hr price creates single candle separated by gapping- strong buyers here.
Buy 53 let’s see if this holds and push price higher from here.

USDRUB made 7 year lows but getting close to long-term buy levelThe USDRUB pair hit this week the lowest levels since June 2015, marking a remarkable turnaround for the Ruble (drop on the pair around -65%) since the March 2022 High at the peak of the Russia - Ukraine invasion.
With this massive drop, the pair is getting very close to the Higher Lows trend-line that started during the subprime mortgage crisis in the U.S. on July 2008. This chart is on the 1W time-frame (log), with the RSI also approaching its own multi-year Support Zone. With the April - May 2015 Support Zone (made during another period of huge uncertainty in Russian economy) also close around 49.00, it is obvious that the price is near the most significant long-term Support cluster.
As a result, our long-term strategy on the pair has turned heavily bullish, targeting at first the Pivot trend-line (71.00) that should act as the first Resistance. The pattern is invalidated if we get a monthly candle closing below the 2008 Higher Lows trend-line.
--------------------------------------------------------------------------------------------------------
Please like, subscribe and share your ideas and charts with the community!
--------------------------------------------------------------------------------------------------------

Russian ruble short than longRuble can go below 50 or even below 40: we are in the C wave of flat, it can be either running or expanded. After this I expect big and sharp impulse to the sky.

USDRUBUSDRUB LONG
GOING TO HIGHER HIGH
IT IS JUSD IDEA!!!
If you lose money, I will not be responsible, so make your own decision!

Strong as the dollar is the Ruble is gainingThe sanctions have not undermined the Russian currency as one would have expected. I wonder if the rule induced default will have any effect on May 25. The ruble has pushed back into 2014 territory...and looks capable of hitting 48 to the dollar. ouch.

USDRUB Initial ShortUSDRUB Initial Short. TP and SL on chart. Move SL on TP. After TP2, trail with 0.5ATR step and 1.5ATR offset.
The final countdownImportant to understand two things about the Russian Ruble:
1. There is no physical limit to how high USDRUB will go in wave 5. With exports slashed down and Crude ready to crash back to 10$ we can easily see USDRUB at 200, 300, even 500, why not.
2. The move that's about to happen is the last one in the 14-year long sequence, and it will be fully retraced when the trend changes. A spectacular comeback to below 50, dipping below 39.99 should be expected in the next 2-3 years.

best position for buydollar VS ruble best posation for buy
economy of Russia will be in pressure more.
