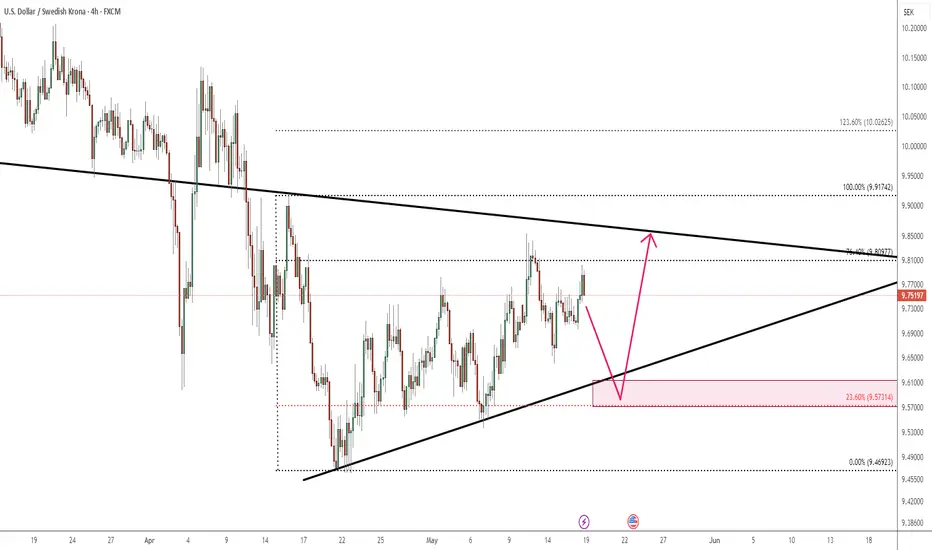
usdsek is in a trianglethe pair is now bouncing in a triangle and we predict to move further down before going up
trendline and fibo level for better understanding are drawn .
we are waiting for the result
USDSEK trade ideas
USDSEK Bullish Breakout from Support📈 Overview from Weekly Time Frame
USDSEK is stalling at a key weekly support zone, showing signs of rejection from the downside. This level has acted as a reliable demand zone in the past.
📊 Daily Chart Explanation
Price has broken the internal bearish structure and is now holding firmly above the 14EMA. Recent candles are showing bullish momentum, indicating buyers are gaining control.
⏱ 4H Chart Explanation
The 4H timeframe confirms the shift — price broke above the weekly support zone and now maintains above the 50EMA. Structure has clearly shifted bullish with higher highs and higher lows forming.
📌 Plan
Bias: Bullish
Entry: On retracement to 4H discounted zone (look for price action confirmation)
Targets: Recent high or 1R
Invalidation: Break back below 4H 50EMA and recent higher low

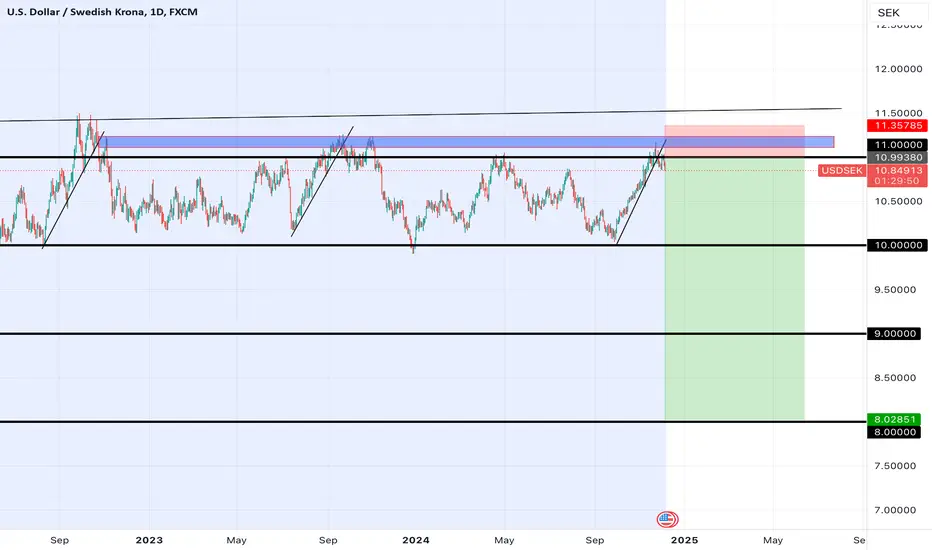
Home of ABBA, IKEA, and Volvo (USD/SEK)USD/SEK has broken below major multi-year support.
While below there we are looking for shorts (i.e. bullish the Swedish krona)
The daily chart has corrected higher but the trend is down.
Another breakdown through the lows could setup another leg lower
Thoughts?

USDSEK | 21.04.2025BUY 9.53000 | STOP 9.44000 | TAKE 9.68000 | Technical view: oversold levels. Correctional return of the price.

USDSEK could jump 5%, learn why. With many top markets trading sideways, we explore USDSEK, which has gained 11% in recent weeks. Is it sustainable given global risks? Probably not. But how can we trade it? Watch the video to find out.
This content is not directed to residents of the EU or UK. Any opinions, news, research, analyses, prices or other information contained on this website is provided as general market commentary and does not constitute investment advice. ThinkMarkets will not accept liability for any loss or damage including, without limitation, to any loss of profit which may arise directly or indirectly from use of or reliance on such information

Buy idea on USD/SEKBased on
- Cycle analysis and quantitative data
- Strong Demand Zone
- Undervalued Conditions

This is my Idea of where the market is headed.Guys please remember the market does whatever it pleases to do, we can only flow with with it

USDSEK bullish transformation.Looking at USDSEK, it's showing room for bullish momentum. After lining up, I noticed that a couple of triple reaction points showcases that there are confirmations of bullish alignment into the open season. Keep it up and good luck.

USDSEK The most 'neat' sell you can take!The USDSEK pair has been trading within a Channel Down since the May 01 2024 High. The price has been on its latest Bullish Leg since the September 27 Lower Low and right now the price is just a step before testing the top (Lower Highs trend-line) of the Channel Down.
At the same time, the 1D RSI touched the 70.00 overbought barrier and turned sideways for the past week. This is a bearish sign as every time it did so since April 30, the Channel Down had topped.
As you can see there is a high degree of symmetry within this Channel and we expect the new Bearish Leg that will start to follow the same parameters. The previous ones bottomed after around -7.00% declines and on the -0.236 Fib extension.
As a result our sell Target as of today is 9.90500 (above the -0.236 Fib on less than -6.89% decline).
-------------------------------------------------------------------------------
** Please LIKE 👍, FOLLOW ✅, SHARE 🙌 and COMMENT ✍ if you enjoy this idea! Also share your ideas and charts in the comments section below! This is best way to keep it relevant, support us, keep the content here free and allow the idea to reach as many people as possible. **
-------------------------------------------------------------------------------
💸💸💸💸💸💸
👇 👇 👇 👇 👇 👇

USD SEK High timeframe analysis....bullishUSD SEK is a bullish chart in the short to medium term but since July 2022, you will see that USD SEK has been in a bearish downtrend. Prior to 2022 it was a bullish up-trending USD SEK.
Now on the daily chart USD SEK recently fell out of a falling wedge, which is usually a bullish signal after price settles and wrong-foots traders. That is what's happened in recent weeks and today a cross-up of the daily chart 9ema and 50ema which is always a strong price action in the days ahead on any chart.
On the weekly chart (right of screen), weekly support recently on the Weekly 200ema and this looks like it will climb in the weeks ahead on the back of a firming USD.

USD takes the Swedish Krona for a run...sparking USD rally
USD SEK is turning around in a slack day for the USD. Perhaps USD is turning around at present and retracing right now for a Buy in USD SEK.

USD SEK is flowing nicely to the Upside. BUY.
USD SEK looks to be getting into it's new trend upwards after falling out a falling wedge earlier. It's gotta stop falling sooner or later.
But be aware it also has price action up and down inside a monthly bullish pennant. How bullish right now is what needs to be known.

USD/SEK Trade Signal - SellDirection: Sell
Enter Price: 10.28442
Take Profit: 10.24119
Stop Loss: 10.36566
This trading signal is generated using the EASY Quantum Ai strategy. The rationale behind our decision to enter a sell position for the USD/SEK currency pair is based on a combination of technical and fundamental factors:
1. Technical Analysis: Recent chart patterns indicate a bearish trend for USD/SEK. Key technical indicators, such as the Moving Average Convergence Divergence (MACD) and Relative Strength Index (RSI), suggest that selling pressure is increasing. The pair is forming lower highs and lower lows, a classic sign of a downtrend.
2. Fundamental Analysis: Economic data from Sweden shows stronger-than-expected growth, boosting the SEK. Conversely, recent USD labor market data failed to meet expectations, adding downward pressure on the USD.
3. Market Sentiment: Sentiment indicators reveal a shift in trader positioning, with an increasing number of traders holding short positions. This sentiment shift aligns with our bearish outlook.
By leveraging the EASY Quantum Ai strategy, we've identified an optimal entry point at 10.28442. Our take profit target is set at 10.24119, providing a favorable risk-to-reward ratio. The stop loss is strategically placed at 10.36566 to limit potential losses.
Happy trading and stay disciplined!


USDSEK Bearish break-out imminent.The USDSEK pair is testing the Internal Higher Lows trend-line of the 2-year Channel Down pattern, below both the 1D MA50 (blue trend-line) and 1D MA200 (orange trend-line). Having made its last Lower High just above the 0.786 Fibonacci level (similar to the previous Lower High), it is technically expected to break the Internal Higher Lows trend-line and extend to a new Channel Down Low towards the end of the year.
As you can see the structure of this pattern is very symmetrical and with the last Lower Low being just above the -0.186 Fibonacci extension, we expect the next to be at 9.7500 at least.
-------------------------------------------------------------------------------
** Please LIKE 👍, FOLLOW ✅, SHARE 🙌 and COMMENT ✍ if you enjoy this idea! Also share your ideas and charts in the comments section below! This is best way to keep it relevant, support us, keep the content here free and allow the idea to reach as many people as possible. **
-------------------------------------------------------------------------------
💸💸💸💸💸💸
👇 👇 👇 👇 👇 👇

USDSEK - Eager for Divergence Supported Break OutUSDSEK seems eager for a divergence supported bullish breakout. Price had broken through long term trendline and is currently testing short term corrective trendline. MACD has printed strong bullish divergence so we can expect price to bounce from support and break the short term trendline acting as dynamic resistance.

USDSEKUSDSEK is in an upward trend. It is still trading within a bullish flag. An upward break of this flag will allow us to add positions. Let us observe. HAPPY TRADING !!!

USDSEK LongUSDNOK might carry on being bullish. I am waiting for the reversal back to the blue line for entry. HAPPY TRADING !!!

Trade Signal for USD/SEK: Buy OpportunityTraders, we have identified a promising trading opportunity for the USD/SEK currency pair. Here are the details of the recommended trade:
Direction: Buy
Enter Price: 10.49254
Take Profit: 10.55746667
Stop Loss: 10.41999667
Justification:
Our forecast is derived using the EASY Quantum Ai strategy, which leverages advanced quantitative analysis and artificial intelligence to predict market movements. Several key factors have informed our buy signal for USD/SEK:
1. Economic Indicators: Recent economic data from the United States suggests stronger-than-expected GDP growth, coupled with improving job numbers, indicating a robust economic environment. This strength is likely to enhance the demand for USD.
2. Monetary Policy Divergence: The Federal Reserve is anticipated to maintain or increase interest rates to combat inflation, whereas the Riksbank is expected to be more conservative. This interest rate differential traditionally benefits the USD over the SEK.
3. Technical Analysis: Price action analysis shows that USD/SEK is currently exhibiting a bullish trend. The pair has been forming higher highs and higher lows, indicating sustained buying pressure.
Considering these factors, we recommend entering a buy position at the specified price level. Use the designated take profit and stop loss levels to manage risk and secure potential gains.
Happy trading!

USDSEK Under both major MAs. Sell opportunity.The USDSEK pair is consolidating below both the 1D MA50 (blue trend-line) and the 1D MA200 (orange trend-line). This is half-way through the new Bearish Leg of the 1.5 year Channel Down, with the recent Top in May being formed on the 0.786 Fibonacci, just like the previous Lower High (November 01 2023).
The current consolidation resembles that of November - December 2023, which eventually bottomed on the 1.382 Fibonacci extension. As a result, we expect the price to resume the bearish leg soon and our Target is 10.000 (Fib 1.382).
-------------------------------------------------------------------------------
** Please LIKE 👍, FOLLOW ✅, SHARE 🙌 and COMMENT ✍ if you enjoy this idea! Also share your ideas and charts in the comments section below! This is best way to keep it relevant, support us, keep the content here free and allow the idea to reach as many people as possible. **
-------------------------------------------------------------------------------
💸💸💸💸💸💸
👇 👇 👇 👇 👇 👇

USD/SEK buyLast week the Fed chaged the rate cut expectations from 2 to just 1 this year.. thats very bullish for the USD that will probably continue to go higher , This pair looks like it is a very good setup to get some of that USD strenght

USDSEK Sell AnalysisLast week I marked this chart up for the buy, the lower swing closing out the week is indicative a sell coming up. I don't think this is a sell to enter a bearish market but I will be following this fib structure to see what happens.
