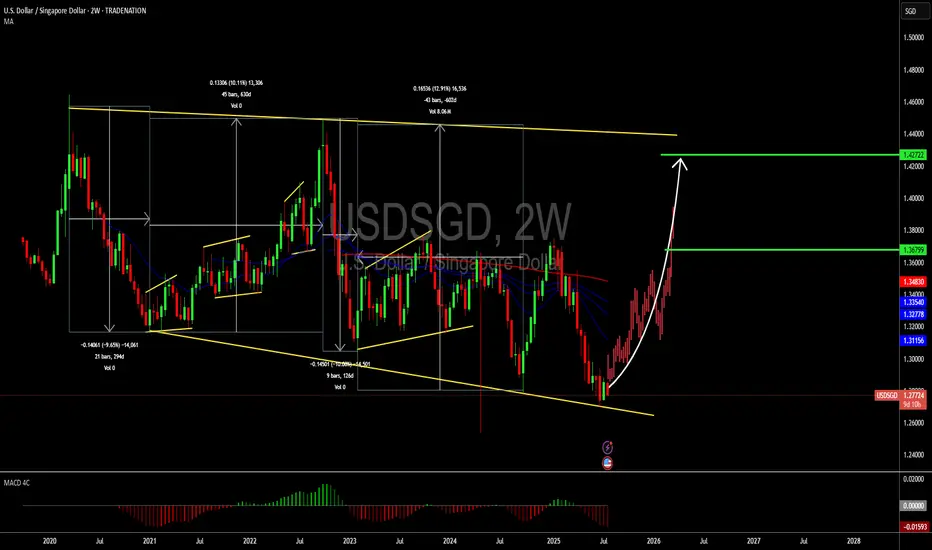
USDSGD: A long-term buyHello,
The USDSGD is trading at the bottom of the corrective wave. As at today USD/SGD remained pressured, edging down 0.13% as markets awaited more clarity on both US trade policies and monetary policy outlooks in Asia, keeping SGD slightly firmer. The price of this pair is currently trading below
Related currencies
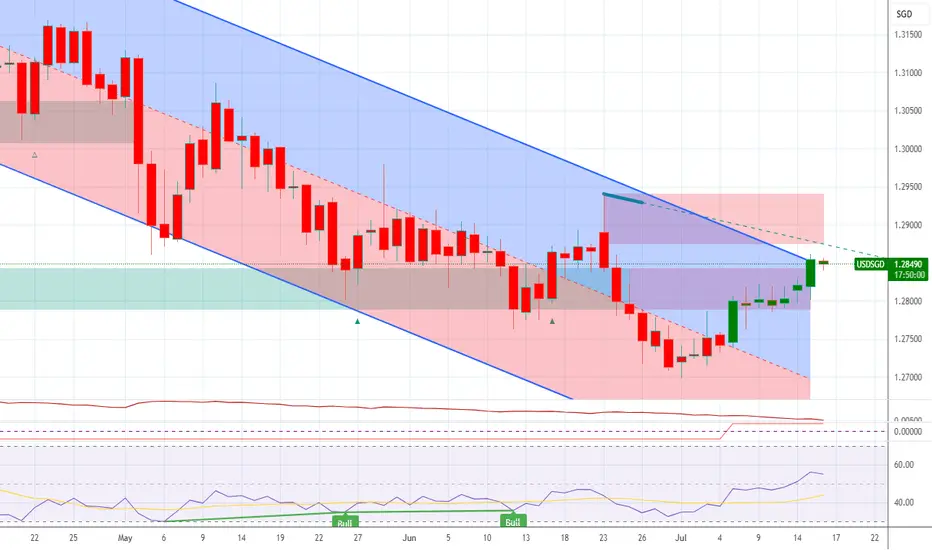
USDSGD LongUSDSGD is now net long the regression break.
I am consider the USD pairs for the day, but this one may not be on the list.
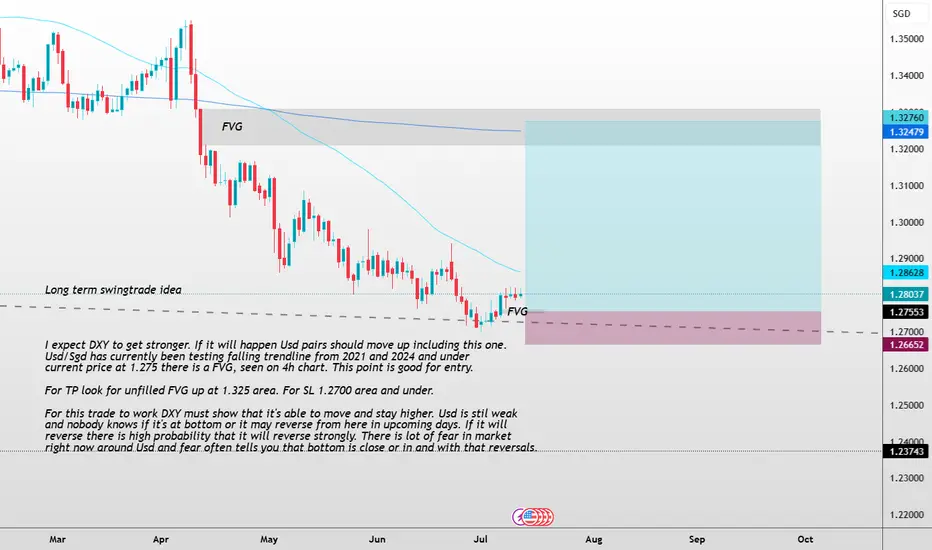
Usd/Sgd LongI expect DXY to get stronger. If it will happen Usd pairs should move up including this one.
Usd/Sgd has currently been testing falling trendline from 2021 and 2024 and under
current price at 1.275 there is a FVG, seen on 4h chart. This point is good for entry.
For TP look for unfilled FVG up at 1.
Time to plan a trip to the USA ?We have now breached the support level at 1.28288 and if nothing goes wrong, it should goes south towards 1.23684, a level supported since 2013.
This is also good for those based in Singapore but are buying US assets - stocks, ETFs, crypto, etc as you would need less Sing dollars for the equivalent

USDSGD likely to reach level 1.33643USDSGD was trending bearish as USD weakened due to multiple decisions and trade war.
Look for zones for reversal and once USD starts strengthening, the price is likely to reach level 1.33643.
This is for educational purpose only. Not an investment or financial advise.

Singapore dollar price increaseIf the Monetary Authority of Singapore (MAS) tightens monetary policy (e.g., by allowing SGD appreciation or raising interest rates) or if Singapore’s economic growth improves, the SGD could strengthen. Additionally, if the U.S. Federal Reserve stops raising rates or signals cuts, pressure on the SG

Playing the middle-sectionNews was left out of the equation. Price action is forming a short-term bullish structure, with a clear inversed head and shoulders supported by strong expansion. Entry criteria are aligned with short-term HTF context and confirmed by the break of the inflection point, marked by the ray line.
From t

USDSGD - LongWeekly level USDGD has been on a very low point since forever. Price will not break through in my opinion but will move to the upside. currently accumalating orders ; trapping breakout sellers for the long

Currency exchange and US assets - stock marketI am blessed to live in Singapore , a country well known for its stability and peace.
Assuming I had invested 100K SGD dollars in US stock market - SPX in Jan 2016 at exchange rate of 1.44 to 1 USD.
That means I would have only 69,444 USD available to invest. And if I stayed in the game long enoug

USDSGD LONG TO 1.36750 WITH GOLDBACH AND FIB BACKING USDSGD with a clean fib structure and looking to target 0.90 retrace in line with a Goldbach retrace to the higher order block zone

See all ideas
Summarizing what the indicators are suggesting.
Oscillators
Neutral
SellBuy
Strong sellStrong buy
Strong sellSellNeutralBuyStrong buy
Oscillators
Neutral
SellBuy
Strong sellStrong buy
Strong sellSellNeutralBuyStrong buy
Summary
Neutral
SellBuy
Strong sellStrong buy
Strong sellSellNeutralBuyStrong buy
Summary
Neutral
SellBuy
Strong sellStrong buy
Strong sellSellNeutralBuyStrong buy
Summary
Neutral
SellBuy
Strong sellStrong buy
Strong sellSellNeutralBuyStrong buy
Moving Averages
Neutral
SellBuy
Strong sellStrong buy
Strong sellSellNeutralBuyStrong buy
Moving Averages
Neutral
SellBuy
Strong sellStrong buy
Strong sellSellNeutralBuyStrong buy
Displays a symbol's price movements over previous years to identify recurring trends.
Frequently Asked Questions
The current rate of USDSGD is 1.28092 SGD — it has increased by 0.24% in the past 24 hours. See more of USDSGD rate dynamics on the detailed chart.
The value of the USDSGD pair is quoted as 1 USD per x SGD. For example, if the pair is trading at 1.50, it means it takes 1.5 SGD to buy 1 USD.
The term volatility describes the risk related to the changes in an asset's value. USDSGD has the volatility rating of 0.41%. Track all currencies' changes with our live Forex Heatmap and prepare for markets volatility.
The USDSGD showed a −0.41% fall over the past week, the month change is a 0.19% rise, and over the last year it has decreased by −4.66%. Track live rate changes on the USDSGD chart.
Learn how you can make money on rate changes in numerous trading ideas created by our community.
Learn how you can make money on rate changes in numerous trading ideas created by our community.
Currencies are usually traded through forex brokers — choose the one that suits your needs and go ahead. You can trade USDSGD right from TradingView charts — just log in to you broker account. Check out the list of our integrated brokers and find the best one for your needs and strategy.
When deciding to buy or sell currency one should keep in mind many factors including current geopolitical situation, interest rates, and other. But before plunging into a deep research, you can start with USDSGD technical analysis. The technical rating for the pair is neutral today, but don't forget that markets can be very unstable, so don't stop here. According to our 1 week rating the USDSGD shows the strong sell signal, and 1 month rating is sell. See more of USDSGD technicals for a more comprehensive analysis.