USDSGD-Wave b) in progress may be simple or complex to 1.34 ?Market Commentary:
LEARNING ELLIOTT WAVES IS LITTLE BIT TOUGH (FOR ME IN BEGINNING) BUT I TOOK IT AS A CHALLENGE AND THAT IS NOT IMPOSSIBLE ALSO...
First have an look for the positional trend i shared here previous....if you are a follower of me...and sometimes i will share the counter trend trade also in 15 mins and 1hr...but that is risky ones...so if the trend is bearish or bullish, if i am expecting the correction...book the profit there and wait the correction to end and again go with the trend....DONT TRADE THE COUNTER TRADE SETUP...you will took loss too...try to identify the short term pull back and the long term pull back after that took small lots in the short term PB with strict stop and go with big lots in the trend side that is long term. I WONT TOOK ALL THE TRADE PLAN SHARED HERE...
Read the market commentary inside the chart what i shared here carefully and try to learn Elliott waves...otherwise its tough to understand the market commentary and my analysis. I wont give a entry, stop loss and take profit in my chart...it is only for EDUCATIONAL PURPOSE and i am sharing how i am analyzing the pair and labeling them according to the Elliott wave theory...I AM JUST SHOWING THE TREND HOW IT MAY GO AND MY VIEW(it may wrong too)..so DON'T FOLLOW BLINDLY MY CHART..take this as a reference and if it correlate to you strategy took the trade as per your strategy...DON'T ASK ABOUT YOUR RUNNING TRADES i wont comment on them and I WONT SUGGEST TO TAKE MY TRADE SETUP.
I am a technical analyst based on trendline, channel, fib retracements, expansion, stochastic for divergence, EMA's and MA's are finding the pull backs and MAJOR IS ELLIOTT WAVES...those mentioned above are using as a TOOLS only. I am not a fundamental, sentimental trader...but only the fundamental will boost my technical analysis to reach my target or sometimes it will go against me and then i will manage the trade according to the Elliott waves alternate views...Each and every trade plan i am sharing here has a alternate view and i am sharing only the most probabilities(70-80%) here...sometimes the other (20-30%) may market do..then i will change the wave counts and labeling according to the price action.
All labeling and wave counts done by me by manually and i will keep change according to the LIVE MARKET PRICE ACTION. So dont bias, hope on my trade plans...try to learn and make your own strategy...Following is not that much easy...I AM NOT RESPONSIBLE FOR ANY LOSSES IF U TOOK THE TRADE ACCORDING TO MY TRADE PLANS....THANKS LOT..CHEERS
USDSGD trade ideas


Wedge Pattern TradingRising Wedge Pattern is a trend reversal chart pattern that that indicates gradually decrease in market momentum.
if it is traded with confluence like a supply or resistance level then Winning probability of this setup will increase.

COT CURRENCY REPORTAUD, NZD & CAD:
Yet another 13K unwind of net long positions for the CAD in the CFTC data updated until the 20th of July means that a lot of the froth in positioning has been taken care of. Our concerns about positioning for the past few weeks meant a patient stance with CAD longs, but with the size of the unwind we think CAD longs look attractive again on a relative basis.
As for the NZD, the currency still looks very ‘cheap’ at the current levels given that the RBNZ is the first major central bank that stopped QE. Apart from that, expectations for rates to go higher in the next three weeks should also provide a favourable environment for the NZD. We like NZD longs versus the Dollar going into this week’s FOMC.
We remain patient on AUD with the virus escalation. The challenge for Australia when compared to places like the UK and US is that the vaccination roll out is miles behind. So, if the same type of spike in cases occur it could create a lot of economic pain as we head deeper into Q3. On the radar this week will be employment data, and if that comes in much softer than expected our preferred way to express AUD weakness would be with AUDNZD and AUDCAD downside.
JPY, CHF & USD:
The JPY positioning remains stretched to the downside, and the fast and punchy recovery in equity markets didn’t do the JPY any favours either. However, the inverse correlation with US10Y could still see JPY pressured.
We’ve seen a lot of downside in US10Y over the past few weeks, beyond what majority of market participants (us included) were anticipating. The downside in yields meant one less negative driver for the JPY. But as a ton of the stretched positioning in treasury shorts have arguably been flushed out, we could see yields regain some upside momentum again.
For the USD, this week we are turning slightly more cautious on the Dollar. Yes, the USD had good reason to see the upside it enjoyed over the past few weeks. But as the markets are looking for a slightly more cautious sounding Fed this week (due to the Delta variant), and since short-term the price action is looking a bit stretched, there could be some downside for the USD going into the FOMC.
GBP:
The GBP put in a decent recovery from the lows this week. Monday saw some downside as participants were disappointing when the most dovish member of the BoE said some dovish things. Hardly the type of reaction one would expect, but after the comments from Saunders the week before there was some hope that the overly dovish Haskel might do the same.
However, despite the Monday sell off we saw Sterling put in a solid recovery, despite ongoing tensions between the UK and EU regarding the Northern Ireland Protocol. At the current levels, especially with positioning back into net short, one has to argue that GBP is looking attractive from a value perspective.
As the markets are expecting a cautious sounding Fed this week, one of the ways we would like to express potential USD weakness in the week ahead is against the GBP. Obviously, we’ll need to keep close track of any major negative escalations on the political front.
EUR:
The EUR has seen a sizable push lower ever since we had the less dovish than expected June FOMC meeting. After that, the Dollar has enjoyed further upside from various drivers which has kept the EUR pressured, and the ECB’s continued dovish tone sure hasn’t helped.
We have been very patient in chasing the EURUSD lower after finding the support around 1.1780 – 1.1850 as a very tough nut to crack. Even though we maintain a fundamental bearish outlook on the EUR and the EURUSD one has to argue that the downside looks a tad stretched.
Positioning seems to agree with this as we’ve seen a whopping 72000 reduction in net long positioning in the past 5 weeks (that’s a lot). Yes, the overall net long positioning still looks way too high for the fundamental outlook, but timing doesn’t favour chasing the EUR lower from here.
At the current levels the risk-to-reward does look attractive for a possible short-term mean reversion opportunity to the upside for EURUSD going into the FOMC, that is barring any possible risk off environments which should be supportive for the USD.
*This report reflects the COT data updated until 20 July 2021.


USDSGD Has Broken Above a Major Resistance
Welcome back Traders, Investors, and Community!
Hi Traders, USDSGD on H4 has broken above a major Resistance by several green candles. It might go down for a retest before goes up to hit TP1
⬆️Buy now or Buy at 1.3580
⭕️SL @1.3554
✅TP1 @ 1.3706
✅TP2 @ 1.3784
✅TP3 @ 1.3859
We will have more FREE forecasts in TradingView soon
❤️ Your Support is really appreciated!❤️
Have a Profitable Day

💡Don't miss the great buy opportunity in USDSGDTrading suggestion:
". There is a possibility of temporary retracement to the suggested support line (1.3580).
. if so, traders can set orders based on Price Action and expect to reach short-term targets."
Technical analysis:
. USDSGD is in an uptrend, and the continuation of the uptrend is expected.
. The price is above the 21-Day WEMA, which acts as a dynamic support.
. The RSI is at 79.
Take Profits:
TP1= @ 1.3706
TP2= @ 1.3784
TP3= @ 1.3859
TP4= @ 1.3935
TP5= @ 1.3975
SL= Break below S2
❤️ If you find this helpful and want more FREE forecasts in TradingView
. . . . . Please show your support back,
. . . . . . . . Hit the 👍 LIKE button,
. . . . . . . . . . Drop some feedback below in the comment!
❤️ Your support is very much 🙏 appreciated!❤️
💎 Want us to help you become a better Forex / Crypto trader?
Now, It's your turn!
Be sure to leave a comment; let us know how you see this opportunity and forecast.
Trade well, ❤️
ForecastCity English Support Team ❤️

💡Don't miss the great buy opportunity in USDSGDTrading suggestion:
". There is a possibility of temporary retracement to the suggested support line (1.3580).
. if so, traders can set orders based on Price Action and expect to reach short-term targets."
Technical analysis:
. USDSGD is in an uptrend, and the continuation of the uptrend is expected.
. The price is above the 21-Day WEMA, which acts as a dynamic support.
. The RSI is at 79.
Take Profits:
TP1= @ 1.3706
TP2= @ 1.3784
TP3= @ 1.3859
TP4= @ 1.3935
TP5= @ 1.3975
SL= Break below S2
❤️ If you find this helpful and want more FREE forecasts in TradingView
. . . . . Please show your support back,
. . . . . . . . Hit the 👍 LIKE button,
. . . . . . . . . . Drop some feedback below in the comment!
❤️ Your support is very much 🙏 appreciated! ❤️
💎 Want us to help you become a better Forex / Crypto trader ?
Now, It's your turn !
Be sure to leave a comment; let us know how you see this opportunity and forecast.
Trade well, ❤️
ForecastCity English Support Team ❤️

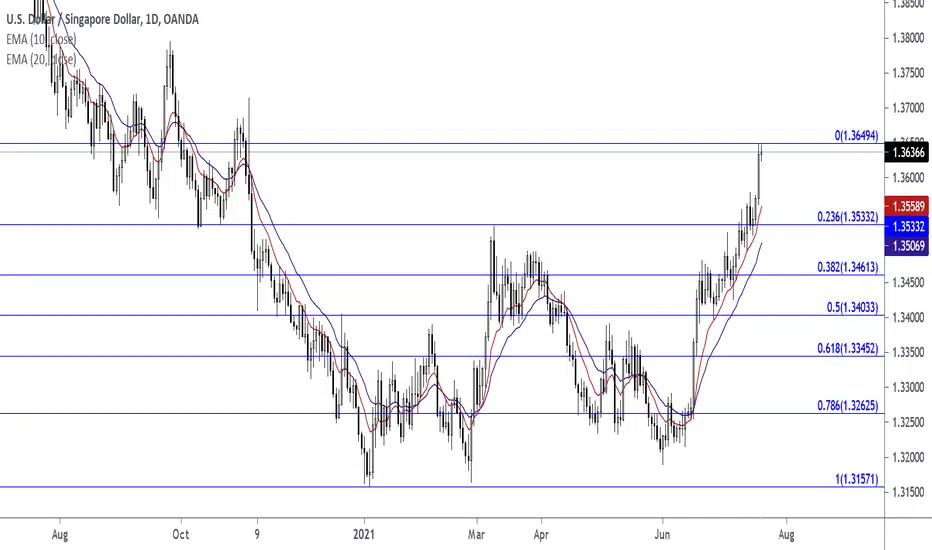
USDSGD Entry Price 1.35332USDSGD Fibonacci Retracement Level 0.236; Price 1.35332
USDSGD EMA 10 Close; Price 1.35417
USDSGD EMA 20 Close; Price 1.34932
USDSGD-Expecting for correction for b) wave...labelling changed.Market Commentary:
LEARNING ELLIOTT WAVES IS LITTLE BIT TOUGH (FOR ME IN BEGINNING) BUT I TOOK IT AS A CHALLENGE AND THAT IS NOT IMPOSSIBLE ALSO...
First have an look for the positional trend i shared here previous....if you are a follower of me...and sometimes i will share the counter trend trade also in 15 mins and 1hr...but that is risky ones...so if the trend is bearish or bullish, if i am expecting the correction...book the profit there and wait the correction to end and again go with the trend....DONT TRADE THE COUNTER TRADE SETUP...you will took loss too...try to identify the short term pull back and the long term pull back after that took small lots in the short term PB with strict stop and go with big lots in the trend side that is long term. I WONT TOOK ALL THE TRADE PLAN SHARED HERE...
Read the market commentary inside the chart what i shared here carefully and try to learn Elliott waves...otherwise its tough to understand the market commentary and my analysis. I wont give a entry, stop loss and take profit in my chart...it is only for EDUCATIONAL PURPOSE and i am sharing how i am analyzing the pair and labeling them according to the Elliott wave theory...I AM JUST SHOWING THE TREND HOW IT MAY GO AND MY VIEW(it may wrong too)..so DON'T FOLLOW BLINDLY MY CHART..take this as a reference and if it correlate to you strategy took the trade as per your strategy...DON'T ASK ABOUT YOUR RUNNING TRADES i wont comment on them and I WONT SUGGEST TO TAKE MY TRADE SETUP.
I am a technical analyst based on trendline, channel, fib retracements, expansion, stochastic for divergence, EMA's and MA's are finding the pull backs and MAJOR IS ELLIOTT WAVES...those mentioned above are using as a TOOLS only. I am not a fundamental, sentimental trader...but only the fundamental will boost my technical analysis to reach my target or sometimes it will go against me and then i will manage the trade according to the Elliott waves alternate views...Each and every trade plan i am sharing here has a alternate view and i am sharing only the most probabilities(70-80%) here...sometimes the other (20-30%) may market do..then i will change the wave counts and labeling according to the price action.
All labeling and wave counts done by me by manually and i will keep change according to the LIVE MARKET PRICE ACTION. So dont bias, hope on my trade plans...try to learn and make your own strategy...Following is not that much easy...I AM NOT RESPONSIBLE FOR ANY LOSSES IF U TOOK THE TRADE ACCORDING TO MY TRADE PLANS....THANKS LOT..CHEERS

COT CURRENCY REPORTAUD, NZD & CAD:
It’s important to keep in mind that since the RBNZ meeting took place on Tuesday, we won’t see a lot of the upside in the currency we had this past week reflected in the CFTC data as yet. After the hawkish tilt by the bank as well as the solid beat in Q2 CPI data, expectations for hikes this year have risen substantially, and barring any major risk off tones we would expect a favourable environment for the NZD going into the August meeting.
For the CAD, the fact that we it was one of the biggest position unwinds makes a lot of sense, as it shared a similar fate with the other two biggest net long currencies among the majors (EUR and GBP). The bias for the CAD remains tilted to the upside, but with a lot of the positives already reflected in the price, it will take a lot more positive news to see more meaningful upside in the currency.
For the AUD, the virus situation is a negative driver to keep on the radar. Two of the largest cities in the country is already in snap-lockdowns, and further aggravation of the situation could develop into a key sentiment driver in the short-term, so definitely one to watch.
JPY, CHF & USD:
The JPY saw quite a sizeable lift in terms of positioning, with another big batch of short positions being dumped. The hefty increases in short-term positioning over the past few weeks was arguably driven by the fundamental outlook, partly driven by summer liquidity ramping up carry trade activity.
Thus, the currency is always going to be vulnerable to see some of that unwind, especially when we have bouts of risk off flows as we’ve seen occur over the past two weeks.
For the US Dollar, as the fundamental bias remains neutral and as we are well within the summer liquidity period, the main driver for the USD has been the incoming economic events as expected. This past week we had Fed Chair Powell’s testimony where his persistent dovish tone, despite rising inflation data, saw some minor downside in the greenback, but retail sales also saw some additional excitement.
This week will be a very quiet one for the Dollar in terms of events, so be on the lookout for Fed speak, and also keep track of the overall risk sentiment.
GBP:
Doves turning into hawks. This past week saw some very interesting comments coming out from the more dovish leaning members of the BoE, with BoE’s Saunders paving the way expectations that the bank could announce an early end to their QE program at their next meeting.
This saw decent upside in Sterling, as it confirmed the market’s ongoing expectations that the BoE will be reducing accommodative policy in the weeks ahead, but also due to the fact that these hawkish comments came from a dovish member of the bank.
This week we look to comments from BoE’s Haskel who is considered as the most dovish member of the bank. If he paints a similar picture to that of Saunders, the markets will arguably be quick to price in a tapering announcement for the upcoming meeting.
Keep in mind the upside in Sterling occurred at the latter part of the week which means the CFTC data does not reflect it. The big reduction in net-longs is in line with more unwind in the biggest net-long positions versus the US Dollar.
EUR:
Despite the big reductions we’ve seen in EUR net-long positioning, the currency remains the biggest net-long position versus the greenback among the majors. With the Dollar’s fundamental outlook turning more neutral, the outlook for the EUR remains tilted to the downside.
Majority of the upside in the EUR from expectations about a EU economic recovery going in Q3 was already reflected in the price before the recent FOMC meeting, which left the EUR exposed to lots of downside from a positioning point of view.
Even though the bias for the EUR remains weak bearish, the amount of one-sided price action post the June FOMC meeting has seen the currency lose a lot of ground, which means we do want to be mindful of some reprieve from some possible mean reversion.
This week we have the July policy meeting which was made more important by comments from ECB President Lagarde who stated that markets can expect updated forward guidance at the meeting in line with their new strategic framework, even though Friday sources pieces suggest otherwise.
*This report reflects the COT data updated until 13 July 2021.


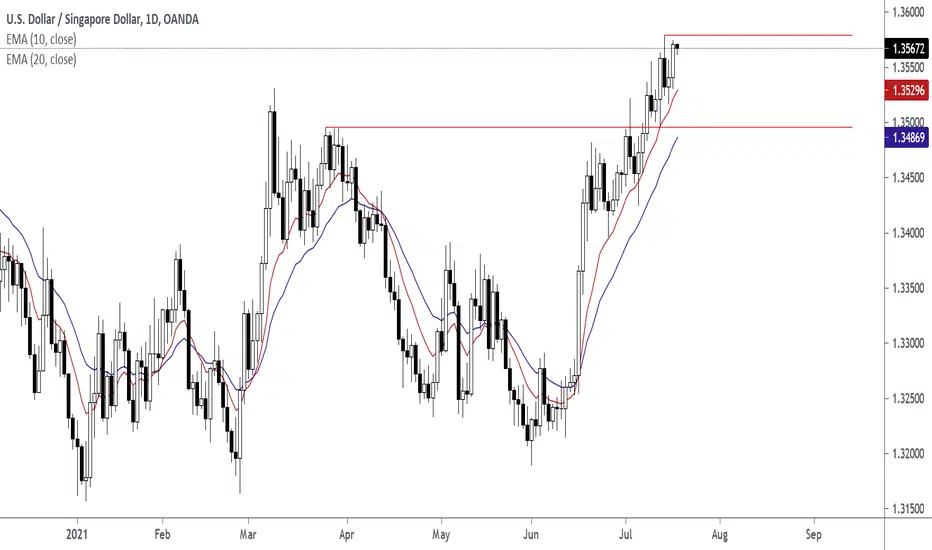
USDSGDIt is a 1.3548 as we speak. If you like to have a higher USD against SGD. You can observe 1.3557 on the 4-hourly chart(UTC+3), if it touches 1.3557 and fail to close above 1.3580, then that probably is the best rate to change. If a break and close above happen, you can wait for 1.3609.

USDSGD-Wedge formation in wave 5 of V) now a,b,c to 1.34 ?Dear friends,
Don't follow me blindly...what i am sharing here, is my knowledge not signals
I am sharing my view through Elliott waves from past 4 yrs....i learned tons and tons here and market taught me lot and still teaching and i am listening to the market..i am sharing here my view for a educational purpose and i am still a learner and i am sharing not my view, its my experience if u PURELY LISTENNED to my MARKET COMMENTARY... i am not a market mover...just i am keep changing my view according to the PRICE ACTION and i written detailly about that in market commentary...there is no short cut to earn money and cant make a fast cash...if u do that , it may go like that....
My ambition is to create an awareness to the traders, to promote the education not to do BLINDLY...If u look my past 4 yrs chart and now...i fine tuned or refined my strategy...and still looking for finetune...so if u r following my trade plans as a signal its not my fault...If you are not encouraging also not mind but dont discourage...if you are not comment also dont leave the negative comments, if you are not motivate also dont demotivate...because NAGATIVE is more powerful than POSITIVE...i wont care about such comments...because of your comments i wont stop anything in MY PRACTICE...it will take time and to digest such comments for first 2-3 days and again i rebuilt my positive activity and my view and then again i keep start my sharing...i dont need a roadblocks in my journey. If it happen also i need to cross that and i continue...but that crossing time is DELAY for my journey to reach my GOAL...so try to be a friend...just learn or leave .if you didnt like a page in your story book just turn that... Don't look that, Like that dont look my chart...just skip that...thanks lot ...here some quotes by BRUCE LEE...
1. I fear not the man who has practiced 10,000 kicks once, but i fear the man who has practiced one kick 10,000 times
2. A GOAL is not always meant to be reached, it often serves simply as something to AIM at
3. Those who are UNAWARE they are walking in darkness will never seek the light
4. To hell with circumstances i create the opportunities
5. I don't teach you anything. I just help you to know yourself
6. Always be yourself, express yourself, have a faith in yourself, do not go out and look for a successful personality and duplicate it.
7. Don't fear failure... in great attempts it is glorious even to fail
8. Absorb what is useful, reject what is useless, add what is specifically your own
9. Notice that stiffest tree is most easily cracked, while the bamboo or willow survives by bending with the wind
10. The successful warrior is the average man with laser-like FOUCS -

USDSGD Trading Plan - 13/Jul/2021Hello Traders,
Hope you all are doing good!!
I expect USDSGD to go down soon enough.
Look for SELL setups.
Please follow me and like if you agree or this idea helps you out in your trading plan.
Disclaimer: This is just an idea. Please do your own analysis before opening a position. Always use SL & proper risk management.
Market can evolve anytime, hence, always do your analysis and learn trade management before following any idea.

USDSGD-Wave a) going to complete and b) @ 1.3400 and C) to 1.38 Market Commentary:
LEARNING ELLIOTT WAVES IS LITTLE BIT TOUGH (FOR ME IN BEGINNING) BUT I TOOK IT AS A CHALLENGE AND THAT IS NOT IMPOSSIBLE ALSO...
First have an look for the positional trend i shared here previous....if you are a follower of me...and sometimes i will share the counter trend trade also in 15 mins and 1hr...but that is risky ones...so if the trend is bearish or bullish, if i am expecting the correction...book the profit there and wait the correction to end and again go with the trend....DONT TRADE THE COUNTER TRADE SETUP...you will took loss too...try to identify the short term pull back and the long term pull back after that took small lots in the short term PB with strict stop and go with big lots in the trend side that is long term. I WONT TOOK ALL THE TRADE PLAN SHARED HERE...
Read the market commentary inside the chart what i shared here carefully and try to learn Elliott waves...otherwise its tough to understand the market commentary and my analysis. I wont give a entry, stop loss and take profit in my chart...it is only for EDUCATIONAL PURPOSE and i am sharing how i am analyzing the pair and labeling them according to the Elliott wave theory...I AM JUST SHOWING THE TREND HOW IT MAY GO AND MY VIEW(it may wrong too)..so DON'T FOLLOW BLINDLY MY CHART..take this as a reference and if it correlate to you strategy took the trade as per your strategy...DON'T ASK ABOUT YOUR RUNNING TRADES i wont comment on them and I WONT SUGGEST TO TAKE MY TRADE SETUP.
I am a technical analyst based on trendline, channel, fib retracements, expansion, stochastic for divergence, EMA's and MA's are finding the pull backs and MAJOR IS ELLIOTT WAVES...those mentioned above are using as a TOOLS only. I am not a fundamental, sentimental trader...but only the fundamental will boost my technical analysis to reach my target or sometimes it will go against me and then i will manage the trade according to the Elliott waves alternate views...Each and every trade plan i am sharing here has a alternate view and i am sharing only the most probabilities(70-80%) here...sometimes the other (20-30%) may market do..then i will change the wave counts and labeling according to the price action.
All labeling and wave counts done by me by manually and i will keep change according to the LIVE MARKET PRICE ACTION. So dont bias, hope on my trade plans...try to learn and make your own strategy...Following is not that much easy...I AM NOT RESPONSIBLE FOR ANY LOSSES IF U TOOK THE TRADE ACCORDING TO MY TRADE PLANS....THANKS LOT..CHEERS


USDSGD : Bullish trade ideaWeekly created FVG
Daily came and tested that FVG, created an OB in the process
We look to trade a 2H OB+ zone within that Daily OB+


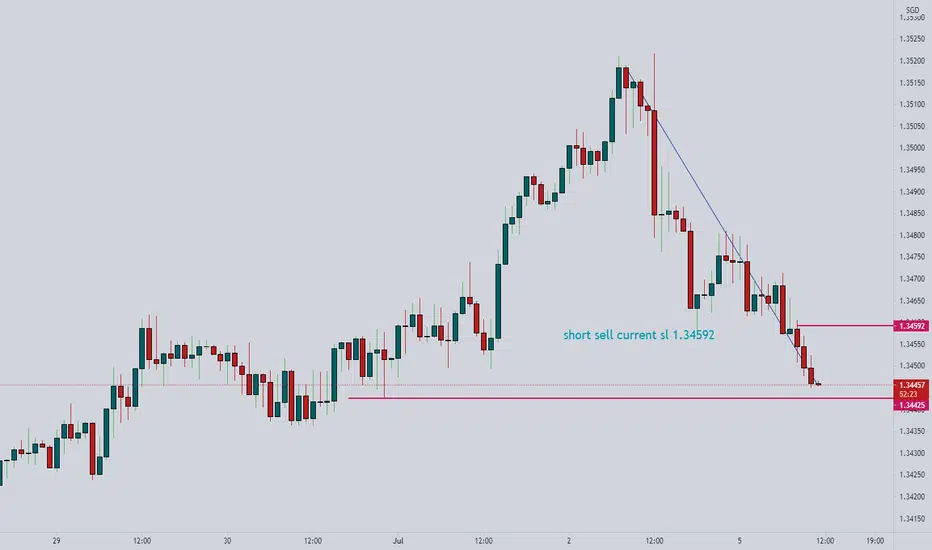
USDSGD shortUSDSGD has so far rejected a strong supply zone. And the double top theory is very clear. An 80-140 pip magnitude crash is expected. Keep in mind that this is a fairly risky pair