USDSGD TRADE IDEA : LONG | BUYPrice will seek to continue trending in the same direction in which it came down. A few breaks on the bigger TF helped me confirm this buy.
RR: 3.98
N.B.: This is not financial advice. Trade safely and with caution.
USDSGD trade ideas

Fri 31st Jan 2025 Daily Forex Charts: 3x New Trade SetupsGood morning fellow traders. On my Daily Forex charts using the High Probability & Divergence trading methods from my books, I have identified 3x new trade setups this morning. As usual, you can read my notes on the charts for my thoughts on these setups. The trades being a EUR/USD Sell, NZD/USD Sell & a USD/SGD Buy. I also discuss some trade management. Enjoy the day all. Cheers. Jim

DOA Trading Strategy - USDSGD#USDSGD - Red DOA sniper and meter are holding strong on 4hrs
We’ve created a double top as well
We should see a nice drop on this soon

#002 Obvious Range USDSGD ShortOk. I am feeling sick since last week. Might be due to the rain, and dust allergen due to CNY spring cleaning as well as weak immune system and late owl habits.
I wanted to record this trade but then my mind drifted away, and I went out of my house to collect my CBF190R tire valve cap, installed it, revved it abit and came home to pay my wifi payment, then I now realised I have a position going on and I havent recorded it!
Guess what. It got closed out for 0.44R TP.
So, here's the aftermath.
1744SGT 27012025
No more trading for the next two week I think.
I just received my reservist recall order, going in at 7th April to 27th April. 7th cycle.
1745SGT 27012025

usdsgdThe prediction of this future may be due to the stronger dollar and Mr. Trump's actions. Also, the Eastern reaction to the actions of the West is in the spotlight.
This is a technical analysis of the future that may take four years and may not happen any thing

USDSGD: Potential Short from Key ResistanceThe USDSGD pair is approaching a notable resistance zone around the 1.37160 level, an area that has historically acted as a supply zone, leading to price reversals. The current price action shows signs of hesitation as it tests this zone, which could indicate potential weakness.
If sellers regain control, the pair could reverse downward, with the 1.35041 level being a likely target for the next support zone.

USD/SGD - Bearish Head and ShouldersThis analysis focuses on the historical performance of the USD/SGD pair, specifically in the month of December, over the past decade. The identified pattern is a bearish head and shoulders formation, a classic technical analysis pattern signaling potential downward movement.
Key Points:
Pattern Recognition: The USD/SGD pair has exhibited a bearish head and shoulders pattern multiple times over the last 10 years. This pattern typically consists of three peaks, with the highest one (head) between two lower peaks (shoulders).
December Trends: The interesting observation is that this bearish pattern tends to manifest during the month of December. The pattern's recurrence in December may suggest a seasonal trend or specific market dynamics during this month.
Historical Frequency: Through careful analysis of historical price data, it has been identified that the USD/SGD pair displayed this bearish pattern in December on six occasions within the past decade.
Cautionary Note: While historical patterns provide valuable insights, it's essential to consider current market conditions, economic indicators, and geopolitical factors before making any trading decisions.
Recommendation:
Traders may want to closely monitor the USD/SGD pair in December, keeping an eye on the neckline of the bearish head and shoulders pattern as a potential entry or exit point.
Additional confirmation from other technical indicators and fundamental analysis is advisable before executing any trades.
Disclaimer:
This analysis is for informational purposes only and should not be considered as financial advice. Trading involves risks, and users are encouraged to conduct their research or consult with financial professionals before making any trading decisions.

Tue 7th Jan 2025 Daily Forex Charts: 4x New Trade SetupsGood morning fellow traders. On my Daily Forex charts using the High Probability & Divergence trading methods from my books, I have identified 8x new trade setups this morning. As usual, you can read my notes on the charts for my thoughts on these setups. The trades being a AUD/USD Buy, EUR/USD Buy, GBP/USD Buy & NZD/USD Buy. I also discuss some trade management. Enjoy the day all. Cheers. Jim

expanding triangle (e wave)Relook at the USD SGD chart. The movement of the pair has been bounded between 1.3 and 1.45 for the past decade. This limited range and its pattern suggested that the pair may be in the "e'" wave of an expanding triangle as depicted in the chart. We are looking at the 1.5 region before heading down again.

Fri 27th Dec 2024 USD/SGD Daily Forex Chart Sell SetupGood morning fellow traders. On my Daily Forex charts using the High Probability & Divergence trading methods from my books, I have identified a new trade setup this morning. As usual, you can read my notes on the chart for my thoughts on this setup. The trade being a USD/SGD Sell. Enjoy the day all. Cheers. Jim

Bullish Liquidity Grab on USD/SGD ExpectedTechnical Analysis
Monthly Chart:
On the monthly chart, USD/SGD has shown a recovery after testing significant support zones, indicating that buyers stepped in to defend these levels. However, the recent upward movement appears overextended, suggesting a potential slowdown or correction in the near term. This aligns with broader market dynamics and the technical exhaustion seen after extended bullish runs.
Daily Chart:
The daily chart offers more clarity on current price action:
Double High Formation: Two equal highs have formed on the chart, a classic indication of liquidity resting above these levels. From a price behavior perspective, this suggests that the market is likely to push upward to liquidate these equal highs before considering a significant move lower.
Consolidation Zone: The price is currently consolidating, which often precedes a breakout. This consolidation reinforces the likelihood of a push higher to clear liquidity, especially when aligned with the broader USD dynamics.
Fundamental Analysis
U.S. Dollar Factors Impacting USD/SGD:
The strength of the U.S. Dollar (DXY) plays a crucial role in USD/SGD movements. Here's how recent developments affect the pair:
Liquidity Grab in DXY: The DXY recently breached its key level of 107.348 and is now showing bearish tendencies. However, short-term bullish corrections could provide temporary support for USD/SGD, aligning with the potential liquidity grab above the equal highs on the daily chart.
Interest Rate Outlook:
The Federal Reserve has shown hesitancy toward further rate cuts due to inflation concerns.
Robust labor market conditions, especially during the holiday season, reduce the immediate likelihood of aggressive rate cuts.
However, rising unemployment or stable-to-declining inflation could shift this outlook, leading to USD weakness and potential corrections in USD/SGD.
Upcoming Economic Catalysts:
Nonfarm Payrolls (NFP) and unemployment data later this week are expected to influence USD sentiment significantly. If unemployment increases as expected, it could lead to a broader decline in the U.S. Dollar, impacting USD/SGD.
Summary and Outlook
Technical Expectations:
Short-Term: USD/SGD is likely to push higher to liquidate the equal highs on the daily chart, given the consolidation and market behavior around these liquidity zones.
Post-Liquidity Grab: After clearing the highs, a correction is probable, particularly if the broader U.S. Dollar weakens. This correction could take the pair back toward key support levels, depending on fundamental triggers.
Key Factors to Monitor:
DXY price action, particularly around its short-term support zones.
NFP and unemployment data for clues on the U.S. labor market and inflation trends.
Any changes in Federal Reserve policy outlook or macroeconomic developments in Singapore.
Price Outlook:
In the short term, USD/SGD may target the equal highs as a liquidity zone.
In the medium term, the pair could correct lower following the liquidity grab, aligning with overextended technical patterns and potential USD weakness driven by fundamental factors.
By aligning technical insights with the fundamental outlook for the U.S. Dollar, traders can anticipate near-term bullish moves in USD/SGD, followed by a potential correction.

usdsgd best level to short/hold tp1/tp2 +150/+300 pips swing 🔸Hello traders, let's review the D1 chart for USDSGD today. Trading
near premium prices of the multiweek range, closing in on heavy S/R
Currently risk/reward is shifting in bears favor, so it's recommended
to look for sell side setups in USDSGD.
🔸Heavy overhead mirror S/R zone at 3520/3540 expecting reversal
from overhead resistance. current bid is 3510 so final push required
before we can get a decent entry on sell side.
🔸Recommended strategy for USDSGD traders: focus on short selling any rips/rallies near MS/R 3520/3540 price is currently trading near premium levels and is almost maxed out already, limited upside. TP1 bears +150 TP2 bears +300 pips final exit 3220 keep in mind this is a swing trade setup so naturally will take more time to complete / hit both targets. good luck traders!
🎁Please hit the like button and
🎁Leave a comment to support our team!
RISK DISCLAIMER:
Trading Futures , Forex, CFDs and Stocks involves a risk of loss.
Please consider carefully if such trading is appropriate for you.
Past performance is not indicative of future results.
Always limit your leverage and use tight stop loss.

USDSGD long position For those trading on longer time frames (daily and weekly), this could be a good opportunity to consider opening a long position on #USDSGD. I set my limit buy order @1.28418
Please note, this is not financial advice—it's intended for training and learning purposes only.

USDSGD Bearish 2.57 position ideaDYOR. For USDSGD Seems good reverse pattern from important price band. SL and TP pointed on chart but could be get good take some profit if when price come 1:1 of SL and move stop to entry level .. Position management is important


USDSGD: ITF CURVE ANALYSIS (11H) - DOWNTREND✨ USDSGD: ITF CURVE ANALYSIS (11H) ✨ (DOWNTREND)
SLO2 @ 1.3517 ⏳
SLO1 @ 1.3435 - TRIGGERED
SSO @ 1.33573
TP1 @ 1.30517
TP2 @ 1.27948
TP3 @ 1.26056
TP4 @ 1.2500 (MAY CLOSE ALL ORDERS HERE-WILL WATCH PA ONCE TRIGGERED)
TP5 @ 1.23150
BLO1 @ 1.2485⏳(BASED ON HTF)
BLO1 @ 1.22432⏳(BASED ON ITF)
NOTE: ONCE PA BREAKS THROUGH THIS SUPPORT I'VE IDENTIFIED, I'LL USE CAUTION AFTER TP4 SINCE THE 5W IS SHOWING A DECENT DZ THAT PA COULD PLAY IN TO CREATE THE REVERSAL TO THE UPSIDE.
🔑
BLO = BUY LIMIT ORDER
DZ = DEMAND ZONE
HTF = HIGH TIMEFRAME
ITF = INTERMEDIATE TIME FRAME
PA = PRICE ACTION
SLO = SELL LIMIT ORDER
SSO = SELL STOP ORDER
TP = TAKE PROFIT
Intermediate time frames (4 hours to 6 day):
— Offer a clearer picture of the underlying trend compared to short-term frames.
— Provide more opportunities for confirmation signals and technical analysis.
— Allow for more flexible trading schedules, trades can be held overnight.
— Suitable for swing traders and some positional traders.

USD/SGD Price Action: A Bearish Outlook EmergesYesterday, the USD/SGD currency pair rebounded at a supply zone around 1.34500, creating a bearish candle that has persisted into today. As I write this, the price is currently around 1.34195.
Analyzing the technical landscape, the latest Commitment of Traders (COT) report reveals that retail traders remain in long positions, while other market participants have adopted a more neutral stance without clear positioning. This scenario could allow the Singapore Dollar to capitalize on a potential retracement of the US Dollar, potentially enhancing its value.
Looking at historical trends, our forecasting data indicates that over the past decade, this period of the year has frequently seen bearish retracements for the USD against the Singapore Dollar. Given the prevailing market conditions, traders may want to consider positioning themselves for short opportunities.
As the market evolves, it is crucial to monitor price movements and broader economic trends closely to make well-informed trading decisions.
✅ Please share your thoughts about USD/SGD in the comments section below and HIT LIKE if you appreciate my analysis. Don't forget to FOLLOW ME; you will help us a lot with this small contribution.

2025 - Not a year to visit USAIf the recent triumph win by Donald Trump is any guide, the strength in USD will continue and that means the SGD along with other Asian currencies will weaken.
That means, to exchange for one US dollar, we would need 1.338 Sing dollars as compared to using 1.28 SGD to exchange for 1 USD in Sept , 2 months ago...........
On a ground level, those who are buying from USA , moving from your Amazon to the bigger importers, this exchange rates is against us. If your buying is infrequent, then you may not bother too much.
How about travel ? The same thing - you would need to fork out more SGD to exchange for USD if the USD continues to strengthen against us.
Definitely bad for those who are sending kids to study in US as it involves a much larger sum of money.
So, you can invest in the USD to make some decent returns as well.
Please DYODD

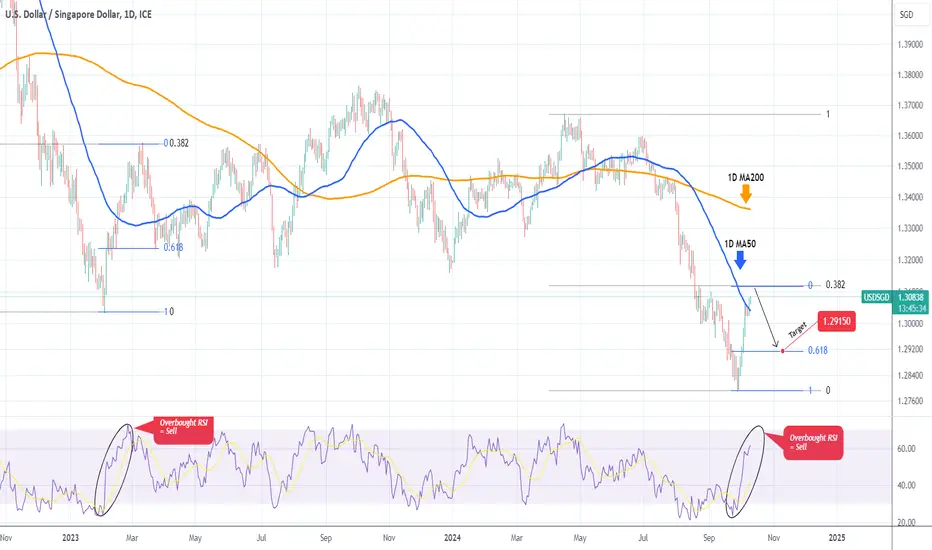
USDSGD Time to sell this rally.The USDSGD pair has been rebounding non-stop since the September 27 bottom and yesterday broke above its 1D MA50 (blue trend-line) for the first time in more than 3 months (since July 04). This confirmed that the correction since July is over but with the 1D RSI above 60.00 and heading towards the overbought barrier (70.00), we expect a rejection there.
In fact, there was a similar fractal that was rejected on March 10 2023, on the correction's 0.382 Fibonacci retracement level a little after the 1D RSI turned overbought. This resulted into a test of the 0.618 Fib of the rebound Leg.
As a result, we are expecting a rejection on the 0.382 Fib or when the 1D RSI gets overbought above 70.00 and our Target is the 0.618 Fib at 1.29150.
-------------------------------------------------------------------------------
** Please LIKE 👍, FOLLOW ✅, SHARE 🙌 and COMMENT ✍ if you enjoy this idea! Also share your ideas and charts in the comments section below! This is best way to keep it relevant, support us, keep the content here free and allow the idea to reach as many people as possible. **
-------------------------------------------------------------------------------
💸💸💸💸💸💸
👇 👇 👇 👇 👇 👇
USDSGD 11/09/2024Weekly:
-Fib completion -27%
-Deceleration.
Daily:
-Inverse H&S pattern.
-IC.
4H:
-Bullish M pattern.
-Inverse H&S pattern.
-IC.

Short-term BuyOn the H1 chart, after breaking the short-term downward channel, the price may remain consolidated between the main channel and the short-term channel resistance for a while. Those seeking safer trades can wait for the main channel to break. On the other hand, risk-takers can enter long positions from current levels.
Our primary price target is the 38.2% Fibonacci retracement level. However, we might see a pullback from the 23.6% level before reaching this target.

Looking for Long Term Hold (3-6months) for return of 8RThis is on USD/SGD, we can see for the last 7-9 years we have corrected through from 1.30-1.40 most of the time. This is a repeated pattern. Unless the US Economy faces recession, it is definitely a very sane&save investment.

USD/SGD Long Idea @ previous support USD/SGD Long Idea
Current Level 1.30680
TP Level 1.33350 (2%) 50% fib retracement level
SL Level 1.30227 (-0.40%)
Hovering around previous support levels which has held since 2015. Area has been tested multiple times on the daily/weekly chart.
SL is fairly tight, if it breaks through it could keep falling.
Long term target is 1.34000
