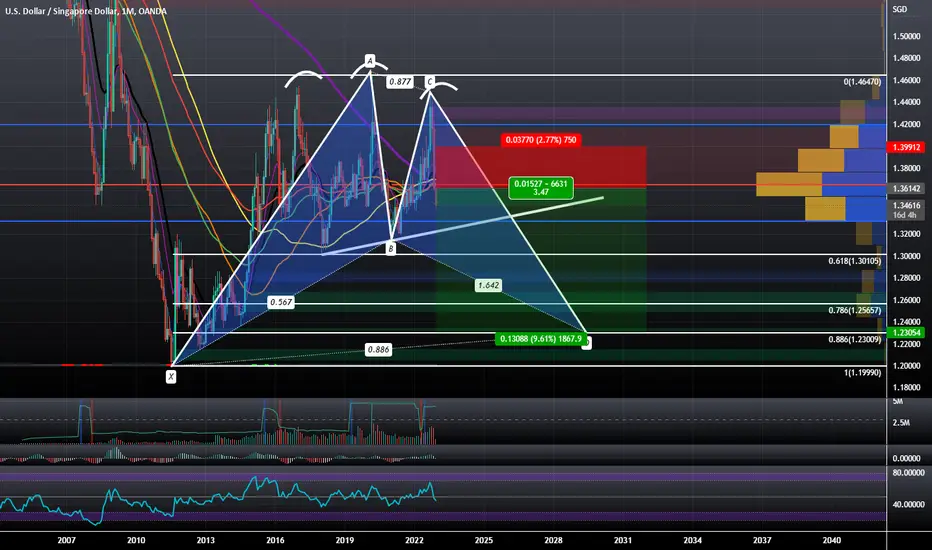
USDSGD Preparing to BreakdownUSDSEK is setting up in a Potential Bearish BAMM and is currently Below the POC and 200 Month Moving Average, this will kind of be a bet on the upcoming FOMC but i think whatever news we get will be used to dump the US Dollar and break down.
USDSGD trade ideas
Perfect automated detection of WhiteSwan pattern - LongA bullish-type big WhiteSwan pattern occurred within the support zone of 1.3410-1.3550.
Long after seeing the rebound. At that time, be careful of re-inversion in the resistance zone of 1.3830-1.3970.
*Harmonic patterns and support/resistance zones are automatically detected using the indicators below.
- Harmonic auto-detect PRO
- Support/Resistance Zone Auto PRO

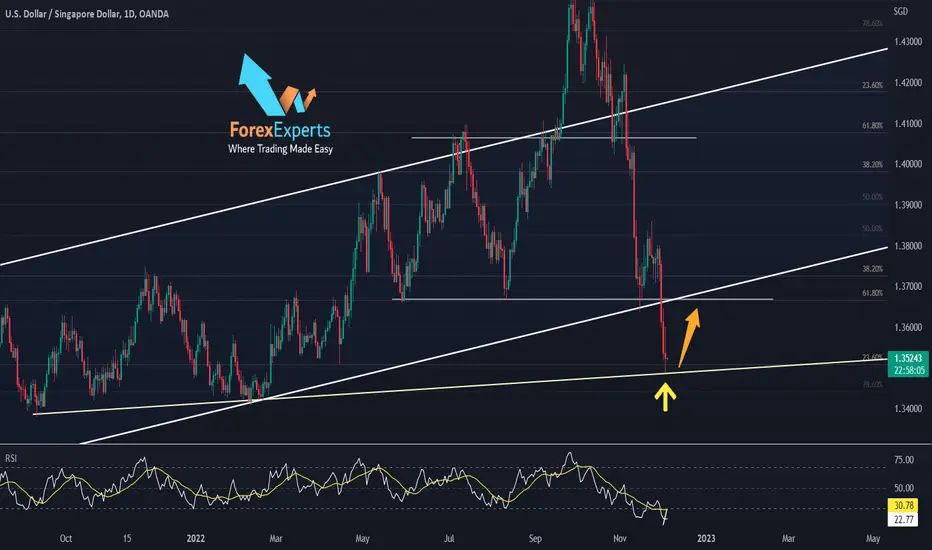
USDSGD coming back for a retestAfter USDSGD has escaped the ascending channel and the head and shoulders pattern, it is now touching an ascending trend line starting back from Sept 21 and touched again on Feb 22, also touching a 23.6 fib level,
currently looking to retest the previous support (neckline) and a 61.8 fib, which is now resistance @1.366, and also the lower channel line. Which was broken earlier.
in a 1-hour time frame appears to print a divergence on the RSI indicator, which indicates that we might have a change in the direction
--------------------------------
Feel free to share your thoughts in the comments, and kindly support the idea with a like. Your support is greatly appreciated!
GOING LONG IN USDSGDAscending channel visible and trend line is getting respect so taking taking trade on HL
TREND OVERALL IS BULLISH.


🟢 USDSGD - 4H (09.11.2022)🟢 USDSGD
TF: 4H
Side: Long
SL: $1.39610
Entry: $1.39858
TP 1: $1.40277
TP 2: $1.40690
TP 3: $1.41024
USD is gaining strength again so it's time to start buying it.

#USDSGD long#midterm trading idea
as you can see price recently test a very important static support area which has been tested 3 times before from above.
price took out liquidity from the lowest low of 3 bounces and failed to close below an arrow that we have on the chart. also if you check weekly timeframe you can see also price tested a 200 EMA as well and didn't close below EMA neither.
for taking this position:
1- we need a bullish engulfing candle which shows that bulls are back.
2- a bearish corrective to test supporting area
3- taking a position in direction of the primary trend which base on DOW theory is still intact and we still dealing with bullish market.
it is important also to have a look at DXY chart to make sure it holds above 104.620
trading idea is invalid if:
1- price close below 104.620 on DXY on Daily timeframe
2- price close below 1.3659 on USDSGD on Daily timeframe


USDSGD : Expecting this could be a end of "e" wave as a triangleDisclaimer :
LEARNING ELLIOTT WAVES IS LITTLE BIT TOUGH (FOR ME IN BEGINNING) BUT I TOOK IT AS A CHALLENGE AND THAT IS NOT IMPOSSIBLE ALSO...
First have an look for the positional trend i shared here previous....if you are a follower of me...and sometimes i will share the counter trend trade also in 15 mins and 1hr...but that is risky ones...so if the trend is bearish or bullish, if i am expecting the correction...book the profit there and wait the correction to end and again go with the trend....DONT TRADE THE COUNTER TRADE SETUP...you will took loss too...try to identify the short term pull back and the long term pull back after that took small lots in the short term PB with strict stop and go with big lots in the trend side that is long term. I WONT TOOK ALL THE TRADE PLAN SHARED HERE...
Read the market commentary inside the chart what i shared here carefully and try to learn Elliott waves...otherwise its tough to understand the market commentary and my analysis. I wont give a entry, stop loss and take profit in my chart...it is only for EDUCATIONAL PURPOSE and I am sharing how i am analysing the pair and labelling them according to the Elliott wave theory...I AM JUST SHOWING THE TREND HOW IT MAY GO AND MY VIEW(it may wrong too)..so DON'T FOLLOW BLINDLY MY CHART. Take this as a reference and if you correlates or merge to your strategy, took the trade as per your strategy...DON'T ASK ABOUT YOUR RUNNING TRADES i wont comment on them and I WONT SUGGEST TO TAKE MY TRADE SETUP.
I am a technical analyst based on trendline, channel, fib retracements, expansion, stochastic for divergence, EMA's and MA's are finding the pull backs and MAJOR IS ELLIOTT WAVES...those mentioned above are using as a TOOLS only. I am not a fundamental, sentimental trader...but only the fundamental will boost my technical analysis to reach my target or sometimes it will go against me and then i will manage the trade according to the Elliott waves alternate views...Each and every trade plan i am sharing here has a alternate view and i am sharing only the most probabilities(70-80%) here...sometimes the other (20-30%) may market do. Then I will change the wave counts and labelling according to the price action.
All labelling and wave counts done by me by manually and i will keep change according to the LIVE MARKET PRICE ACTION. So don't bias, hope on my trade plans...try to learn and make your own strategy...Following is not that much easy...I AM NOT RESPONSIBLE FOR ANY LOSSES IF U TOOK THE TRADE ACCORDING TO MY TRADE PLANS....THANKS LOT..CHEERS


USDSGD LONGPrice Action analysis for USDSGD. Happy trading everyone. Hope everyone enjoys their weekend. The weekends are so boring!!

Perfect automated detection of Pattern5-0 & WhiteSwan PRZ -ShortA bearish-type Pattern5-0 occurred near the resistance zone of 1.4180-1.4200.
If the price rises to 1.4204, a bearish-type WhiteSwan pattern could occur.
Short after seeing the rebound.
*Harmonic patterns and support/resistance zones are automatically detected using the indicators below.
- Harmonic auto-detect PRO
- Support/Resistance Zone Auto PRO

USD pairs testing key daily and weekly areas...USD pairs testing key daily and weekly areas... Some of which are shared in my charts above...
We could see some USD buying...
If the areas break, then perhaps a longer-term USD retrace move
I have been short USDJPY since 1.4930, so hoping for a break lower

Usdsgd having more bearish toneMore downside to come?
**Find out more from my Tradingview Stream this week**
***************************************************************************************
Hello there!
If you like my analysis and it helped you ,do give me a thumbs ups on tradingview! 🙏
And if you would like to show further support for me, you can gift me some coins on tradingview! 😁
Thank you!
Disclaimers:
The analysis shared through this channel are purely for educational and entertainment purposes only. They are by no means professional advice for individual/s to enter trades for investment or trading purposes.
The author/producer of these content shall not and will not be responsible for any form of financial/physical/assets losses incurred from trades executed from the derived conclusion of the individual from these content shared.
Thank you, and please do your due diligence before any putting on any trades!


USDSGD Buy Call @ 15 Minutes 17-Oct-22Wait for the resistance break
USDSGD Buy Call @ 15 Minutes
Entry: 1.42800
SL: 1.42566
TP: 1.42945

USDSGD Entered its 6 year Resistance Zone.The USDSGD pair has entered a Resistance Zone where it has made long-term tops and got rejected since January 2016. Even if the long-term pattern is a Channel Up, technically there isn't much room for further growth before a correction near the 0.786 Fibonacci retracement level at least.
It is interesting to see also that all rejections had the same aggressive sell-off behind them, reaching the middle of the Channel (0.5 Fib) in a matter of 2-3 months. Also check the 1W RSI. Strong rejections took place once it broke above the 70.000 overbought barrier. Right now we are above it.
-------------------------------------------------------------------------------
** Please LIKE 👍, SUBSCRIBE ✅, SHARE 🙌 and COMMENT ✍ if you enjoy this idea! Also share your ideas and charts in the comments section below! This is best way to keep it relevant, support me, keep the content here free and allow the idea to reach as many people as possible. **
-------------------------------------------------------------------------------
You may also TELL ME 🙋♀️🙋♂️ in the comments section which symbol you want me to analyze next and on which time-frame. The one with the most posts will be published tomorrow! 👏🎁
-------------------------------------------------------------------------------
👇 👇 👇 👇 👇 👇
💸💸💸💸💸💸
👇 👇 👇 👇 👇 👇

With USD strengthening, Usdsgd should be for a LONG***************************************************************************************
Hello there!
If you like my analysis and it helped you ,do give me a thumbs ups on tradingview! 🙏
And if you would like to show further support for me, you can gift me some coins on tradingview! 😁
Thank you!
Disclaimers:
The analysis shared through this channel are purely for educational and entertainment purposes only. They are by no means professional advice for individual/s to enter trades for investment or trading purposes.
The author/producer of these content shall not and will not be responsible for any form of financial/physical/assets losses incurred from trades executed from the derived conclusion of the individual from these content shared.
Thank you, and please do your due diligence before any putting on any trades!

USDSGD Looking For A Fade Ahead of 1.44In this update we review the recent price action in the USDSGD and identify the next high probability trading opportunity and price objectives to target

USDSGD POSSIBLE SHORT ON BREAK OF TRENDLINEWe could see SHORT positions if we break the up trendline and close below 1.4000. At that point we will have confirmed M pattern or a Double Top.

USDSGD idea (13/09/2022)USDSGD
We expect the continuation of the decline and correction on the pair in the coming period to end the correction in wave 2, and the correction may end at the 61% level at 1.3836 prices or the 78% level at 1.3764 prices before rising again

USDSGD pulling back. Two levels to buy.The USDSGD pair made a Double Top rejection two days ago and is currently on a strong bearish 1D candle. With the 1D RSI also rejected on a Double Top last since in September 29 2021, the next level to consider entering is just above the 1D MA50 (blue trend-line), which is where the June 16 Bull Flag found Support. A 1D candle close below the 1D MA50, should target the bottom of the long-term Channel, just above the 1D MA200 (orange trend-line), which is where the last two Higher Lows were formed on August 11 2022 and April 14 2022.
--------------------------------------------------------------------------------------------------------
** Please support this idea with your likes and comments, it is the best way to keep it relevant and support me. **
--------------------------------------------------------------------------------------------------------
