$USDT.D Reversal Incoming USDT.D is facing rejection at key resistance near 5% within a descending wedge.
If the trendline holds, we could see a sharp - 35% drop, a strong bullish signal for altcoins and the possible start of altseason.
DYOR, NFA
USDT.D trade ideas

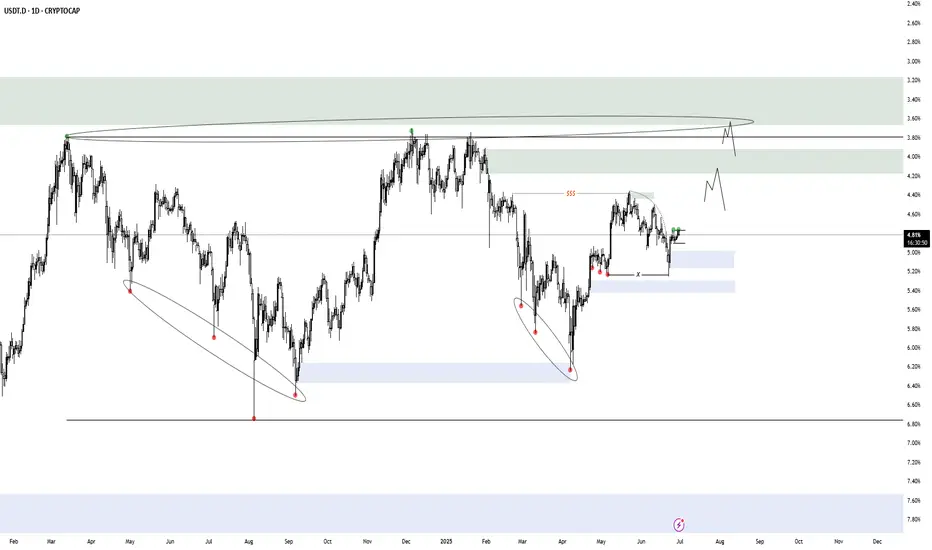
USDT DOMINANCE New Update (4H)This analysis is an update of the analysis you see in the "Related publications" section
The green box from the previous analysis was engulfed, and a new demand zone has been added to the chart.
Before the main drop, we still expect a pullback from this index
For risk management, please don't forget stop loss and capital management
Comment if you have any questions
Thank You

USDT.D is primed to fallI'd say USDT.D going to fall to at least 2.85%. That's the golden pocket of the previous uptrend.

USDT DOMINANCE New Update (4H) First of all you should know that "USDT Dominance" is always moving inverse of BTCUSDT .
In this analysis, we want to examine this index on lower timeframes. It has reached a support zone and a trendline.
Ideally, we should see a pullback from the green box toward the red box.
There is a high chance of price rejection from the red box to the downside, which could lead to a bullish move in the market.
Let’s see how the price reacts to the red box.
For risk management, please don't forget stop loss and capital management
Comment if you have any questions
Thank You

$USDT.D: Bearish ChartCRYPTOCAP:USDT.D | 3D
Price action on USDT dominance has been significantly cleaner than CRYPTOCAP:BTC in recent weeks, providing much clearer pivot signals.
On the 3-day chart, we can see that the 5% level has turned into a strong supply zone and is currently being rejected. If the price fails to reclaim the 5% level, it will likely move back down toward the 4.30% level.
Outlook: Expecting CRYPTOCAP:BTC to sweep local highs while CRYPTOCAP:USDT.D remains bearish.
Potential downside levels: 4.5% and possibly even 3.90%

USDT Dominance Update USDT Dominance got rejected from the 0.5 Fibonacci level and has broken down from the rising wedge pattern.
There’s short-term support at 4.81%, but if that breaks, we could head toward 4.37%, a major demand zone where dominance previously bottomed out.
A breakdown to that level could trigger strong momentum in altcoins!
If you find my updates helpful, don’t forget to like and follow for more!
DYOR, NFA
#USDT #Dominance

USDT - Hope AheadMorning my friends,
Figured I'd share a little bit of this USDT chart.
Deff showing a downtrend, even though our beloved coins are still suffering. Thats mainly because of BTC.D.
Once USDT moves lower, signaling a breakdown we should get a big relief, that if maybe paired with BTC.D moving lower as it is also near very strong resistance a bull market for alts will begin.
Keep an eye on this descending triangle breakdown.
Trade thirsty, my friends!

Marcet Cap of USDT Dominance Tether is fiat-collateralized stablecoin that offers individuals the advantages of transacting with blockchain-based assets while mitigating price risk. Tether is primarily issued on the Ethereum and Bitcoin blockchains and corresponds on a 1:1 basis with US Dollars sitting in bank accounts.

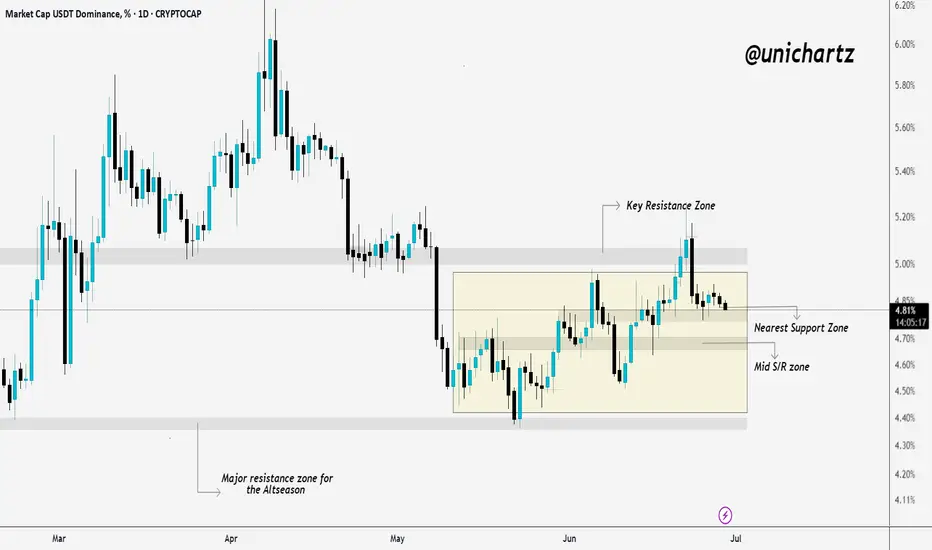
USDT Dominance Consolidating — Major Move Loading?USDT dominance is currently stuck in a sideways range between key resistance and strong support zones.
We’ve seen a rejection from the upper resistance, and now price is drifting toward the nearest support. If this zone holds, expect another bounce. If it breaks, altcoins could finally catch a strong bid — possibly the early signal for altseason.
No rush here. Just keep your eyes on that mid S/R level. It’s a key battleground.

USDT Dominance Update (2H)The USDT Dominance (USDT.D) chart — often referred to as the “reverse chart of crypto” — is currently showing signs of strength. On the micro time frame, a new impulsive wave structure has emerged, and we are likely progressing through wave 3 of this formation.
Wave 3 appears to be targeting the 4.88% level.
A minor correction (wave 4) may follow.
Ultimately, wave 5 is projected to reach the 5.00% zone.
Market Implications:
If this scenario unfolds as expected:
Bitcoin could down toward the $100,000–$101,000 range.
However, altcoins may face a sharp correction, with potential losses of 15–20%, exacerbated by the rising BTC dominance and capital flow concentration.
⚠️ While macro bullish momentum remains intact for the market, this short-term USDT.D surge could present a temporary but significant shakeout, especially across the altcoin sector.
— Thanks for reading.

USDT.D HTF AccumulationThats the HTF accumulation model i use as confluence to the potential HTF BTC distribution. I have inverted the chart so it's easier to see. I am watching one of these 2 demand zones for either a model 1 or 2. Can't wait to see how it will play out.
USDT - Head and Shoulders PatternA bullish head and shoulders pattern is an inverse head and shoulders. A bullish formation appears in a downtrend and signals a bearish-to-bullish trend reversal. The positions are opened according to the same logic as in a bearish modification. You need to expect the breakout of the neckline and its test. Then the bullish head and shoulders pattern stocks, for example, signals to enter a long.


BTC: Top and bottom for this cycleHello
Looking at this chart, BTC will go make new ATH very soon and might peak out in Dec 2025.
As per previous cycle 2026 is going to be the bear market.
Trade carefully
Cheers $CRYPTOCAP:USDT.D/CRYPTOCAP:BTC.D

Usdt dominance at resistance Now is not the time to panic btc trading in a range over 100k . I think the market hold this support also it’s a bearish flag . Btc dominance is also near resistance

Stablecoin Dominance vs Altcoins – Final Altseason Loading?This chart visualises a powerful relationship — stablecoin dominance (USDT.D + USDC.D) versus OTHERS dominance (i.e. altcoins excluding BTC and ETH).
Put simply:
When this chart moves down, stablecoins are flowing into altcoins — risk-on behavior, altseason ignites.
When it moves up, capital rotates back into stables — risk-off behavior, weakness across alts.
This has nailed every major altseason impulse and correction cycle over the past few years.
Right now, we’re seeing this pair push higher into a key supply zone — the same distribution range it previously broke down from. My expectation is a retest of that breakdown zone, which should align with a short-term correction in the altcoin market.
📉 Once this retest plays out and we see signs of weakness at supply, I anticipate continuation bearish in this pair — leading to stablecoins flowing back into altcoins.
That next leg down into higher time frame demand could mark the final altseason push, before the broader market tops out. If we follow the usual cycle pattern, that last alt impulse will likely drag retail back in for the top — just before distribution takes over and the bear phase begins.
🧠 In short:
Push into supply → altcoin correction
Breakdown → capital rotation back into alts
Final altseason + market top → bottoming of this chart + reversal bullish
This will be a key chart I’ll track closely over the next few months — it offers one of the cleanest reads on altcoin liquidity flow and timing for top formation.
1W:

Do you wanna see the bigger picture? (USDT.D Analysis 12H)After counting many waves for many days, I have a senario for USDT dominance which will lead the entire market on its way.
For those whose not fimiliar with this parameter, there is a very simple explanation.
It's the reversed way to see the market. If this parameter drops, your alts will skyrocket and if it rises, you're gonna be crying on somebody's X post's comments.
First of all, the short term wiev is bearish. We are currently in an impulsive wave 3 which is expected to be hardest for altcoins at the moment. There will be crash unless the value of this parameter drops below %4.50 and invalidates the analysis (you'll like this senario better, trust me).
All right, we got rid of the scalpers who bothered to read this far and now I'm here to explain what I see for the golden future.
Currently, USDT.D is forming a BEARISH impulsive wave for higher time frames. As long as you stick with 4H candles, you won't be able to see it.
USDT.D is trying to forming its bearish flag, by doing so it will be its second wave and will prepare its very own collapse.
Last summer, BTC has done the same thing (Check for daily time BTC).
There is more.
If we calculate the depth of this incoming flag pattern, breaking this flag would lead USDT to %3.75 which is the yearly support (Check in weekly, you'll see it).
If we calculate the time needed to past for this flag to work, it's the same amount of time needed for previous flag to break from last summer.
We also need to add fundementals in it. Currently people started to talk about a senario which will lead world to WW3. I don't think that will happen. But the problem in here is it will market throguh downside.
Furthermore, there is FED.
FED is insisting to leave interest rates on its own without a change. I believe that we won't be seeing any rate cuts till the end of this summer.
I believe that the FED will cute rates between Agust and September. This will be the fuel for our rocket to fly and ignite the wave 3.
I know it's a long script but you know it's necessary.
Thanks for reading.


#ALTCOIN UPDATE: URGENT!CRYPTOCAP:USDT Dominance Update: Didn't quite expect this move to be honest. I was only half right.
4.65% acted as a strong support.
Bulls are losing steam, bears are stepping in, but there's a catch:
USDT Dominance is now testing a key trendline resistance after multiple clean rejections in the past.
This bounce from the 4.55% zone came with momentum, but unless we see a clear breakout above 4.98%, there's still a chance we can get some relief in BTC and Alts after forming a double/triple bottom in LTFs.
If that happens, watch 4.51%, a breakdown here might trigger the altseason spark and fuel BTC's next big run, till then, stay cautious.
You've been warned!
Decision time is near.
Please hit that like button and share. Your views in the comments.
Thank you
#PEACE


USDT.D LONG - MID TERM PLANUSDT.D is one of the best tools to understand what's happening in the crypto market.
It shows the dominance of USDT across the entire space — and has a strong inverse correlation with BTC and crypto assets.
Technicals:
USDT.D is approaching its long-term support trendline.
I expect a deviation below that line — possibly toward the 0.75 Fibonacci level — before a strong move up.
That move could last 1–3 months, which means more downside for alts during this time.
Plan:
Shorting altcoins — especially ETH-related tokens and memecoins.
Looking to buy back around early August.

USDT.D Original idea inspired by trader SpartaBTC — highly recommend checking out their page.
On the chart, we can clearly see a descending channel. Historically, every time the price touched the upper boundary and started moving down toward the lower one, it marked the beginning of a broader crypto market rally.
Potential targets are shown on the chart.
