Usdt.dTether dominance is very bullish, I think crypto will be very red, sorry for those who have invested in crypto…. Be careful
USDT.D trade ideas

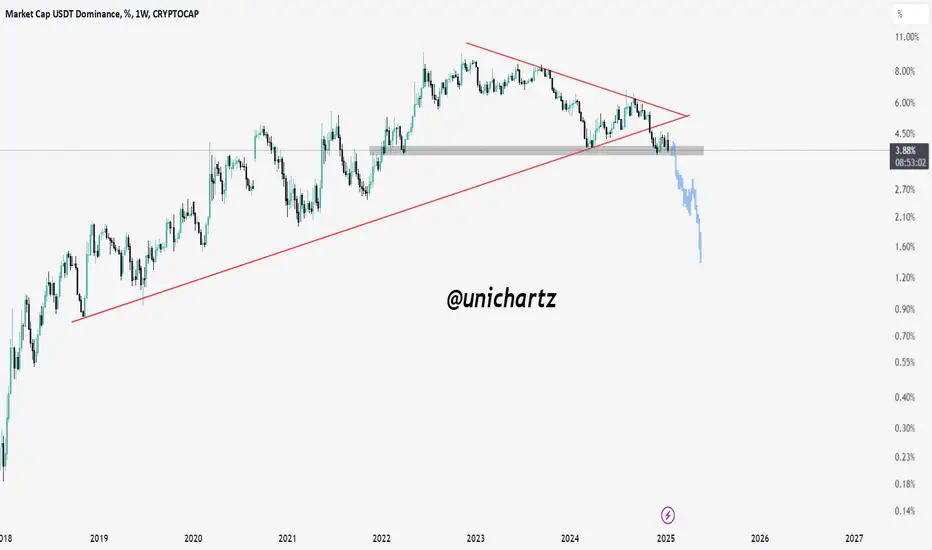
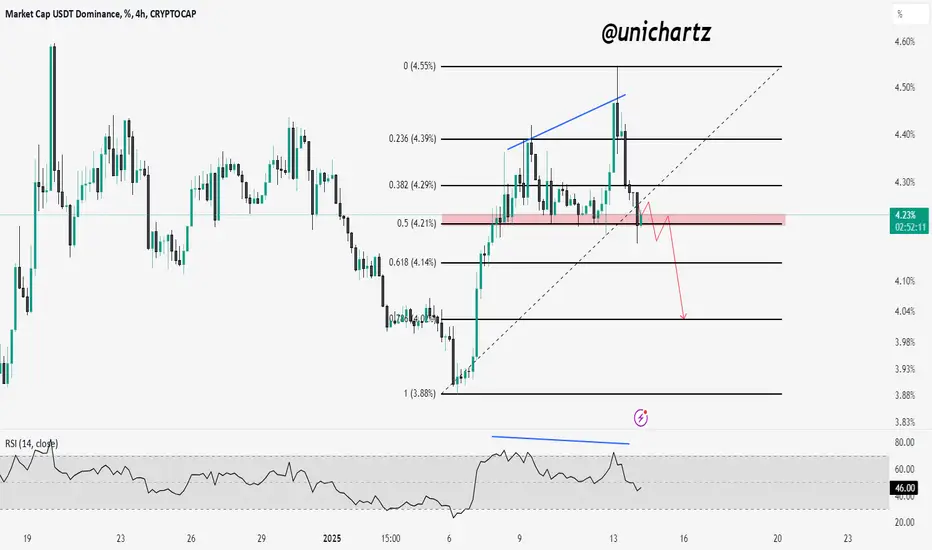
USDT.D Retests Breakdown: Is a Strong Altcoin Rally Ahead?USDT Dominance (USDT.D) has broken below its rising trendline and is trading at a key support zone after a successful retest of the breakdown. A break below this support could trigger a sharp decline, signaling capital rotation into altcoins.
This setup aligns with the potential for a strong altcoin season and an active trading period ahead.
USDT.D Inverted Chart: Targeting 1.0 Fib Level by Mid-2025The inverted USDT.D chart has broken out of the white resistance trend and is currently just below the 0.786 Fib level. I believe we will remain below this level during a dip next week, then continue upward after December 4th. Following that, I expect we will grind up the channel until we reach the 1.0 Fib level at 1.56%, just before the 50% dotted lines intersect with the Fib level (around June–August).

The broader outlook of Tether dominance (8H)First of all you should know that "USDT Dominance" is always moving inverse of BTCUSDT
Many are asking about a broader perspective on Tether dominance. Our outlook from a zoomed-out perspective is as follows.
The green zone is very strong and unbreakable!
For risk management, please don't forget stop loss and capital management
Comment if you have any questions
Thank You

Usdt.dominance Be carefull am expecting volatility on the weekend , right at support usd.d going up means crypto market go down . if support breaks we can expect crypto to keep going up but because its at support i sold some position just in case

USDT.D updateas predicted in my previous analysis , USDT made a correction and we are having a huge pump in the market specially alt coins. Let’s see how far can we drive the prices up as USDT.D continues to fall.
DYOR
Goodluck

Reversal break to the upsideWith all the exhausted downturns we have seen with usdt.d. Also having multiple confluences showing exhaustion,looking for a couple percent break to the upside. Then a potential down turn to monthly demand.

USDT.D Time To say byeit was a hard week and the price of the market got crazy
but that's fine bcz all was shared over here
the handle and cup pattern has been drew long time ago , and now it's confirming
just a little bit and the order block gonna break.
Good luck happy trade

$USDT Dominance BreakdownCRYPTOCAP:USDT Dominance Breakdown
Breaking a bearish wedge-targeting 2.6%-2.8%!
Is an altcoin rally incoming?
Watch closely!

USDT.D UPDATE (12H)This analysis is an update of the analysis you see in the "Related publications" section
No need to open sell/short positions or close buy/long positions
Based on previous analyses, we anticipated that there wouldn't be a significant upward move for Tether dominance. We are not truly bullish on Tether dominance. If the price returns to the yellow circle, we can look to rebuy or add volume on altcoins and Bitcoin.
For risk management, please don't forget stop loss and capital management
Comment if you have any questions
Thank You

USDT.D New Update (8H)Read the text carefully
It seems that Tether dominance is completing a Diametric pattern instead of an Expanding Triangle. This is because if it were an Expanding Triangle, the movement following wave E should not have occurred with such speed and strength
Currently, we can expect an upward movement from the green zone
Let's see if wave G is normal or truncated. If it is normal, it can move upward to the yellow zone but
If wave G becomes truncated, it may not create a significant high
Overall, the structure of Tether dominance appears bearish in larger timeframes
For risk management, please don't forget stop loss and capital management
Comment if you have any questions
Thank You

USDT.D update (i made a mistake !)I MADE A MISTAKE ANALYSISNG #USDT.D !
it touched its big supply zone and made a spike down after that i though it made a triangle for another rise but it was for another down !
this new analysis tells us that the alt season is almost started and the liq can be outta BTC and USDT and go to alt coins !

BTC could dump again if USDT.D chart does same thing againThe last time I posted this was when USDT Dominance chart touched the green trendline on the chart and bounced off the red trendline on the RSI.
Will this happen again causing another flash dump or will the bullish scenario I posted in last analysis (see below chart link) come to fruition?
As you can see the blue trendline on chart at 91790usd is major support.
The RSI pink trendline on left chart shows it is at resistance right now.
What just happened was a failed attempt to close a possible head and shoulders pattern, trapping shorts under the support causing this short squeeze in play right now. The question is whether the pump will continue or will it go back down. The USDT.D chart will tell us.
Hit the like idea rocket button if you like the idea and analysis.

USDT.D update - Jan 15 2024Following previous analysis, we were able to accurately identify market's recent top and chose proper sell strategy afterwards.
The retest of the 4.35% - 4.70% has turned into a consolidation pattern with two possible scenarios ahead: yellow path as the main scenario and the white path as the alternative scenario.
In fact if the next possible rise in USDT dominance shows a weak momentum, the yellow path and an altseason/party is expected to occur.

USDT.D at Key Support: Altcoin Bull Rally Ahead?USDT.D has repeatedly bounced off the marked red support zone, a strong Fibonacci level at 0.5. This support has been tested multiple times, and based on my experience, I anticipate USDT.D may break below this zone. If it does, it could trigger a bullish rally in altcoins.
I believe this is the final shakeout phase, so stay strong and focus on accumulating fundamentally solid coins. Remember to maintain discipline and practice strong money management.
USDT.DIntroduction
The analysis of Tether Dominance (USDT Dominance) is one of the most essential tools for predicting overall trends in the cryptocurrency market. This metric plays a crucial role in understanding investor behavior, particularly during periods when the market leans towards liquidity or transitions into a bullish phase. This report delves into the technical aspects of Tether Dominance, offering a detailed review of its current state and outlining potential future scenarios. It serves as a valuable resource for millions of investors seeking informed decision-making.
USDT Dominance Analysis
Definition and Importance of USDT Dominance
USDT Dominance reflects the percentage of the stablecoin USDT's market share relative to the total cryptocurrency market.
🔹 Increase in Dominance: Indicates investor preference for holding cash, often signaling market downturns.
🔹 Decrease in Dominance: Suggests capital is flowing into cryptocurrencies, signaling potential price growth.
Technical Overview
1. Breakout of the Ascending Channel
✅ Current Status:
USDT Dominance has broken below its ascending channel and entered a consolidation range.
✅ Range Box Details:
Upper Limit: Green Zone (6.17 - 6.53)
Lower Limit: Red Zone (3.73 - 3.99)
2. Price Target Based on Broken Channel
🔸 Bearish Target Estimate:
The projection based on the broken ascending channel suggests that USDT Dominance might drop to the gray support zone (2.99 - 3.16).
Possible Scenarios
Bearish Scenario
📉 Condition: Breaking below the red support zone (3.73 - 3.99).
📉 Target: A decline towards the gray support zone (2.99 - 3.16).
📉 Market Impact: Bitcoin and altcoin prices may rise as capital exits USDT and flows into digital assets.
Bullish Scenario
📈 Condition: Holding the red support zone and moving back toward the green resistance zone (6.17 - 6.53).
📈 Market Impact: Crypto prices may decline as demand for USDT increases.
Daily Timeframe Triangle Pattern
🔺 Observation: A triangle pattern has formed on the daily timeframe.
🔺 Prediction: A downward breakout is more likely, aligning with the bearish scenario.
Conclusion and Key Takeaways
1️⃣ Overall Trend: The trend remains bearish unless key resistance levels are broken.
2️⃣ Critical Levels:
Red Support Zone: 3.73 - 3.99
Gray Support Zone: 2.99 - 3.16
3️⃣ Trading Decisions: Focus on higher timeframes and confirmation of breakouts before making decisions.
4️⃣ Market Impact: The breakout or defense of critical USDT Dominance levels will have a significant influence on Bitcoin and altcoin movements.
🎯 Recommendation: Considering the bearish trend, approach bullish scenarios cautiously and prioritize confirmation of breakouts for accurate decision-making.

#USDT.D DOMINANCE ANALYContinuing the previous analysis of #USDT.D DOMINANCE
I sent you a chart again in a lower timeframe so that you can understand the trend well
It is currently moving towards a LEG D OF TRIANGLE .. The target for this move is 3.90%
The LEG D ends around 3.90% and completes the LEG E with a correction.

a wider view on USDT.DFrom a broader perspective, this growth is unlikely to signify an alt season. On the daily chart, a pullback to 4.5% is expected, which could indicate Bitcoin's return to 92K or even 89K. However, altcoins have shown that they are not far from their price floor and may follow a path somewhat independent of Bitcoin 📈

USDT.D is bearish as BTC is looking for 100kThe previous prediction turned out to be correct sooner than expected, and now Tether's dominance could see a drop of 4% initially and then 3.9%. This is assuming Bitcoin doesn't lose its current support at 96K. Considering that yesterday's daily candle closed above 96K, this expectation seems reasonable. Let's see what happens 📉
NOTE: my charts are reverse :)

USDT.D UpdateUSDT.D is making a correction after reaching the resistance zone and there is a bearish divergence in RSI and also is making a possible double top pattern. I expect it to make a correction. If such scenario happens we can expect a pump in the market overall and with BTC.D showing weakness as well i expect alt coins to pump harder compared to BTC.
DYOR
Goodluck

analysis of USDT.D dominanceUSDT.D dominance 4H TIME
This is an analysis of USDT.D dominance... Please share it with your friends if you like it.
IF YOU LIKE IT SO PLEASE SHARE IT TO YOUR FRIENDS
PLEASE LEAVE A COMMENT UNDER THIS ANALYSIS
THANK YOU

USDT.DOMINANCE CHART UPDATE !!This chart provides USDT dominance, highlighting key patterns and potential market implications:
Head & Shoulders Pattern:
The chart shows a completed Head & Shoulders pattern, indicating potential bearish momentum for USDT dominance. This often signals a rotation of capital away from stablecoins and into riskier crypto assets.
USDT dominance has broken the neckline support of the Head & Shoulders pattern and is moving toward the green horizontal demand area. This area represents a crucial support area near 2.0%-2.5%.
Resistance: The neckline and the descending trendline around 4.25% now act as resistance.
Support: The green demand area near 2.0%- 2.5% is crucial. A sustained move into this area could coincide with a strong crypto market rally.
A continued decline in USDT dominance indicates growing confidence in the crypto market, with investors pouring funds into altcoins and Bitcoin.
Conversely, any improvement in USDT dominance could indicate an increase in risk aversion.
Let me know if you’d like further assistance or adjustments!
DYOR. NFA

USDT DOMINANCE new update (4H)This analysis is an update of the analysis you see in the "Related publications" section
First of all you should know that "USDT Dominance" is always moving inverse of BTCUSDT .
We have reached the red-marked area from the previous analysis, but the bullish momentum of the candles is strong.
In previous analyses, we considered the triangle as a contracting triangle, but it is possible that Tether dominance is forming an expanding triangle or even a diametric pattern.
We have two zones for the completion of wave e.
If the price breaks through supply zone 1, it will be rejected from supply zone 2.
For risk management, please don't forget stop loss and capital management
Comment if you have any questions
Thank You
