AvroAvro Ta. 2025. for andrew only.It’s useful to look at stock market levels compared to where they’ve been over the past few months. When the S&P 500 is above its moving or rolling average of the prior 125 trading days, that’s a sign of positive momentum. But if the index is below this average, it shows investors are getting skittish. The Fear & Greed Index uses slowing momentum as a signal for Fear and a growing momentum for Greed.
USDT.D trade ideas

USDT.D Update: Range Reversal in Play?Initially in my last update, I was expecting USDT.D to push into daily supply levels after taking the swing low from the prior daily higher low — pulling back into supply before continuing lower after the market structure break.
Instead, it pushed even deeper, taking out the range low swing at 4.56%, which allowed BTC to break higher and tag its ATH by taking major upside liquidity.
Since then, we’ve seen a cool-off from those levels. Supply has come in across majors (notably TOTAL), and I’ve been tracking the local range forming in USDT.D — forecasting a reversal back into supply. That reversal is now starting to show itself, with USDT.D rising as BTC and alts pull back.
I'm currently watching for a push into the 5.0% – 5.6% supply zone, which I believe could mark the next major pivot point for the market.
From there, I’ll be looking for weakness or signs of rejection in USDT.D — which would align with BTC and the broader market setting up for another leg higher.
Once this supply is hit and the move starts rolling over, I expect USDT.D to begin its final phase down toward 3.73% — a key HTF demand and bullish reversal level. That would mark a major shift, coinciding with what I believe will be the macro market top forming across risk assets.
This level will be one I’m watching closely for DCA entries and scaling back into exposure — the reversal in USDT dominance from that zone should align with the last stage of the current cycle before distribution takes over.
1D:
3D:
1W:
3M:

USDT Dominance on the Verge of Breakout — Major Market Warning?The USDT Dominance chart is flashing early warning signs — a breakout above 4.97% resistance could spell trouble for the broader crypto market.
Key Observations:
Strong uptrend from 4.51% base, respecting the rising trendline
Testing multi-week resistance at 4.97%
RSI (1H): 74.3 — entering overbought zone
Higher highs with accelerating momentum
If USDT.D breaks and sustains above 4.97%, it suggests:
Risk-off sentiment increasing
Traders rotating from crypto into stablecoins
Potential dump across major altcoins & BTC
Conclusion:
Keep your guard up. A USDT.D breakout typically front-runs broader crypto weakness. We’re at a make-or-break level.
DYOR | Not Financial Advice

USDT Dominance SHOWDOWN INCOMINGAfter a full liquidity sweep at 4.50%, USDT.D is now pressing into the EMA cluster from below…
📊 What does that mean?
➡️ Stablecoin dominance is rising = risk-off behavior creeping in
➡️ But we’re STILL under trend — and that green dot sweep could mean a fakeout bottom
🧠 If USDT.D breaks above EMAs → altcoins bleed
🔥 If USDT.D gets rejected here → altcoins pump hard
This is the pivot. Watch closely.


$USDT Dominance 3.41% DropCRYPTOCAP:USDT Dominance broke below key support and is now retesting it as resistance.
Rejection from this zone confirms bearish structure, with a projected 3.41% drop, signaling potential capital rotation into altcoins.
DYRO, NFA

USDT RedistributionThe accumulation i was watching a while ago turned into redistribution after hitting it's target. This model does not look as clean as the redistribution model bofore, but it's still something to keep in mind. Invalidation is above the 2nd deviation in case there is something different going on.

USDT.D Consolidation Near Breakout Zone – Eyes on the Next MoveHello traders, here is the USDT.D update:
The chart is currently hovering near a major resistance zone, one that historically plays a key role in triggering altseason.
After a period of consolidation inside the mid-range S/R zone, price is now testing the downtrend line from above. A clear rejection here could spark renewed confidence in altcoins, giving them space to rally.
On the flip side, a breakout above this level may delay altseason momentum, as capital remains parked in stablecoins.
For now, this zone is the make-or-break area for altcoin sentiment. Keep it on your radar, the next move could set the tone for the coming weeks.

Tether Dominance matters!USDT #tether dominance is forming a bullish flag in lower time chart. If #usdtd manages to breakout, the next wave of correction will hit #bitcoin and #altcoins. If USDT.d loses %4.75 , that will be the invalidation.

USDT.D/OTHERS.D - Altcoin Season IndicatorPrice rejected from the 3M HTF supply and major BSL on the prior highs. Price has now gave a confirmed 1W bearish market shift, indicating a market wide altcoin reversal is playing out and the next bullish impulse higher isnt far off....
Watching for rejections in this weekly supply on this pair as marked and looking for a bearish daily market shift to give confirmations of a potential reversal bearish in line with the recent weekly bearish market shift that occurred from the BSL sweep into 3M supply and refined supply within it.
As shown, this chart is an altcoin indicator and im expecting that last altcoin season and cycle to occur after this chart tops out into supply and then continues lower into the SSL low at 0.29% and into the 3 month demand below it.
Seeing similar indications from the other charts shared like BTC.D and BTC.D+ETH.D+USDT.D+USDC.D, where they show continued weakness in alts for now with a HYTF bullish reversal in altcoins not far off.
3D:
1W:


USDT.D Bearish Cross Signals Potential Boom looks like history might repeat—last time USDT.D retested the bull market support band with a bearish cross, it dumped hard, paving the way for a market boom. If that pattern holds, we could see cash shift from stablecoins to BTC/alts, sparking an altseason.

USDT DOMINANCE NEW UPDATE (4H)The price is now approaching an important support zone and hasn’t yet pulled back to the broken trendline.
It’s expected that the price will soon recover from the green box, move toward the red box as a symbolic move, and then get rejected downward again from the red box.
For risk management, please don't forget stop loss and capital management
Comment if you have any questions
Thank You


USDT.D UPDATEI don't like USDT dominance. There is a megaphone formation. Many indicators are warning of a market decline. Let's be careful.

USDT.D(based on NEowave)I think wave E of triangle touched the necessary high and crypto is ready for a big pump.
pay attention to the targets and stop loss!

USDT.D in the long runI'm back again after a long time.
I don't write too much; this is just my own idea in the long run. It can send BTC above 150k sooner or later.
The movement in USDT.D can be like this: 4.95 > 4 > 2.65 > 1.86 > 1.1

usdt.d head and shouldersif usdt.d pump and news bad btc soon dump to 70 k . 60 k
if usdt.d break trend long in weekly btc soon to the moon 😆 120 k to 150 k all time high

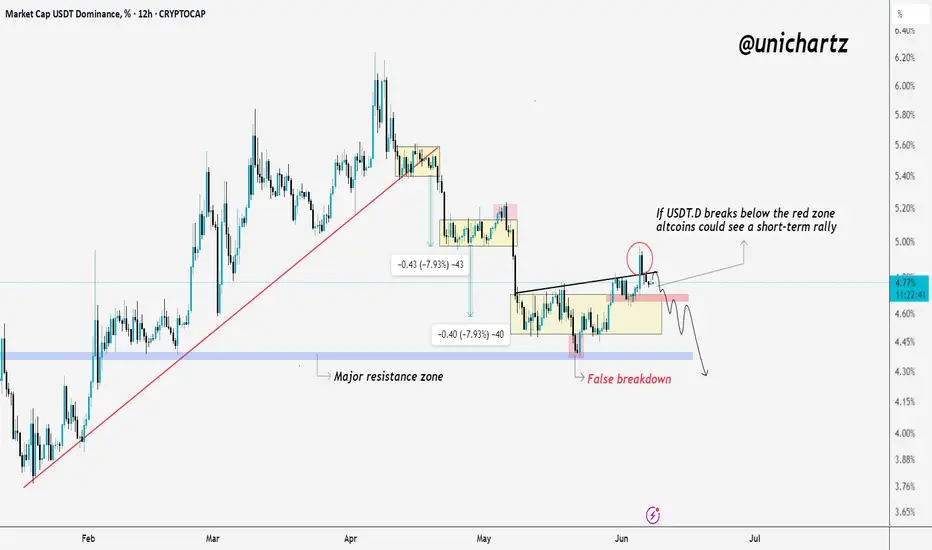
Eyes on USDT.D — Potential Altcoin Rotation SetupUSDT Dominance Update (USDT.D)
USDT.D is currently sitting just above the key red zone (support).
This level has acted as an important pivot for the last few weeks.
If we see a breakdown below this zone, it could trigger a short-term rally in altcoins — as capital rotates out of stablecoins into risk assets.
However, if USDT.D holds and bounces from this level again, it may put short-term pressure on alts.
Key Level to Watch:
The red zone — a clean break below it could open the door for a fresh altcoin run.
For now, patience is key. Let the chart confirm.
USDT DOMINANCE Update (4H)In our latest analysis, we pointed out the bullish movement in Tether dominance and warned to be cautious | and eventually, that move played out.
The bullish movement in Tether dominance started from the point where we placed the green arrow on the chart. It appears to be an ABC pattern, and we are currently in wave C.
Now, after the drop, the price is approaching a support zone that could potentially push it back to higher levels, so we need to stay alert.
The bullish wave C could complete in one of the marked zones.
Let’s see what happens.
For risk management, please don't forget stop loss and capital management
When we reach the first target, save some profit and then change the stop to entry
Comment if you have any questions
Thank You

USDT.D Breakout Fading — Relief Rally Ahead for Crypto?Yesterday’s spike in USDT.D during the volatility shook the market hard — but look closer 👀
This breakout above the range could be a seller’s trap. We saw a breakout attempt with strong wicks and rejection right after, hinting that buyers might regain control soon.
The false breakdown earlier and quick reclaim of the range further supports this bias.
If USDT.D starts falling again, it could fuel a recovery in risk assets (BTC + alts). For now — watching for confirmation, but cautioning against chasing fear here.
Stay sharp

USDT Dominance Update (4H)First of all, as you know, the market has been going through complex corrections lately, and the scenarios are not very clear. So make sure to trade with proper risk management and a defined stop-loss.
It seems this index is preparing for a drop. It has tapped into the origin order block, and from here, it has the potential to move downward.
The good thing about this setup is that the invalidation level is close. If a 4-hour candle closes above this level, the analysis will be invalidated.
For risk management, please don't forget stop loss and capital management
Comment if you have any questions
Thank You
