USDTDominance chart update !!USDT Dominance (USDT.D) chart continues to confirm the descending channel pattern, with dominance currently testing the upper trendline.
Dominance remains within the descending channel, with the upper boundary acting as a crucial resistance level near 4.30%-4.35%.
Recent price action shows rejection at this resistance, indicating a possible continuation of the downtrend.
The middle line of the channel may provide minor support around 4.10%.
Strong support lies near the lower boundary at 3.85%-3.90%.
Immediate resistance remains at 4.30%-4.35%.
A breakout above this level would signal a possible reversal in dominance, invalidating the bearish channel.
The current rejection is in line with the bearish outlook.
Momentum suggests that dominance could test the lower trendline again, especially if crypto markets maintain bullish momentum.
The short-term target is the lower limit near 3.85%.
Bullish invalidation occurs above 4.35%.
Monitor further rejection at the upper limit for short entries.
Confirm the breakdown with rising volume.
Disclaimer: This analysis is for informational purposes and is not financial advice. Always stay updated with market movements and adjust your trading strategies as needed.
You can DM us for information on any other coin.
@Peter_CSAdmin
USDT.D trade ideas

USDT DOMINANCE UPDATE (1D)🔷 First of all you should know that "USDT Dominance" is always moving inverse of BTCUSDT .
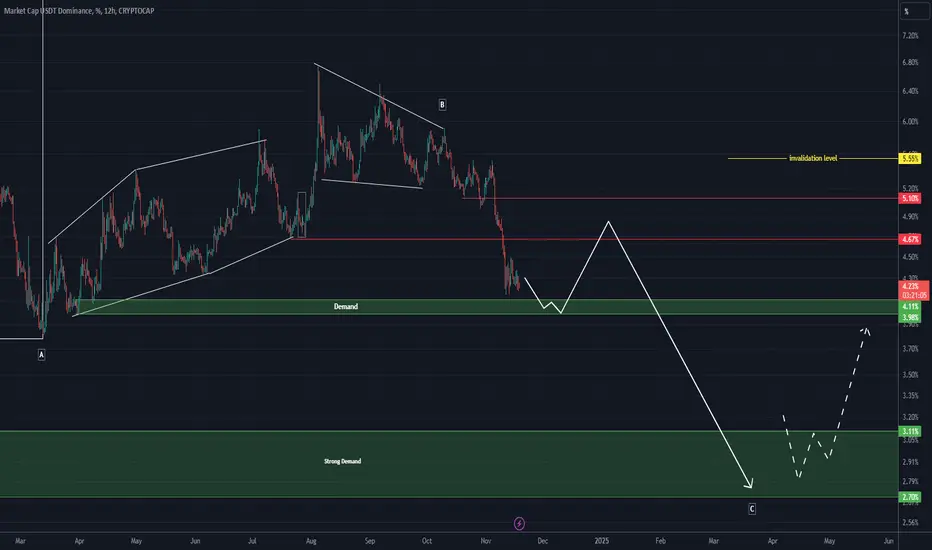
It seems that Tether Dominance has entered a large C wave.
The Tether dominance is near a support level, which could lead to a correction in its downtrend.
Such a move can be anticipated for Tether dominance.
Let’s wait and see what happens.
For risk management, please don't forget stop loss and capital management
Comment if you have any questions
Thank You
USDT.D Scenario 8HI think USDT dominance has set itself up for a continued upward trend after breaking through the important level of 4.22% and stabilizing above that. This could push it to even higher numbers, which might lead to a market correction...

usdt.d toch again the weakly trendline usdt.d toch again the weakly trendline that is in shape to tell breaked .also we may wait and see


USD.D Forcasting (Update)Always and at all times. All events will occur in the chart.
Trend Prediction - USD.D Forecasting - Resistance and Support Lines
**** Yousef Sharafi ****
Follow me here for more analysis

what is your comment about USDT.D??if trend RSI in 30 min be true i think this path for move ...
USDT.D monthly candle is breaking the trend line in 5 days ahead if
candle close down of trend market get high but i dont sure for this such easy
news can change anything ...
please search yourself this is not a signal for buy or sell orders

The future of chart USDT.D before the crypto growth seasonConsidering the positive divergence, the break of the downward trend line, and the static zones, I expect a rise to the 4.40% area.

USDT.D Update - Nov 24 2024USDT dominance is preparing to do a retest of the 4.35% - 4.70% zone so the market will have some correction. The next drop in USDT.D is probably going to be an extended wave meaning that the pumps in altcoins are probably going to be stronger so it is suggested to have some liquidity/cash in order to buy that dip.

Major drop about to begin for USDT DominanceUSDT.D is forming a prominent bearish pattern, the Inverted Cup and Handle, which has been confirmed and is now awaiting a decisive price movement through the neckline of the cup.
Current expectations suggest an initial rejection upon the first test of the neckline, followed by a retracement to the highlighted area on the chart before a major breakout occurs.
This bearish continuation scenario further reinforces the ongoing bullish momentum in the broader market.

USDT.D/USDT Market Cap Analysis 📉 USDT.D/USDT Market Cap Analysis 📊
This chart highlights 5 key steps in crypto market sentiment shifts over time:
1️⃣ New Year 2018: The first major bottom occurred at the peak of the 2017 bull run. As the bear market started, USDT demand surged as investors fled to safety.
2️⃣ Start of 2021: Another significant drop in USDT dominance aligned with the explosive 2021 bull run, as liquidity flowed into riskier crypto assets.
3️⃣ 2023 Peak: A sharp increase in USDT dominance signaled heightened fear in the market during a period of uncertainty.
4️⃣ March 2024: The chart reached the 0.382 Fib retracement level, coinciding with a major BTC top. This marked the start of an 8-month consolidation period.
5️⃣ Now: The chart has broken down below the 0.382 Fib level and is heading toward the 0.5 Fib level, projecting a 227% decrease. This suggests a massive shift, potentially signaling a liquidity move from stablecoins into riskier assets.
🚨 Key takeaway: History shows such drops can precede major crypto market moves. Is this a sign of a coming altcoin rally or something more?

Usdt.d Usdt suggests a possible retrace here at support . RSI divergence. It’s better to keep some cash on the sidelines for now I think sentiment is starting to weaken so people will begin to take profits or have already

USDT.D updatein 4h time frame usdt.d reach to its resistance an reacted by this down candle ...
my idea is that usdt.d can get down to green box in lower level so
for tomorrow market maybe green but the risk of FOMO will be increase so
be aware and search for news that can impact market and for position that is in profit save profit can be safe

that was fomo time or what?usdt.d market cap shows a growth
but it seems no touch on key support
its your choice guys just be aware of fomo

USDT.D Chart (Inverted) - A breakout posibilityThis inverted USDT dominance chart mirrors Bitcoin's price action. Recently, USDT dominance has broken out, but it's currently battling with the 200-day moving average (blue line). My projection is that after November 5, we'll see a breakout, potentially pushing USDT dominance down to around 3.3% in Q1 2025.
Given USDT's $120B market cap, a drop from 5.2% to 3.3% could lead to an inflow of $43.85 billion into BTC and altcoins.

USDT.D Flashing BEARISH Signal For Bitcoin and Total Market CapIn this video, I've re-created a study I saw online about USDT.D (USDT Tether Dominance) and how whenever it's dropped to this trendline since 2018/2019.
It's also marked the top of the market in terms of Bitcoin and Total Market Cap.
It obviously makes sense that with money flowing into crypto and Bitcoin, that money would flow out of Tether and stablecoins... But still, this is a very interesting inverse relationship.
This is either one of those charts we'll look back at in hindsight, and think 'Well that was obvious' -- Or we'll see a break of this trendline, because...
Maybe this cycle IS different.
I'll be watching this to see if USDT.D starts rising, and BTC.D starts dropping.
This could spark a mini-alt season in the mean time, which would be great.
But I would be taking profits into resistance levels, if this USDT.D chart looks to be turning up.
What are your thoughts?
Please Like, Leave a Comment, and feel free to Share!
- Brett

Alt run incoming?USDT.D is breaking the trend here. If it closes below the weekly and monthly levels, there is a strong chance that the altcoin season could start from this point.

USDT Dominance: an indicator to forecast Bitcoin’s directionUSD Tether, or USDT, came into existence as a digital version of the U.S. dollar, and it succeeded. USDT is pegged to the U.S. dollar and is the top and most used stable coin in the crypto market. USDT is also being used for transferring money or other means of payment, although mostly in the crypto market. Many others tried to capture a piece of this huge market: USDC, BUSD, DAI, TUSD, and UST. We all know what happened to the last one, UST (Terra USD) depegged from the U.S. dollar and crashed.
Anyway, since USDT is the most used stable coin in the crypto market, its dominance can reveal important info about the crypto market, and mostly about the Bitcoin.
So, let's start with the plain USDT Dominance chart; it shows the percentage of the total crypto markets in the form of USD Tether. As can be seen, the USDT Dominance chart shows two ascending channels. The first is steeper than the second, and the reason for that is Tether's totalitarian nature, as back then there were no other worthy competitors, and most notably its quick acceptance by the crypto community—the traders.
Now, the second ascending channel is closer to the norm and, as such, can be used as a revealing indicator. It's easy, 1) when USDT Dominance goes down, that means most people are buying Tether, so there is a shortage of Tether in the market. 2) When USDT Dominance goes up, that means most people are selling Tether, so there is a surplus of Tether in the market. So what do these mean?
When people are buying more Tether than before, USDT Dominance decreases, and that means they are converting their fiat money, such as U.S. dollars, Euro, British Pound, Franc, etc., to Tether in order to buy crypto assets such as Bitcoin. Now, here is the important part: If more people are converting their fiat money into Tether to buy crypto coins, the demand for crypto assets will go up, and when demand goes up, so does the price.
When people are selling their crypto assets more than before, they are converting their crypto assets, such as Bitcoin, into Tether, so there is a surplus of Tether in the market, and as a result, the USDT Dominance increases. This happens when traders/people want to save profits or think the market could go into a downtrend/correction, so they sell their crypto assets and prefer to hold a stable coin like Tether.
Here, the USDT Dominance chart is compared with the Bitcoin price chart. As can be seen, when USDT Dominance went down, the Bitcoin price went up, and vice versa. So, when the Bitcoin price was decreasing, more people were selling Bitcoin and converting their crypto assets into Tether; thus, more Tether became available in the market, and as a result, the USDT Dominance went up.
The USDT Dominance chart can be used as a simple indicator to forecast Bitcoin's possible future movements.

USDT.D trend
1. Key Support Zone:
- The 3.80% level acts as a strong long-term support, and a reaction from this area is expected.
2. Bullish Scenario:
- Breaking through 5.57%and then 6.61% could lead the dominance toward 8.29%and even 9.49%
- This scenario suggests increasing USDT dominance and selling pressure in the crypto market.
3. Bearish Scenario:
- If the 3.80% support is broken, dominance may experience a deeper decline, favoring a bullish environment for the crypto market.
4. RSI Status:
- The RSI shows bearish divergence and is near the oversold zone, indicating a possible short-term rebound or correction.
The current level is critical for determining the market direction; the breakout or hold of the 3.80% level will shape the future of USDT dominance and its impact on the crypto market.

Descending TriangleVery clear descending triangle forming in the 1 Hour timeframe. Break below the bottom line will confirm the continuation of the downtrend.

USDT.Dprevious idea about usdt.d failed by btc ath 97900
so the key support level is on 3.86%
double tap on support green box

USDT Dominance Analysis. USDT dominance consolidates below the 50 SMA (red line) and the descending resistance trendline. This structure highlights the continued bearish outlook while emphasizing key technical levels.
The 50-period Simple Moving Average is rejecting the price, further validating the downtrend.
This rejection aligns with the descending resistance trendline.
The horizontal support area near 4.19% remains crucial. A breakdown below this level will likely lead to a sharp decline, indicating a shift in market liquidity.
Dominance continues to form lower highs, indicating bearish momentum and less buying pressure.
The green arrow indicates a potential move to the downside. It could confirm further bearish pressure if dominance fails to sustain above the trendline and breaks below 4.19%.
A breakdown below 4.19% would trigger bearish momentum, potentially reflecting growing confidence in risk assets like BTC and altcoins. However, any break above the 50 SMA and the descending trendline would invalidate the bearish bias and could signal a reversal. Keep a close eye on these levels for the next move.
Disclaimer: This analysis is for informational purposes and is not financial advice. Always stay updated with market movements and adjust your trading strategies as needed.
You can DM us for information on any other coin.
@Peter_CSAdmin

USDT.D Alert updatUSDT.d shows reactions on support .
if 4.34% breaked and fix top of it next target will be on 4.47% and market will be chance to buy deep and deeper
