USDT.D trade ideas

$USDT.D is going to hit the 4.9% level right at the 200 EMACRYPTOCAP:USDT.D is going to hit the 4.9% level right at the 200 EMA — expecting a rejection here.
📉 Targeting pullback to 4.5–4.3%, even 4.0%.
This move = bullish for crypto. Just a corrective wave, not full risk-off.
Watch for rejection confirmation — next rally could be loading.

Tether dominance on the monthly time frameWhat really bothers me about this chart is that I think that as wave 4 ends, wave 5 will begin and the cryptocurrency market will see a deeper and deeper drop.

Correlation between USDT.D and BTC.D
Hello, traders.
If you "Follow", you can always get new information quickly.
Have a nice day today.
-------------------------------------
(USDT.D 1M chart)
If USDT dominance is maintained below 4.97 or continues to decline, the coin market is likely to be on the rise.
The maximum decline is expected to be around 2.84-3.42.
-
(BTC.D 1M chart)
However, in order for the altcoin bull market to begin, BTC dominance is expected to fall below 55.01 and remain there or show a downward trend.
Therefore, we need to see if it falls below the 55.01-62.47 range.
The maximum rise range is expected to be around 73.63-77.07.
-
In summary of the above, since funds are currently concentrated in BTC, it is likely that BTC will show an upward trend, and altcoins are likely to show a sideways or downward trend as they fail to follow the rise of BTC.
The major bear market in the coin market is expected to begin in 2026.
For the basis, please refer to the explanation of the big picture below.
-
Thank you for reading to the end.
I hope you have a successful transaction.
--------------------------------------------------
- This is an explanation of the big picture.
(3-year bull market, 1-year bear market pattern)
I will explain more details when the bear market starts.
------------------------------------------------------

USDT Dominance $USDT.D – Channel Breakout in Action!!USDT.D has officially broken out of the descending channel, indicating a potential shift in momentum.
Key Points:
- LTF bullish divergence supported the recent push.
- Price is now testing the breakout level with potential to move higher.
- Next key resistance levels are marked at 4.85%, 5.23%
Both levels align with Fibonacci retracement zones, adding to their importance.
If this move sustains, we might see temporary pressure on alts due to increased USDT strength.
However, if price fails to hold above the channel and confirms a deviation, alts may resume dominance.
Weekly close remains key — it will either validate this breakout or trap the breakout traders.

Important Update on USDT Dominance!This might get a little tricky, guys!
On the weekly timeframe, USDT.D has broken below the 100 MA. The last time this happened, it dropped by 33%, which was enough to trigger a solid rally in BTC and the broader market.
Currently, we may see dominance attempt to retest the 100 MA, which is now acting as resistance after the breakdown. This slight rebound could bring some correction to the market — so brace yourselves and stay cautious. ⚠️
In the long run, BTC still looks strong and is likely to go parabolic. Remember, consolidation is a natural part of the market cycle — and if you know how to navigate it, you’ll be just fine. 💪
Regards,
Dexter

$USDT.D Rejeccted Again Altseason SignalCRYPTOCAP:USDT.D Rejected Again Altseason Signal
USDT Dominance is showing a clear rejection from the descending trendline and 200 MA, similar to the previous 16% drop.
The RSI is turning down from the overbought zone, signalling potential downside.
If this move plays out, we could see USDT.D fall toward the 4.0% zone, which is bullish for Altcoins.
DYRO, NFA

USDT.D Forecast: Time to Buy the Dip?#USDT DOMINANCE
This is what I’d like to see happen in the next 2 days.
And I believe it will. Invalidation would be a close above 4.80%.
I’m buying the dip, guys. Let’s see how this plays out.

crypto steal alive?hello traders.
i see the butterfly pattern in usdt and 5wave eliot that we have very good prz in this area.
i hope that we can see down trend in usdt in long tf.
every target can be the last one.

BTC/ USDT DOM.. more downside? This is USDT on the weekly.. as you can see last June and July even before this is a big level of support for USDT DOM.. Wont be surprised for some more down side here for the crypto market. I know its easy to say now after it lost 111k but I just got home and wanted to look deeper into it. Play it level by level obviously.. fib by fib but don't be surprised to see some down side.. Also you're only down if you bough in the last 2 days and that being said don't buy something that ran up to ATH and think its time to buy.. you kinda deserve it.. but lets see what happens. I hope I'm wrong

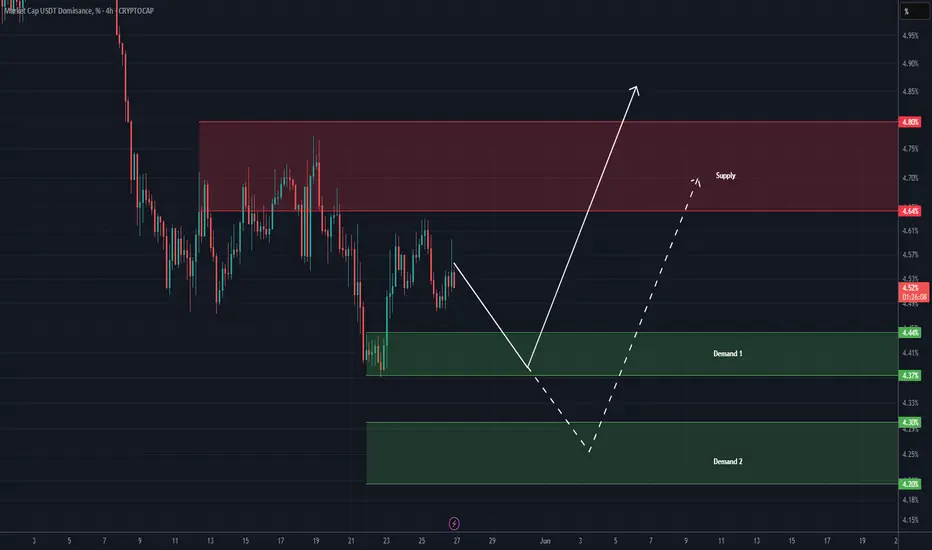
USDT DOMINANCE NEW UPDATE (4H)This analysis is an update of the analysis you see in the "Related publications" section
In the previous analysis, we mentioned that the price bounced upward from either Demand 1 or Demand 2.
Considering that the trigger line was broken with a valid candle, it seems the orders in Demand 1 were sufficient to push the price upward.
As long as the new demand zone holds, we expect the price to move toward the orange box.
The orange box appears to be a strong resistance zone, and we will definitely see a reaction there.
Let’s wait and see what happens.
For risk management, please don't forget stop loss and capital management
Comment if you have any questions
Thank You

USDT dominance chart!The chart shows USDT.D (Tether dominance) moving within a descending channel.
Currently, USDT.D is testing the upper resistance of the channel, around 4.65%.
If the dominance gets rejected at this level, the next potential target is the lower channel support around 3.9-4.0%.
This could indicate a risk-off environment where traders move capital from stablecoins (USDT) to more volatile assets like Bitcoin or altcoins.
The 50 and 200 moving averages provide dynamic resistance levels that support this potential downside move.
Thanks for your support!
DYOR. NFA

#MARKET DUMPED! What's Next?Honestly, I didn’t expect this move to play out the way it did.
I’ve been warning about a potential breakout on the lower timeframes, and in hindsight, the signs were all there, but I still missed it. It happens, even to the best of us.
Took a few hits with stop-losses today. But no complaints, it’s a small dent compared to what we’ve gained over the past few weeks.
Now, shifting focus. I’m watching this chart closely — this is the 130 EMA on the 4H, which has historically done a great job identifying short-term rejections and bounces. It’s already plotted, and I’ll continue tracking it.
If we break above this level, there’s a strong chance
CRYPTOCAP:BTC can revisit the 98k zone. Until then, stay cautious and avoid High leverage.
Holding LSE:TAO $EIGEN and a few more.
No need to force trades, let the setup come to you.
One more thing, I am still not Bearish, it's a shakeout right before the real move! So be alert when opportunities come to you.
I was planning to take a break today, but not like this tbh.
Stay tuned
We adapt and move forward. Always!
Cheers
Do show your support and hit that like button.
Thank you
#PEACE

USDT.D Bounce Back After Fakeout – What It Means for Alts?USDT Dominance – 12H Chart Analysis
After a clean downtrend and multiple breakdowns, USDT.D recently attempted to break below a major support zone — but it turned out to be a false breakdown.
This move likely trapped altcoin buyers, who expected USDT.D to keep falling (which usually signals strength in altcoins). Instead, dominance quickly bounced back, showing money flowing back into stablecoins.
If USDT.D continues to rise from here, we could see pressure on altcoins in the short term.
Watch this level closely — the next move will be critical.

Destiny 1H USDT.DIn the chart you are observing, the price action has reached the upper boundary of the 4-hour channel—though this screenshot displays the 1-hour timeframe. Additionally, two key resistance zones (base areas) on both the 1-hour and 4-hour timeframes lie ahead in the price trajectory. Consequently, there is a high probability of a downward reversal, which could ultimately lead to a bullish breakout in the crypto market.

USDT AccumulationI am watching this model for a while now. This could play out as a model 1 or 2 in the near future and would support my outlook on BTC.

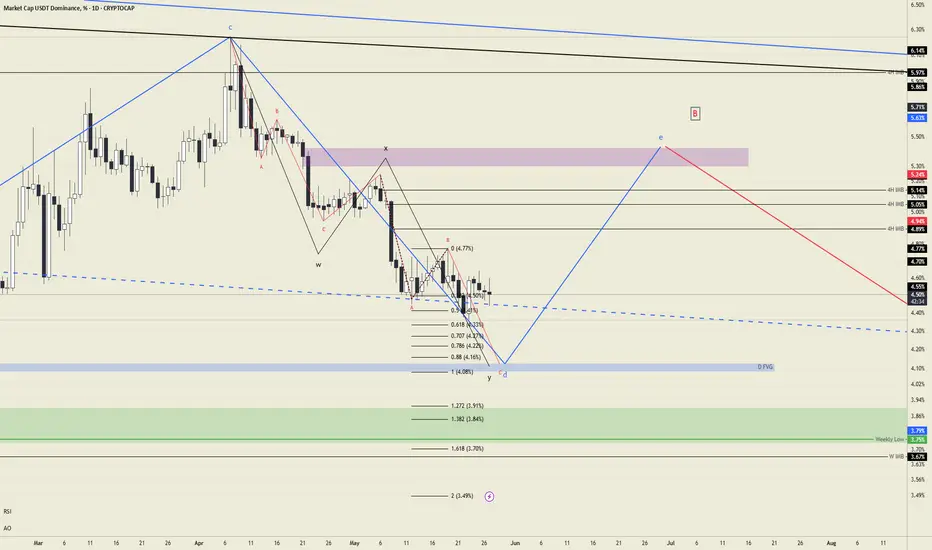
Usdt.d updateI think the d leg of the triangle is about to be completed, I still maintain my thought that the e leg will bring a fall to the coins, I will continue this count.
ETH and USDT.DLets see what will happen but if we trigger to bull run for altcoin this things has to be.

Usdt.d daily Usdt.d has shown some bullish divergence in daily timeframe signalling
Dump across crypto sector

$USDT: A Critical Close Is Approaching. BULL TRAP or ALTSEASON?This one’s more important than most people realise.
Alts will either explode from here, or this recent ATH turns out to be a bull trap, the last rally we've been waiting for may take a little more likely.
I personally think this is an unlikely scenario but if you really intend to make big bucks in this market, you gotta be ready for every outcome.
No bs. No noise. Just the facts.
I'll recommend that you bookmark this post to stay updated.
Do hit the like button if you like this post.
Thank you
Stay safe folks
#PEACE

USDT DOMINANCE Update (4H) First of all you should know that "USDT Dominance" is always moving inverse of BTCUSDT .
This index is ready to retrace and bounce upward from either Demand 1 or Demand 2. Be cautious with this index and monitor it closely.
If the price gets rejected toward Demand 2, altcoins may experience some growth before undergoing another correction.
Let’s wait and see what happens.
For risk management, please don't forget stop loss and capital management
Comment if you have any questions
Thank You
USDT Dominance Tells Us That Shakeout AheadHello, Skyrexians!
Despite most of traders now already do not believe in correction for Bitcoin, CRYPTOCAP:USDT.D is showing the potential warning sign. For sure my global forecast for this chart that Tether dominance will go below 2% is still actual. You can find it here . By the way it's playing out great. But in the short term shakeout is likely.
12 hours time frame Awesome Oscillator shows that wave 1 of global C has been finished. Now it's time for reactive wave 2. The most likely target is 5.3% at 0.5 Fibonacci. Only from there I expect crypto bull run continuation (for BTC) and start (for altcoins).
Best regards,
Ivan Skyrexio
___________________________________________________________
Please, boost this article and subscribe our page if you like analysis!

USDT Dominance Looks BullishHello all dear friends.👋
According to the chart that USDT Dominance shows, we have an upward trend up to 4.70%. Of course, we may have a slight downward trend before moving up. Based on this, there is also a downward trend ahead for Bitcoin .
❗Please be careful that this is an analysis and opinion.
