Dominance TetherDominance Tether, according to the analysis as shown in the image, will have a decline after pullback up to the ceiling from where it is reversed
USDT.D trade ideas

Will USDT Dominance Surge or Sink in September?I anticipate that USDT dominance will stay relatively strong, with price action likely remaining in the upper part of the wedge for most of September, a month that could be quite volatile. I expect a breakout from the wedge in October, indicating a decrease in USDT dominance and a rally for strong crypto assets. Given the potential volatility in September, having additional capital to buy dips could prove advantageous.

USDT.D analysisIt is about reading the price pattern and the result of the indicators
I will only share with you what the result of the analysis shows. + other crypto coin analysis.
rsi has been in a green position for a long time, red is not far, considering the rhythm of rsi history (point b and the crypto market is green)
point c is bloodshed.
This could be wrong. MD

Tether.d AndBitcoin showing Fall Best Wey to trade .In the Previous analysis, we observed the confirmation of the descending channel, now we have to examine the ascending channel of Usdt.d, which is another confirmation of the fall of Bitcoin. Currently, the resistance of 6.1 has been broken. And the first resistance target is 7.8 and 8.1 so that Bitcoin can see the targets of 48000 and 42000. According to previous experience, we can buy altcoins in this range.

USDT.DUSDT.D rebounded and started to rise exactly where I expected, it was easy to guess because it always happened since 2017.
At the moment, it looks like a continuation of the correction in the crypto market.
Not financial advice, just for fun.

USDT Dominance: A Major Move is on the Horizon!Guys! Get Ready!!!
The USDT Dominance is indicating something important, and you all need to pay attention to this.
USDT.D has reached the resistance trendline and is likely to be rejected down to 5.20% — a 20% drop. This would be great for BTC and the altcoins.
The RSI is forming a bearish divergence, suggesting a rejection of the dominance is coming soon.
If this rejection happens, it will present some good opportunities for us to enter long positions.
Stay cautious and trade safely.
More updates coming soon.
If you find this post helpful, show your support with a like, share, and comment.
Regards,
Team Dexter.
#cryptocurrency #USDT

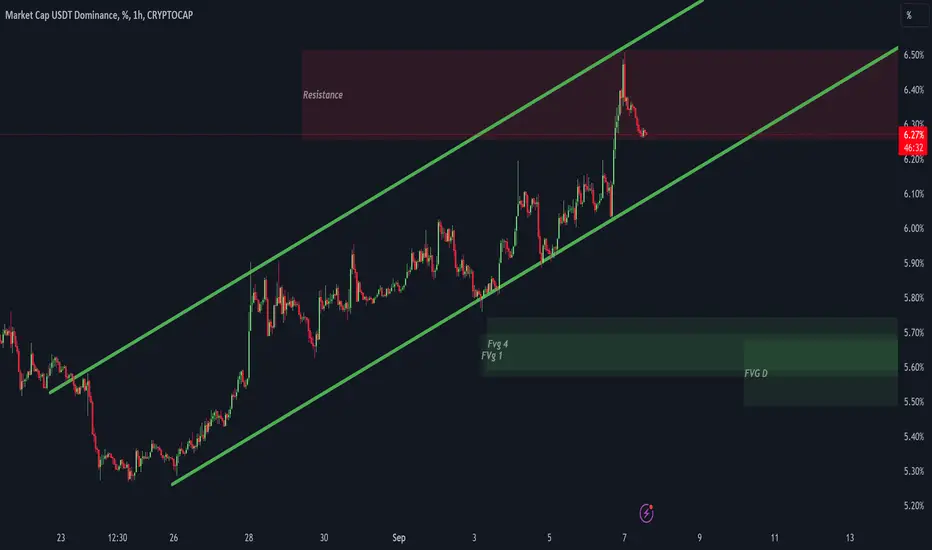
Dominance Tether WeekEnd Updatein dominance we face with a strong reistance zone that apears with RED AREA
Also we have some Fvgs in charts that not filled yet
we are in bullish movement and still long trend line is valuable
So if you want to Buy Crypto ? its time to risk or you can wait for more confirmations
like passing last higher low and breakout Trend line
@TradeWithMky
USDT dominance analysis, Upcoming rally in alts!!!Join our community and start your crypto journey today for:
In-depth market analysis
Accurate trade setups
Early access to trending altcoins
Life-changing profit potential
Hello everyone,
Let's analyze USDT Dominance (USDT.D) in daily timeframe!!
In my previous ETHUSDT post, I highlighted that ETH was approaching the 200MA, a key support zone, from which we could anticipate a bounce for both ETH and altcoins. Similarly, USDT.D has recently reached the upper boundary of the parallel channel it's been trading in. Historically, whenever USDT.D touches this upper boundary and the StochRSI forms a bearish crossover in the overbought region, it often signals a significant rally in the market.
At present, a similar pattern is unfolding, with USDT.D touching the channel's upper boundary and the StochRSI forming a bearish crossover in the overbought region. Additionally, both BTC and ETH are approaching critical support levels.
Based on these signals, entering altcoins may prove profitable as these indicators suggest a potential upcoming rally in the altcoin market. However, this analysis would be invalidated if USDT.D breaks above the channel.
Resistance zone:
- 6.56%
Support zones:
- 6.17%
- 5.90%
If you find this analysis helpful, please hit the like button to support my content! Share your thoughts in the comments and feel free to request any specific chart analysis you’d like to see.
Happy Trading!!

dominance of the TetherAccording to the analysis, according to the image, the dominance of the Tether will decrease from the desired point

Dominance is at Resistance!USDT Dominance Alert 🔥
USDT dominance is approaching a crucial resistance zone at 6.03-6.27%. A breakout above this range could push dominance to 7.6%, potentially driving BTC toward the $40K mark! 📉
However, if dominance faces rejection, it could dip to the 4.37% support level, which would be extremely bullish for Bitcoin.
Key levels to watch closely. Stay alert! ⚠️
Crypto #Bitcoin

USD.D Price Prediction-30 Minute Time Frame TradingAlways and at all times. All events will occur in the chart.
Trend Prediction - USD.D Forecasting - Resistance and Support Lines
Rising Wedge Pattern in Uptrend
**** Yousef Sharafi ****
Follow me here for more analysis

USDT Dominance: The Rejection Is Near!USDT dominance is approaching the resistance trendline. The current movement resembles a double-top pattern, and we might see a slight push before a potential rejection.
The RSI is losing momentum, indicating a significant bearish move for dominance. If USDT.D drops, it could be a positive sign for BTC and altcoins.
I’ll be analyzing altcoins accordingly, so if you have any preferences, feel free to let me know.
Trade safely.
Regards,
Team Dexter
#USDT #cryptomarket

USDT.D in Strong Uptrend - Bitcoin Recovery at Risk?Today, USDT.D (Tether Dominance) is exhibiting a clear continuation of its upward trend, characterized by a series of higher highs and higher lows. Currently, USDT.D is approaching the upper boundary of a key resistance channel. As long as this resistance is not tested or breached, there remains a potential for continued downward pressure on Bitcoin and altcoin prices.
Should USDT.D manage to break through or "sweep" this upper channel level, we could see further weakness in the cryptocurrency market, with the possibility of an extended decline in Bitcoin’s price. However, if USDT.D fails to break this level and instead retraces, this could signal a temporary trend reversal, providing room for a rebound in crypto prices.
In summary, the current momentum in USDT.D suggests caution. Market participants should closely monitor these critical levels to respond promptly to any potential trend shifts.

USD.D Forcasting (Update)Always and at all times. All events will occur in the chart.
Trend Prediction - USD.D Forecasting - Resistance and Support Lines
**** Yousef Sharafi ****
Follow me here for more analysis

#USDT : Your Key to a Beautiful Green Winter!Is this rational? Absolutely!
Is this possible? Without a doubt!
BTC Dominance may keep rising for the next few weeks followed by a very strong rejection.
You'll see double and even triple-digit gains in a single day in altcoins.
Don’t sell your BTC and altcoins for cheap just yet.
We may see a bit more of this boring price action and possibly one last shakeout, but things are about to change quickly.
Thank me later, but for now, bookmark this post.
Big moves are coming!
Based on these two charts, I'll share 10 ALTCOINS with Entry and Exit points for the bull run.
So make sure you like and RT if you want me to post them soon!
Do hit the like button if you like it and share your views in the comment section.
Thank you
#PEACE

Tether Dominance Analysis by the Technical Team at MallicastThe analysis team at Mallicast has outlined two potential scenarios for Tether's (USDT) dominance. Currently, Tether's dominance is hovering around 5.94%, a range characterized by substantial liquidity. Given these conditions, there is a potential for a price correction that could bring the dominance down to the 5.63% level. Such a correction might present a good buying opportunity for currency pairs.
On the other hand, there are signs of upward momentum. If this momentum continues, Tether's dominance could stabilize at higher levels. In such a scenario, investors should closely monitor the market and make decisions based on the prevailing trends.
Ultimately, the choice between a price correction scenario and a continued upward trend depends on a careful analysis of market data and attention to price movement signals. It is recommended that traders employ appropriate risk management strategies to take advantage of potential market changes.

Party is over for USDT.DThis is a huge , an ascending giant channel from early 2018 broke and retested . By the next year this time if they haven’t already done printing billions more of usdt ,the share of the market would be so small that nobody goes to take it seriously for market movements .
Have patience lads we gonna make it soon .

Usdt.D ; bullrun map .Second chart tonight , same as previous chart ( bitcoin ) here we have a channel that candles respect some levels . In time based cycles we are at the time for bullrun and we might start it at the very level 1 which is shown in light red circle, this one is more possible of course after some game playing, circle 2 could be definitely a bullrun point and life changing opportunity but less likely to happen. Tbh i give it a very tiny small chance and I'm gonna invest very heavily probably twice as this moment if we get there but as I said i think we wont and the top of the channel is to fool traders and make them short and to get liquidated eventually . Next chart for tonight would be the same usdt.d but logarithmic and a huge one .

Bitcoin and usdt.d percentage comparison + theoryWhy does my theory say usdt.d will NEVER go below 3.8%?
Major usdt.d falling below the previous major drop has never happened and is suspected even today.
Major rises in usdt.d have always(*when i mean *major*) started above the previous usdt.d major high.
Depending on the movement or the situation, the average calculation is that *if btc goes down, usdt.d goes up about twice as much*. On smaller usdt.d increases 1.5x and on larger ones 2x or even 3x more than bitcoin. It also depends on the speed(volume) at which the usdt market capital rises, everything is relative
if I think positively and see that the yellow box is about 150%+, then I divide it by three and get the btc drop percentage. it makes btc -50% from higher peak. it can also be less than -50%. THIS IS AN APPROXIMATE CALCULATION AND ONLY A GUESS. theory and assumption that btc's strong rise will start when usdt.d is at a new high.
I will analyze bitcoin this year *minimum* 45k. it may drop to 40k, but time will tell. in the area where btc is now i don't believe a 100k+ rise because usdt.d theory doesn't allow it. maybe next year? hmm.
The summary is that if usdt.d is in the yellow area, then btc rises.
My vision may be absolutely wrong or absolutely true. MD

USDT Dominance - An update around breakdownUSDT Dominance continues to look weak. Last update I gave was around the retest of the major trendline that started formed in late 2018 when BTC crashed to $3100. Back then USDT dominance started to pick up as alts got decimated even though BTC did find a bottom there. USDT Dominance bottomed around 0.85% at that time.
Now here we are where USDT Dominance is at 5.6% which is about 6x higher than the bottom, and BTC is 1920% higher. How can that be? Alts. Alts haven't even started to recover yet. This will change in the coming months. There's no knowing when it's going to start, but that retest I outlined should have been an indicator that USDT dominance is going to move down.
I'm watching other indications such as BTC.D to give an indcation when alt season is going to start. Full disclosure, I have invested the capital I want to put on the line into alts.
As I've stated many times previously, crypto trading is risky and only a small portion of your net worth should be invested in crypto if you're interested in this market. Watch out, though, because if this chart is right , we will see USDT.D go down to at least 2.00% and possibly even lower. Only time will tell.
USDT Dominance Bullishwe have seen bottom head and shoulder pattern in USDT.D chart so in coming weeks, slow growth is expected

USDT Dominance Bullishwe have seen bottom head and shoulder pattern in USDT.D chart so in coming weeks, slow growth is expected

USD.D Forcasting (Update)-Always and at all times. All events will occur in the chart.
Trend Prediction - USD.D Forecasting - Resistance and Support Lines
**** Yousef Sharafi ****
