USDT.D looks bullish!!As depicted on the chart i expect the USDT.D to rise to the depicted SR zones and levels.
The chart is relatively bullish considering the higher highs and higher lows and holding the trend line.this chart also corresponds to the BTC chart analyzed previously (in related links).I expect bleeding through out the Crypto and for BTC to reach at least to 50-52k zone.
Lets see how its gonna play out
Always a Student.
USDT.D trade ideas

#Usdt Dom 1D chart - What's next step for #Bitcoin?#Usdt Dom 1D chart;
Of course, it was no coincidence that the first scenario from the critical zone I mentioned earlier was realized
Because the continued uncertainties and bearish signals on the #Bitcoin side also helped determine the direction of this chart.
With the trend compression, we may see an upward movement. A rise up to around 6% would not be a surprise. Likewise, we can say that it also supports that the bearish levels we have determined on the Bitcoin side may be possible.

USDT.DAs the Market has shifted structure we will be heading all the way up
be careful with your BTC longs cheers!
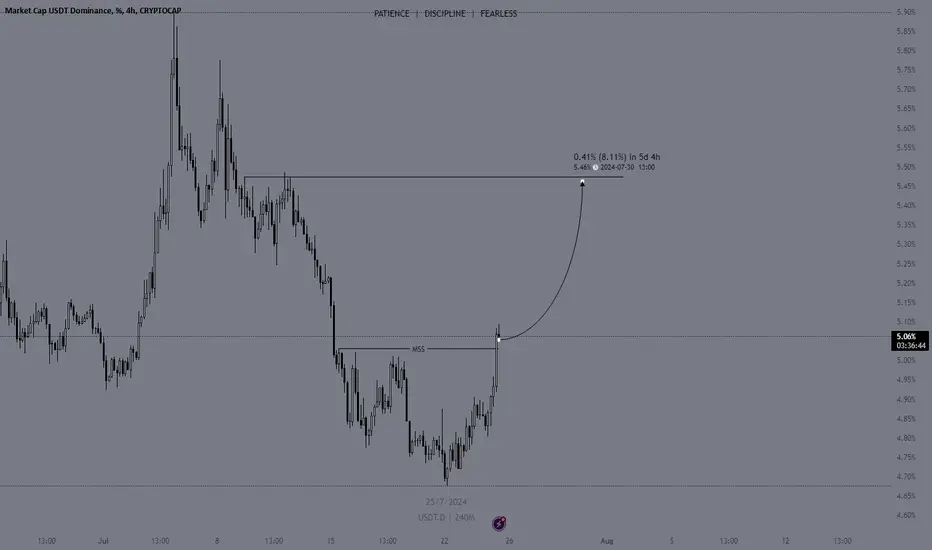
#USDT Dominance is approaching a critical resistance level. #USDT Dominance is approaching a critical resistance level.
**Scenario 1 - Rejection:** A rejection at this level could bring relief to BTC and altcoins.
**Scenario 2 - Breakout:** A break and close above 5.05% may push USDT Dominance to 5.27%+, potentially driving BTC towards the early 60ks and causing altcoins to drop by another 20%-30%.
Despite the downturn in my spot holdings, I remain steadfast. Instead of selling, I’m preparing to capitalize on the dips.
Stay strategic, stay patient.
Let me know what you think in the comment section.
Thank you
#PEACE

THIS IS NOT LOOKING GOOD!Watch out, guys!
The USDT dominance is bouncing back as expected. This rebound is not looking good for the market.
We can already see the impact on BTC and other altcoins. The 200 EMA in yellow is an initial resistance to the dominance, and it must hold to prevent a further rally.
The RSI indicates a bullish divergence, which is yet another confirmation of a higher rally.
Staying away from leverage trading will be a better option for now.
Trade safely.
Regards,
Team Dexter.

Tether Dominance effect on BTC priceTether Dominance effect on BTC price
these fib levels on tether dominance are an indicator for which way price will move in BTC
when tether dominance is going higher, btc price goes lower and vise versa
at each of these fib levels you can basically trade resistance & support
helps to signal market tops and bottoms, this combined with volume on BTC/USDT

USDT Dominance is going to plummet soon.Due to its overextended volume for a prolonged period, it dominance has been exhausted. Imo, it will head to 2.85% - 2.95% which will launch the alt season or launch BTC to 75-77k

USDT.D Update - July 21 2024#USDT dominance is near an important mid-term ascending trendline (yellow trendline) and divergence can be seen, it's quite possible that the white trendline will be broken soon and USDT.D will rise causing dump in the market.
So the trigger to exit Buy/Long positions and consider opening Short/Sell ones will be " 4H close above the white trendline".


USDT Dominance on the Risein shorter TF: Potential Impact on BTCUSDT dominance is currently trading around 4.80%, closing above the 50-day Moving Average (MA). A clear break and hold above the 50 MA could indicate a trend reversal towards increasing USDT dominance.
The next resistance level lies at 4.81%. A decisive break above this level could further strengthen the uptrend for USDT dominance.
Next Resistance level- 4.92%
BTCUSDT can show some correction to $60k-$62k support level. BTCUSDT is also forming a Bearish divergence.
If USDT dominance gets rejected from this level, then we will still be in the rally to our BTC $70k rally.
This potential trend reversal could impact your open positions. Consider placing or adjusting stop-loss orders to manage risk in case of a price drop.
If you're in profitable positions, you might consider taking some profits to secure gains.

This will make our jobs easier if #Stablecoin Dominancewas to reach the inverse head & shoulder target :)
Almost the same % when the #crypto market topped out last cycle.
Will it?
IDK!
Should u wait to those low single digit numbers before u emabrk on profit taking?
probably not.
We shall keep an eye on this of course.
Best of Luck

USDT dominance Analysis USDT dominance, follow red boxes and green boxes
Red box - indicates bearish liquidity zone
Green box - indicates bullish LIQUIDITY zones
Watching 4.64-4.68 levels , either do or die for usdt levels to bounce or break.
If the trendline broke down and fall below means bullish for crypto market
If there is any trendline bounce then we can see btc reversal 67.5k -69k levels.

usdt.dThe decline is coming for me USDT has completed five waves 12345 There will be a strong rise for me BTC

USDT.D DOMINANCE CHART: CRUCIAL TIME FOR A BREAKDOWN OR BOUNCEHello everyone,
Here is a quick update of USDT.D in shorter TF.
USDT.D seems to be trading inside this bearish triangle. A strong rejection from the upper resistance could be seen from the chart. Daily chart confirms the candle close below 200MA which has certainly triggered BTCUSDT to $65k.
Also, we have seen a pullback to $62k as a retest. Further retest could be if USDT.D tends to touch 200MA or a bounce from the support trend line. And if there is a further breakdown from this triangle, we could possibly witness a rally.
Happy Trading!!

USDT.DUSDT Dominance forming Rissing Wedge formation.
We have 2 possibilities to complete the formation and reach the target of this pattern.
Whether next move make a new high (which we do not expect it to !!) But our Target will be New Low.
🚨 Meaning: Our Target for CRYPTOCAP:BTC is new ATH !!
Let's see how it goes.

USDT.D Technical Analysis: Higher Timeframe OutlookHello Everyone,
Let's take a quick look at USDT.D on the higher TF.
From the chart, it's clear that USDT.D has been trading within this parallel channel for quite long time and has consistently respected the middle line since May 2018. Recently, it broke below this middle line, which led to a significant BTCUSDT rally from the FWB:42K level to an all-time high.
Now, we're seeing a retest of the breakdown area shown in the chart. It’s interesting to consider what might happen if USDT.D falls further after this retest. Currently, the breakdown from the 5.60 support level has turned into a strong resistance.
Here are the key levels to watch:
Resistance Level: 5.60
Support Level 1: 3.65
Support Level 2: 2.51
Happy trading!!

USDT.DDominance Tether check in 1 hour time frame:
The trend in this time frame is completely bearish
And this downward trend can continue until the daily trend
Before continuing the downward trend, we will first correct the downward trend of the previous day due to the order block in the price range of 4.75%-4.78%.
Due to the continuation of this trend, we can find the right price for the purchase transaction when the downward trend is corrected

USDT DOMINANCE: DO NOT SKIP THIS UPDATE!The USDT Dominance indicates something important; if you are a trader, you must look at this.
In this 12-hour chart, the USDT.D has been in a downtrend since early July. It has yet to test the support level ranging between 4.58% to 4.64%.
If the dominance reaches down to the support level, we are likely to see BTC hitting $70k and a decent rally in altcoins.
Here's the scary part: if the USDT.D rebounds from anywhere close to the support level, be prepared for a heavy crash.
I am hoping for a further breakdown rather than a rebound, but time will tell. For now, let's aim for a continuous downtrend toward 4.58%.
I hope this helps. Not financial advice.
Trade safely.
Team Dexter.
#USDT #BTC #Crypto


Bearish - Rising Wedge PatternUSDT Dominance : Bearish - Rising Wedge Pattern + Bearish Divergence = Sell ...
A Rising Wedge is a bearish chart pattern that’s found in a downward trend, and the lines slope up.

$BTC Price Predictions based on $USDT dominance Inverse Relationship: Historically, there tends to be an inverse relationship between CRYPTOCAP:USDT dominance and CRYPTOCAP:BTC prices. When CRYPTOCAP:USDT dominance increases, it often suggests that investors are moving funds into stablecoins, indicating a risk-off sentiment in the market. Conversely, when CRYPTOCAP:USDT dominance decreases, it suggests that investors are moving funds out of stablecoins and into assets like CRYPTOCAP:BTC , indicating a risk-on sentiment.
Market Sentiment Indicator: CRYPTOCAP:USDT dominance can act as a sentiment indicator. Higher CRYPTOCAP:USDT dominance can signal market fear or uncertainty, leading to potential declines in CRYPTOCAP:BTC prices. Lower CRYPTOCAP:USDT dominance can signal market confidence, leading to potential increases in CRYPTOCAP:BTC prices.
Liquidity Flows: Changes in CRYPTOCAP:USDT dominance reflect liquidity flows within the cryptocurrency market. A rising CRYPTOCAP:USDT dominance might indicate increased selling pressure on CRYPTOCAP:BTC , while a declining CRYPTOCAP:USDT dominance might indicate increased buying pressure on $BTC.
Technical Analysis: Analysts often use technical indicators and historical data to predict CRYPTOCAP:BTC price movements based on CRYPTOCAP:USDT dominance trends. Patterns, support/resistance levels, and moving averages are commonly used tools.
External Factors: Factors such as regulatory news, macroeconomic trends, and market events also play a crucial role. CRYPTOCAP:USDT dominance might be influenced by external factors that affect investor confidence and market stability, which in turn impacts CRYPTOCAP:BTC prices.
Short-Term vs Long-Term Predictions: Short-term predictions based on CRYPTOCAP:USDT dominance might focus on immediate market sentiment and liquidity flows, while long-term predictions might consider broader trends and potential shifts in investor behavior over time.

Usdt.dDominance Tether is placed on its support and there is a possibility of rising from it, can it lead Bitcoin down

Bullish BTC. 1/USDT.D Going to the top channel.You will see. Then it will break top line and to the moon.
