USDT.D 4H analysis - May 04 2024it's logical and wise to assume that USDT dominance might face some support in 4.8% area followed by a small rise which shall cause some small correction/dump in BTC and the market. of course the other scenario is that 4.8% area breaks and USDT.D drops to next level of support (4.6%).
USDT.D trade ideas

USDT.D 12H update - May 04 2024USDT dominance perfectly followed May 01 analysis and started to drop from 5.4% area which resulted in a good pump in BTC and the market.

ALERT :Tether Dominance Falls and Enters DowntrendTether Dominance Falls and Enters Downtrend: Potential Boost for Bitcoin and Other Cryptocurrencies
Key Points:
Tether dominance has fallen and re-entered a downtrend.
This could lead to an increase in the price of Bitcoin and other cryptocurrencies.
If you have any short or sell trades, it may be best to exit as soon as possible.
Tweet:
Tether dominance falls and enters downtrend, potentially boosting Bitcoin and other cryptocurrencies. Exit short or sell trades ASAP! #Bitcoin #Crypto #Tether
Explanation:
Tether dominance: This refers to the percentage of the total cryptocurrency market capitalization that is held by Tether (USDT). A decrease in Tether dominance suggests that investors are moving their money into other cryptocurrencies, which could put upward pressure on their prices.
Downtrend: A downtrend is a technical analysis pattern that indicates that the price of an asset is likely to continue falling.
Short or sell trades: Short sellers borrow an asset and sell it with the expectation that they can buy it back at a lower price in the future. Sell traders simply sell an asset that they already own.
Exit short or sell trades: This means closing out your short or sell positions to avoid potential losses.

USDT.DAt present, there appears to be one more critical resistance level standing in the way of a fall in USDT.D, which i believe once it broke the resistance we can see USDT.D at 2% mark.
Trade safely.

#USDT.DOMINANCE 1DAY UPDATE !!USDT DOMINANCE ANALYSIS
USDT.D is forming a rising wedge pattern, nearing the support trendline. MACD crossover suggests a potential bearish turn.
A sustained wedge breakdown confirms a bearish trend; a bounce suggests consolidation within the pattern. USDTD typically moves inversely to the crypto market.
I have tried to bring the best possible results in this chart.
If you like it, hit the like button and share your charts in the comments section.
Thank you.


USDT.D Analysis USDT.D has bounced of the trendline from 2018 and is looking bullish after a decending trend anbd bounced of the short term 5ma. In terms of the crypto market, this is a bearish sign as when usdt.d goes up everything else goes down. Look at historical times, like the 18' bearmarket. If we ever break down from this trendline the market will see a massive increase.
For now, be cautius with longs and bullish charts.

USDT.DGood Luck >>
• Warning •
Any deal I share does not mean that I am forcing you to enter into it, you enter in with your full risk, because I'll not gain any profits with you in the end.
The risk management of the position must comply with the stop loss.
(I am not sharing financial or investment advice, you should do your own research for your money.)

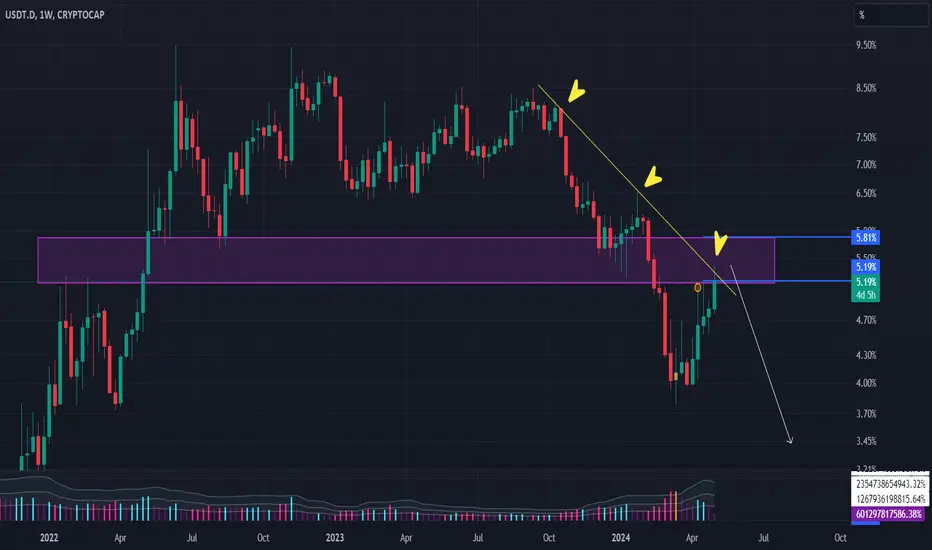
Stablecoin Dominance Tipping PointI see two possible scenarios playing out:
The Bullish Scenario
The dominance goes lower and respects the current downtrend. This could either bounce off roughly 6% (this area has seen some interesting patterns in the chart) or just continue collapsing down. This would be bullish depending on if we don't have much trouble clearing the 5.8-6% range.
The Bearish Scenario
We break the current downtrend by going up to 7.5% or above in the next 2-3 weeks, at which point I think that worst case we would test somewhere around 8.15%. This would be short to slightly medium-term bearish at the worst in my opinion.
I lean towards the bull case simply because markets are usually boring or choppy the month or so after the Bitcoin halving event; things usually ramp up after. We've dumped over 20% in BTC and altcoins got flushed aggressively while not establishing lower local lows at the same time as BTC did recently.
Despite being bullish, it's definitely at a tipping point where if it goes up by a bit more then it's a cause for concern. This is a good chart to watch closely for the next 1-3 weeks as evidence of more incoming corrections for a few more weeks or as evidence of the bullish trend resuming.

USD DominanceI have put together a chart on the dominance of the three largest USDT.D+USDC.D+DAI.D
Stables. This is the most interesting season that I have seen!!!
USD dominance has failed to unprecedented levels of 30% in the entire history!
It's usually 40-50%
So that you understand 70% of the cache in the market!!!
I assume it may decrease to 83%
But it doesn't seem to help me! Everyone has become some kind of brave!
Usually 60% rivers of blood and torn farts!
It seems to me that because of the large number of project drops, people have lost their vigilance!
There are a lot of free coins in the market!!!
I don't know how it will end!
Technically, we are in the second zone, there is a certain overflow movement!
Maybe a sidewall with an exit from the Cue Ball to the Alta (Altseason)!!!
Maybe the Third zone is 3.45-2.1 level 2.96
This is exactly the volume of the total since 2019, the level of 3.17

USD.D Forcasting (Update)Always and at all times. All events will occur in the chart.
Trend Prediction - USD.D Forecasting - Resistance and Support Lines
**** Yousef Sharafi ****

USDT dominance looks weakin a past few weeks usdt was dominating the market.
But now it is on its all time high resistance, its a make or break situation,
Buy crypto on full leverage and go all in like apes

USDT Dominance Weekly Chart - May 01 2024Looking at USDT Dominance chart shows that a weekly retest of 5.0% area is almost done so the whole dump in crypto over the past few weeks hasn't been something irrational !!
As you can see the 5.0% zone is a very strong resistance area meaning that USDT.D can form a top here and start the drop again which will cause the market to pump.
USDT Dominance 12H analysis - May 01 2024#USDT.D Weekly & 12H charts
5.0% zone is a very strong resistance area meaning that USDT.D can form a top here and start the drop again which will cause the market to pump.
Looking at 12H chart it's also pointing that the upward move in USDT.D can end somewhere in 5.19% - 5.71% zone.

#DOMINANCE IS AT DO OR DIE CONDITION!#Dominance Currently at resistance, if it gets rejected, then we may see a relief in BTC and ALTS.
But in case a breakout could cause problems for both BTC and ALTS.
Be careful, and remember to set stop-loss orders!
#Crypto

Market will crash in new 2024?USDT.D is a crucial parameter in the crypto market, and I have great confidence in its chart. It often indicates market movements ahead of time. Currently, it's at a significant support level, bolstered by both dynamic support and a pivot area. If it breaks below the dynamic support, we could see a substantial uptrend - essentially, 'going to the moon.' However, the support levels appear robust, so we might anticipate a rise, possibly leading to at least a deep correction in the crypto market.
Please be patient today, as market volume is lower due to the holiday season.
Wishing you all a Happy New Year, my friends!

in resistanceFinally, it reached heavy and firm red resistance and is slightly broken.
If this failure continues, higher red resistance targets will await it.
Overall, Pullback remained in the red line (around 5.87%) and was in debt

USDT.D & BTCBased on my complex yet simple studies this happens in the market , however I always say enter the market according to yourself analysis .

ascending parallel channelHello traders!
as you can see dominance is in ascending parallel channel.
I expect in middle of may it's going to top of channel then going down.

USD Dominance analysis. Good for BTC Trade.Hello everyone, i want share my idea about USDT Dominance.
I will use that analysis for BTC Swing Trade.
USDT Dominance tested weekly resistance where it got rejection 3 times, price fell to 4.60 LVL where was buyers but if we look price action sellers take control and correction of bitcoin has end. bitcoin tested 60000-59000 support zone where it got pretty good reaction from buyers.
If we look total crypto market chart we will see, buyers take control and the price action came back to uptrend, in my opinion BTC correction done, now its time for new high but what will be next stop who knows.
At USDT dominance i am pretty bearish, uptrend price action losing momentum. my 3 scene of price action will show am right or not>
TIP! After i start analysis at USDT Dominance my BTC Trades win rate has raised, price action is not absolutely same of BTC but when here we have huge moves, most comes to BTC, when i want to open trade at BTC first i am looking total crypto market cap and USDT Dominance.
Always make your own research!!!

USDT.DominanceGuys, pay attention to Dominance Tether
The reason for this drop a few hours ago could be the increase in Tether's Dominance
Currently, Tether has reached the resistance zone and there is a possibility of a small correction, and if this happens, we will see an increase in the price of Bitcoin.

USDT.DAfter completing the diametric, we can modify it
After completing the diametric, we can modify it

usdt tether about to tank god blessin my opinion or which the charts convey looks like the crypto market is going to rip.
its on the 5 day chart but there's a death cross which is beautiful for the crypto market
usdt tether should have a nice drop
giving us some bull momentum
pack your bags we going up
