BTC is likely to crash in the near futureI don’t think we have a real chance of holding above 100K for long. There are strong similarities to the 2022–2023 bear market, and there’s a significant risk of a BTC crash. I’ll be sharing a few ideas on this soon.
USDT.D trade ideas
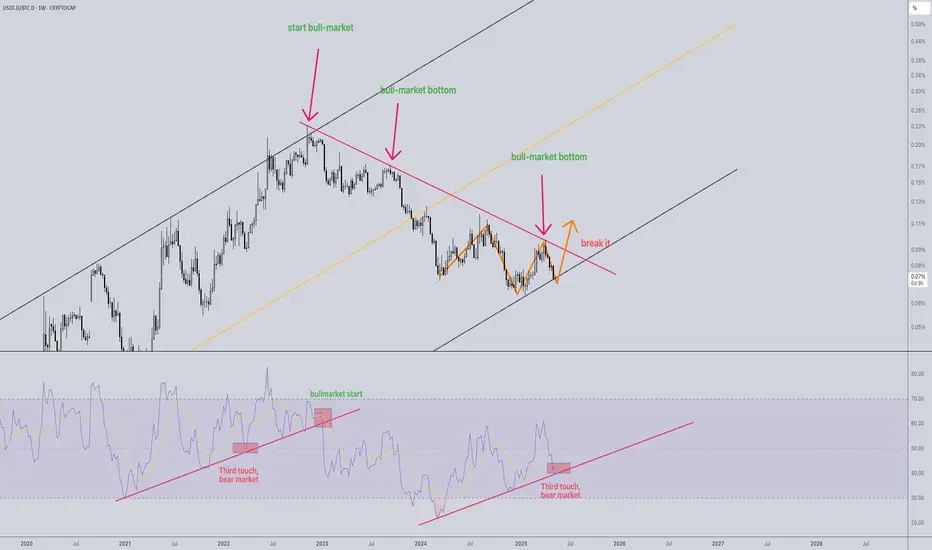
USDT.D chart analysis After a beautiful break of the head & shoulders pattern, we've broken the next support as well, im expecting a little pullback to it and if it confirms as the resistance then the big game will start, USDT.D will go down and at 2.66% - 2.55% is where im predicting to be the top of the market.
DYOR
Goodluck

End of the Rally or a New All-Time High BTCIn this analysis, I examine Bitcoin's potential scenarios across the daily, 4-hour, and 30-minute timeframes. I outline the key possibilities that may unfold, identifying critical support and resistance levels, and exploring whether the recent momentum indicates the end of the current uptrend or the beginning of a move toward a new all-time high.

USDT Dominance (USDT.D) – Critical Level ApproachingUSDT Dominance is one of the most important macro charts in crypto. When it trends down, liquidity typically flows into crypto assets — when it rises, capital rotates out of risk assets into stablecoins.
📉 Current Structure:
USDT.D is aggressively dropping and now approaching the 4.32% support zone, which has historically triggered market pullbacks.
⚠️ What to Watch:
If USDT.D finds support and bounces, we may see a short-term correction across the crypto market.
If it breaks below 4.32%, it could trigger another bullish impulse in BTC and altcoins.
💰 Strategic Note:
If you're riding long positions from lower levels, this is a great time to secure partial profits and wait for market confirmation. Patience at support zones often pays off.

Steibles dominance: USDT.D+USDC.DThe graphic shows Kryptan blood and tears - in red variant. And bullish crypto - triumph in blue!
I am of course counting on the blue variant, as:
1)There has been no normal bulls with the fall of bitcoin dominance.
2)The American newly elected tech team hasn't shown anything meaningful except loud populist statements and family memes.
3)Stimulus with rate cuts, QE, M2 and other liquidity releases haven't really kicked in yet
So I'm waiting for an epic risk on and exit pamp!
Translated with DeepL.com (free version)

Clean Inverse H&S on UsdtUsdt is forming a Clean Inverse H&S pattern if it plays out u know what happens to the crypto sector


Usdt dominance Don’t sell yet usdt dominance has a long way before it reaches support . it could slightly correct but the downtrend has begun . Macd looking very weak . Remember usdt.d going down means btc and altcoins go up . Once at support if it breaks down the major bull run for alt coins will begin. I am convinced we will see a final alt coin season

USDT Dominance UpdateIt would be a highly bullish scenario if USDT Dominance breaks down to its previous support level.
I bet BTC could create a new all-time high if USDT.D moves as analyzed.
On the other hand, a rebound from here could spell serious trouble for BTC and the broader market.
Trade safely.

USDT Rejected at Resistance — Alts Could Pump SoonUSDT Dominance is still stuck inside a strong downtrend channel.
It got rejected again at the top of the range right inside the cloud and below the 200 EMA.
Here’s why that matters 👇
- Bears defended the trendline
- Price failed to reclaim key resistance
- Cloud structure shows weakness ahead
If this keeps sliding, it could open the door for altcoin momentum.
Liquidity might be shifting. Keep an eye on it.
DYOR, NFA
#ALTSEASON

USDT.D (Tether Dominance) AnalysisUSDT.D, which stands for Tether Dominance, shows the share of the stablecoin USDT in the total cryptocurrency market. This metric is an important indicator for understanding investors' risk appetite. When USDT.D rises, investors typically move from risky assets to stablecoins. This is considered a negative signal for the crypto market. Therefore, there is an inverse correlation (negative relationship) between USDT.D and Bitcoin.
The upward trend that has been ongoing since January has now been broken. This break indicates that the market's risk appetite has increased and investors have shifted from stablecoins to risky assets. Bitcoin's recent rise can also be seen as a result of this break.
Currently, USDT.D is trading close to a support zone. According to Fibonacci retracement levels drawn from the peak, the 0.5 level is a notable area. This point appears to be a technically suitable level for USDT.D to react and potentially continue its decline.

USDT.D update (1D) - May 01 2025USDT dominance has beautifully followed the analysis so far. After crossing down the indicated blue trendline, USDT.D has begun a downward movement and we can see many coins have had nice rises since April 9th as it was predicted.
This downward move will probably expand towards the 3.7% support zone where we expect BTC and altcoins to form major daily and probably weekly pivots but a temporary upward reaction can be expected along the way in the 4.58% - 4.73 zone meaning that there will be a temporary weak or strong dump in the market.

USDT Dominance Update (12H)It seems it can drop a bit more. Upon reaching the green box, it could reverse upwards and lead to a market correction in crypto.
In the green zone, caution is needed, and new purchases in the crypto market should be accompanied by precise capital management.
For risk management, please don't forget stop loss and capital management
Comment if you have any questions
Thank You

Tether Dominance, TA» There is a lower high on the chart. This is a long-term timeframe. The signals are very strong here.
» There is a strong rejection at SMA200, this level being confirmed as resistance.
» There is a very strong decline in volume.
» There are three consecutive weeks closing red.
These are all very powerful bearish signals.
» This week wicked lower compared to 24-March.
Tether Dominance just produced the lowest reading on a drop since November 2024. When USDT.D was moving down in November 2024, everything Crypto was moving up. The conditions are similar today.
Tether Dominance can be seen moving down as a continuation of a bearish trend. This is happening after a lower high is fully in and confirmed.
Short-term, there can be a small pullback followed by lower prices.
For example, several days can close green but by the time next week ends, the action turns full red. Just as it happened on the 7-April week. The action started strongly bullish but USDT.D ended with a bearish week and the start of a decline that will lead to a lower low.
We are likely going to see the lowest reading on this index since March 2022 or December 2021. It is a long process but the chart is pointing down. That is what the chart says.
Thank you for reading.
Namaste.

USDT.DUSDT.D is expected to rise first and then fall. The possible return point could be the 5.30-5.38 range.

USDT Dominance Update!USDT Dominance Update:
USDT.D is rejecting from resistance and holding above support. This is the same resistance level where USDT.D was previously rejected, which was followed by a new all-time high in BTC.
If dominance stays below 5.40%, we could see more upside in BTC and altcoins. A drop below 5.02% would be even more bullish for the market.
Regards,
Dexter.

BTCUSDT Long-Term Projection – Accumulation Before Breakout?BINANCE:BTCUSDT.P is currently in an accumulation phase, following historical liquidity grabs and retracements. The chart highlights key liquidity zones, Fibonacci levels, and potential price movements.
🔑 Key Observations:
Possible Accumulation Phase between $88,000 - $97,000 before a bullish move.
nPOC ($97,148) is a critical level—price may revisit before moving higher.
Liquidity Zones: 1-week, 1-month, and 3-month liquidity targets identified.
Fibonacci Levels: Watching the 0.618 ($96,965) and 0.786 ( $93,422 ) retracement levels for a potential dip-buy opportunity.
Long-Term Target: $120,000+ by the end of 2025.
💡 Will BTC accumulate before making a strong push to new highs? Let me know your thoughts in the comments! 🚀📈

$USDT.D Cycle Top ProjectionI could see CRYPTOCAP:USDT.D playing out like this.
This November data also coincides with my BTC Cycle Thesis in November.
Lotsa other macro factors and indicators at play for a cycle top, but this lines up nicely and where I'll be taking a heavy chunk of profits.

$USDT.D | #1D OverviewUSDT dominance is currently sitting at daily support, aligning with both the 1D S/R zone and the 200 EMA — a key confluence level.
📉 A local bounce or consolidation is likely from here.
🔺 Major resistance stands at the 5.6% zone (highlighted red).
If price pushes into that area and starts to reverse, it could trigger a fresh leg up in altcoins — classic risk-on signal.
📌 Takeaways:
— If you caught the recent alt run: consider partial profit-taking.
— If you missed the move: don’t chase here, better to wait for a clearer entry after confirmation.

USDT.D Bearish Reversal Incoming Into a New Bullish Phase in BTCUSDT.D Update:
Its been a while since my last USDT.D update on here since i accurately forecasted and called the top in September last year from its last distribution range. Since then, Ive been expecting USDT.D and USDC.D to continue higher into deeper premiums and into monthly and 3M supply areas, taking further BSL in the process and coming into the HTF downtrend channel high, whilst the rest of the market continued bearish after the first moves from last year.
Both have done just that, pushing higher to extreme supply and heavy premium pricing. USDT.D has topped out with high volume as it come into refined extreme daily supply from the UT event in the prior distribution range, whilst taking the LQ at the 5.93% level i discussed in the market update videos. This is effectively following last points of supply from one distribution range to the next, following HTF bearish orderflow and HTF bearish structure in stablecoin dominance pairs. From the recent UTAD event we have seen bearish breakdowns on the daily timeframe on both USDT.D and and USDC.D, marking a turn in the market where things should start to get more interesting! Im looking for this again but on the weekly timeframe and monitoring for a HTF weekly close below the weekly HL, therefore putting in a LL on the weekly to give further HTF confirmations of the reversal from this area.
Whats interesting at this point is the last couple days of data on both USDT.D and USDC.D and the range conditions we are now creating.
For me, it looks pretty similar to the last top, where we created a distribution range in HTF supply after taking extreme key levels and LQ, putting the market in extreme fear, before slowly flipping bearish in the range before a full blown reversal and breakdown to the 3.73% level.
Im expecting a bounce of some degree over the next week or so in USDT.D back into the 5.57% region where the range high sits alongside some daily and refined 12H supply zones from the UTAD event. Im looking for a push into supply forming a LPSY last point of supply in phase D, before continuing HTF bearish to target SSL on the lows of this upward trend channel with my main targets between 3.73% and 3.12%. This aligns with what im seeing in BTC as posted today on TradingView and the market, expecting a pullback to demand respectively before continued upside.
I don't for see this taking the highs again above 6.24%. There is a lot of resistance and supply in this range now we have broke down and its likely we are seeing the formation of the reversal taking shape in due course.
As ive stated i the most recent BTC analysis, this is a risk on situation in my opinion and i will be allocating capital to spot bags as USDT.D hits its supply levels in the range highs and as BTC comes into the daily demand levels im monitoring between $84,000 - $76,500, buying the dip whilst expecting further upside and a HL to form in BTC and new LHs in stablecoin dominance pairs.
To finish, look at this chart on the daily, 2D, 3D, 4D, 5D, 1W, 2W, 3W charts and really look at the HTF closes on these candles at these highs. Theres been no HTF bullish closes above HTF supply or significant highs. Price has failed to put in new higher highs and is merely sweeping highs now with high volume rejections, volume dropping off, all whilst looking like a top imo with HTF weekly rejections all the way up to the monthly candle.
1D:
3D:https://www.tradingview.com/x/XtxjrvGR/
1W:
1M:

USDT Dominance on its way to 3.80%: Bullish or Stormy?USDT Dominance on its way to 3.80%: Bullish or Stormy?
USDT Dominance (USDT.D) is approaching the critical threshold with the recent decline. As seen in the chart, the direction is now down with the break of the uptrend. However, the general acceptance that this decline is the beginning of the bull season may mislead many investors.
Because when we look at the past, the 3.80% - 3.60% range has usually been the end point of the bull season, not the beginning.
What does this mean?
🔹USDT.D falls while BTC rises. However, these declines usually coincide with the last days of the bull.
🔹If there's a rapid descent into this zone, we could see a sharp rise in BTC. But this move is often the last wave.
🔹So when it comes to that level, while everyone is waiting for new highs, smart money may be preparing to exit.
Also another point to pay attention to;
🔸 On the BTC side, the 102K - 104K zone still remains the strongest liquidation area.
🔸 If USDT.D falls below 3.80% while testing this region, attention! That peak may be the last.
Therefore, while waiting for the above liquidation levels, we should keep an eye on the USDT.D chart. Because when it approaches 3.80 levels, risk bells may start ringing. This is the target for now.
As a result, when you start dancing to the song that will soon play in the background, do not forget that the music may suddenly stop and the lights may be switched off.

We might be seeing a short-term correctionWe might be seeing a short-term correction, as the USDT supply is rising again and both ETH and BTC failed to break through their resistance levels — while Solana did. A brief pullback is possible, especially considering that the main reason behind the breakout was recent news about Trump. That could mean the breakout was a fake move or part of a temporary trend.
The three major currencies that usually drive the market are currently showing less bullish momentum for the coming days — except for Solana , which successfully broke its resistance . However, Solana isn’t continuing to climb either, likely because we still need a breakout from both ETH and BTC to confirm the move.

USDT Dominance is finally Breaking down. Usdt dominance is finally topping out and going to start it's new downtrend
And massive bull run in Bitcoin and your altcoins as well like i have discussed with you in my previous ideas you can check them out.
But 3.7% support is now weak
My potential targets for usdt dominance reveal is approx 2.7 and 2.5 range
So plan accordingly don't exit too early and don't try to sell exact top.
Work without emotions and stick to the plan
Sayonara
