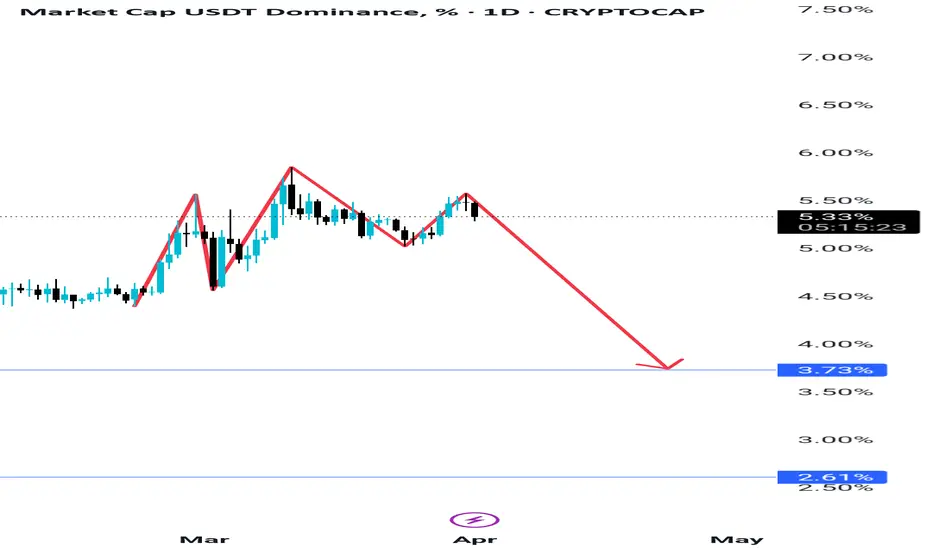
USDT.D hit our target of 5.6-5.7% as mentioned in my last idea. USDT.D has closed above PSH at 5.51%, which warrants caution. However, I’d like to wait for the weekly close to confirm the direction USDT.S is headed toward. That said, we’ve now taken the 5.6-5.7% level I mentioned last week in my idea, and this should provide enough liquidity to target downside levels. If we overshoot and wick, keep an eye on the 6.1-6.2% level as our next liquidity target, which will likely align with BTC’s 68K-72K range. On LTF and MTF, there’s not enough liquidity left in the current range, and I think if we go down, we’ll see a smooth ride until 4.35%
USDT.D trade ideas

%6.49Think simple.
* What i share here is not an investment advice. Please do your own research before investing in any digital asset.
* Never take my personal opinions as investment advice, you may lose all your money.

Patience Friends...Howdy again,
As much as the 2.5% is coming we must have patience. It looks like it wants to tough the resistance trend lines once again before actually losing this support here. It also is a double bottom on the weekly which is pretty hard to break, but once it does, not only btc, but the whole market will explode.
Trade thirsty!
P.S: I'll put this as SHORT even though you should LONG usdt and SHORT the market.

Exit if not already outExpecting usdt market cap to increase as participants leave crypto.
Expecting this to top around 12%
I will reenter crypto around this time
Expecting this to be 18months to 2 years away

BREAKING:- USDT Dominance on the verge of Breaking Out!🧨 USDT Dominance on the verge of Breaking Out?
USDT dominance just hit major resistance near 6.02% – and it’s trying to break out of a long-term downtrend.
⚠️ If it breaks and holds above, it means money is flowing out of crypto and into stablecoins – a big risk-off signal.
What it means for the market:
Altcoins could dump harder
ETH/BTC could weaken
Overall sentiment turns more bearish
Tough times. Stay safe. Protect your capital.
WHAT YOU WANT IS A HARD REJECTION and BTC bounces from the short-term FVG around $73-$76k.
Alts start to recover.
I want this scenario to play out. Time will tell!
Let me know what you think in the comments section and please hit the like button if you like it.
Thank you
#PEACE

USDT.DMonitor a break of 5.84% as a bullish continuation signal, or a break of 5.5% as a bearish warning.
Note: It's best to combine this analysis with other technical indicators (such as RSI, trading volume) and market news to make informed decisions. 📈📊

USDT.D UPDATEThis is the version that scares me. There is also a flag here and a breakout to the upside would cause a 10% drop in Bitcoin. It is worth watching and being careful.

WOW, I can see ALTSEASON of 2025 what about you?USDT.D can show me as a big sign of starting ALTSEASON. also if break the line.

USDT.D Weekly : So IMPORTANT AreaHello and good timeو
Well, as I indicated on the chart, we have two very important areas. The initial box, if the price is rejected in this area, we can expect Bitcoin to be 70,000 to 74,000. However, in the event of a stock market crash and stories related to global tariffs that cause a heavy stock market crash, if the crypto market follows the fall, in the Tether dominance chart, we can reach the upper box areas, which can be said to be Bitcoin at $48,000 to $50,000. Be very careful in your trades.
SecondChanceCrypto
⏰ 6/april/26
⛔️DYOR
Always do your research.
If you have any questions, you can write them in the comments below and I will answer them.
And please don't forget to support this idea with your likes and comments.

USDT Dominance Good for Bitcoin price actionHello everyone!
I want share my price analysis at USDT Dominance.
The reason i am making Bitcoin price action analysis at USDT Dominance is here chart is more clear and gives me better view of what is happening at market.
After Trump inauguration day most of retail traders excepted bullish bitcoin, but we saw strong sellers, that means bitcoin will find new strong buyer and it will reach new high then, but i think the new high will be maybe 2026 or 2027. if we will look at USDTD we will see the price action is still uptrend, but not too strong it tested well support after 1D double bottom and went higher.
my price prediction will be it will test 6.75 were it will get huge reaction, but the price will come back second time and we need to wait for that moment, if we will get same price reaction, it will be start of bullish bitcoin, at the moment i think bitcoin will be at 55000 or 60000, but if USDTD will brake 6.75 then we need to wait Bitcoin at 40000-45000.
We will see what will happen that's only my opinion it will happen.
Always make your own research

Last Chance BTC ETH USDTLast Chance BTC ETH USDT
USDT Dominance reached the 18 month trendline strong resistance
Either USDT will form an ascending triangle or double bottom

usdt.d(based on Neo wave)This is the final branch of corrective wave and with breaking down 5.15 the bullish wave of crypto begins . for more information follow every counting of charts.

usdt.d in the sensitive buy or sell zoneThe dollar needs to hold 5.41% to rise. The chart below is drawn with Gann Box. The upside and downside targets are clear, but I think the dollar failed to break 5.41% today and I expect the downtrend to continue. This is just an opinion and do not include it in your trading goals.

USDT.D Launched in 2014, Tether is a blockchain-enabled platform designed to facilitate the use of fiat currencies in a digital manner. Tether works to disrupt the conventional financial system via a more modern approach to money. Tether has made headway by giving customers the ability to transact with traditional currencies across the blockchain, without the inherent volatility and complexity typically associated with a digital currency. As the first blockchain-enabled platform to facilitate the digital use of traditional currencies (a familiar, stable accounting unit), Tether has democratised cross-border transactions across the blockchain.

Market Cap USDT Dominance (updated)Don't worry, the good days are coming soon.
**** Yousef Sharafi ****
Follow me here for more analysis

USDT.D.the end of wave B and the last incoming pulse that will open the altseason and end it as part of C(c)

USDT.D - The dominance of real moneyThe dominance of the dollar over cryptocurrencies is a real indicator of the growth status of ETH!
The last wave of correction and decline is happening now! Pay attention to the accumulation zone before the Bitcoin price drops/inflates.
Money is being transferred to BTC=>ETH=>ALT=>USDT=>BTC and so on in a circle, during the active participation phase of DOU, money is being transferred to ETH and beyond, so be vigilant
In addition, I would like to draw your attention to the BTC.D indicator.

BTC.D Scenario 2: Potential USDT.D BreakdownBTC.D
In this scenario, if USDT.D fails to create a new high or even an equal high and starts melting down, it could indicate a bearish structure forming—specifically, a Head and Shoulders pattern. This pattern often signals a reversal, meaning USDT.D could continue dropping.
If this happens, it would likely lead to BTC dominance (BTC.D) rising, as capital flows out of stablecoins and into Bitcoin. This could fuel an upward movement for BTC, making it crucial to keep an eye on this development.
Stay prepared and plan accordingly. Hope this helps!
Altcoin Recovery Depends on This USDT Dominance BreakAltcoins have taken a heavy hit — many are down 60–80% from their highs.
As seen in the USDT Dominance chart, we're still respecting the rising trendline. Until this trend breaks to the downside, pressure on altcoins may continue.
Key Zone to Watch:
Once USDT.D breaks below that rising support line and sustains a move lower, we could witness a strong recovery phase across the altcoin market. That shift will likely signal renewed confidence and capital rotation into risk-on assets.
Stay patient: The breakout is brewing. When that trendline cracks, altseason could ignite fast.
Keep your watchlists ready. The reversal will reward the prepared. 🚀
Like and drop a comment if you found our analysis helpful — your support keeps us going!


USDT.D & BTC Price Action Understanding the Market Move: USDT.D, BTC.D, and BTC Price Action
Currently, USDT Dominance (USDT.D) is approaching a key level, sweeping its previous high. This indicates that traders are moving funds into stablecoins, usually a sign of risk aversion. Due to its inverse correlation with Bitcoin (BTC), this movement suggests that BTC may experience further downside in the short term.
However, once Bitcoin Dominance (BTC.D) completes its retest of the previous high, a major shift is expected. If BTC.D starts to decline sharply, it means capital is flowing back into altcoins and BTC itself. Historically, this pattern has led to strong bullish momentum for Bitcoin, potentially triggering a major rally.
This dynamic between USDT.D, BTC.D, and BTC price action is crucial for traders to anticipate market movements. Keeping a close watch on these metrics can provide valuable insights into the next big move in the crypto market.

Opportunity to escaping !The chart is monthly and each green candle is an opportunity to escape from this market.

USDT dominance: Head and shoulder pattern on LTF!!Join our community and start your crypto journey today for:
In-depth market analysis
Accurate trade setups
Early access to trending altcoins
Life-changing profit potential
Let's analyze USDT dominance:
USDT dominance is nearing a breakdown, forming a head and shoulders pattern. Rejected at 5.55%, it's testing 5.3%-5.2% support. A breakdown here could provide temporary relief for altcoins, as capital shifts.
Resistance:
5.55%
5.4%
Support:
5.29%
5.21%
If you find this analysis helpful, please hit the like button to support my content! Share your thoughts in the comments, and feel free to request any specific chart analysis you’d like to see.
