BEARISH SCENARIOI'm currently tracking a bearish scenario for USDT.D. Two Harmonics are presented namely ABCD Shark patterns. This is due to the double bottom formation of the USDT.D, an Imbalance has to be filled at approximately 7.5%, and a liquidity at around 9.5% that needs to be taken out. The invalidation level would be below the double bottom formation...
USDT.D trade ideas

bear targetAfter 4 months of watching at this chart i made a conclusion. Here is the global picture.
The reactions on the chart are always zigzags. The whole figure has: 3-5-3-5-3 structure, which gives the impression that it is an ending diagonal.
The target for diagonal is a figure is its base, marked by the blue horizontal line - 9.42% on the dominance, or +72% from the current value.
If the chart will consolidate above 5.81 %, i.e. above the sloping downtrend line, it would be confirmation that bear market has started in 2024 December, or we are in ABC now.
This trend line is the key because this line is global for the current bull market.
If this is an ending diagonal figure, I beware for the future of national fiat-currencies, after the bear market on cryptocurrencies. But i still need to think more on this discovery.

USDT.DTime for this macro bearish expanding pattern to break down. Downtrend still beautifully in play and we had a nice weekly rejection from the downward channel. Buckle up. Sentiment is crazy bearish in crypto at this moment... and its ideal to push btc and alts up higher.

A rare bearish signal has appeared- USDT Dominance is overboughtWhen USDT Dominance shows overbought signals, it might be time for a retracement.
And when it goes down, the whole crypto market tends to go up.
Right now, we are in such a moment.
The next few days will reveal the direction.

USDT Dominance with multiple resistancethe USDT dominance as a very strong resistance area with multiple resistance such as 61.8% of Fibonacci retracement and trendline and i am expecting a rejection to the downside in march time


USDT.D Important Support and resistance!!Join our community and start your crypto journey today for:
In-depth market analysis
Accurate trade setups
Early access to trending altcoins
Life-changing profit potential
Let's analyze USDT dominance :
The USDT dominance (USDT.D) recently rebounded from a critical 3.80% support level, coinciding with BTC's price drop from $109,000 to approximately $78,000. Currently, USDT.D is testing the 5.70% resistance. A minor pullback to 4.90% is possible. However, a break above 5.70% could propel USDT.D towards a higher resistance zone of 6.35%-6.60%. For Bitcoin to reach a new all-time high (ATH), it's essential that USDT.D rejects these resistance levels and subsequently breaks below its upward support trendline.
Support Levels:
4.90% (current support)
3.80% (crucial support)
Resistance Level:
5.70% (current resistance)
6.35%- 6.60% (crucial resistance)
If you find this analysis helpful, please hit the like button to support my content! Share your thoughts in the comments and feel free to request any specific chart analysis you’d like to see.
Happy Trading!!

Tether Dominance, Weekly OutlookAs we see USDT.D Bounced from long formed Support / Resistance zone, while tested it with long wicks several times.
- RSI Divergence
- Bounced From Support
- Below 21 Week EMA

USDT.D hinting of a massive cryto market reversal ↑. GET SEEDED!USDT.D an inverse confluence of the crypto market has predicted the major correction before it happened. It has gone parabolic for a few weeks tapping its favorite resistance roof line aT 5.50%.
Now, based on the last weekly close, USDT.D is hinting of a major market reversal to the upside. (USDT.D falling = crypto market rising). It means USDT.D in red means, more cash are being converted to crypto holdings.
The first descending shift line at the upper channel has been registered. First time since September 2024. This is already conveying of a major shift in trend and a weighty series of price growth from here is forthcoming in the next coming weeks.
Best season to get seeded again on the market -- moreso scale in on the bluechip ones, BTC ETH ADA XRP.
It's that season again. A very green one.
Spotted at 5.30%
Mid target at 3.50%.
TAYOR. Trade safely.

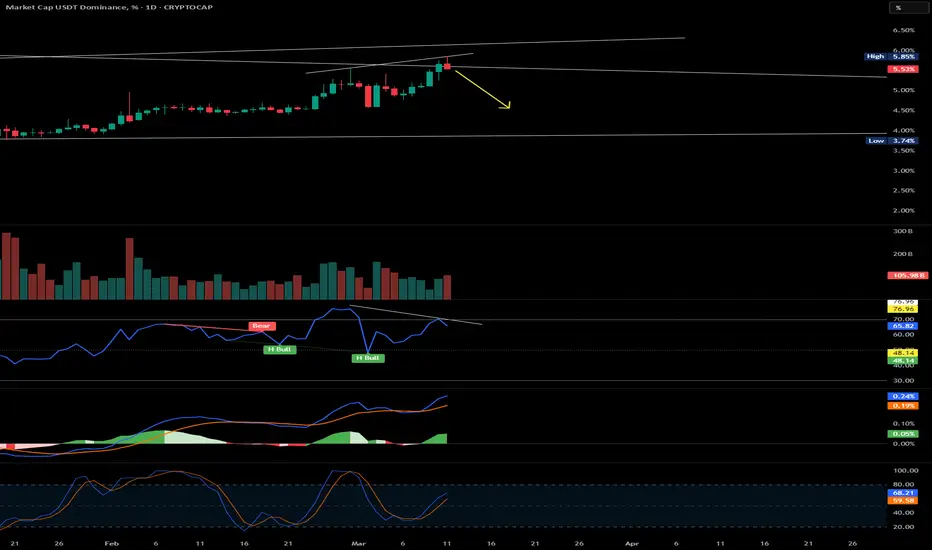
USDT.D update (1D) - March 14 2025Back in Feb when USDT dominance was at 4.7% level, it was stated that the index was about to rise and in reality the same took place and the rise in USDT dominance caused heavy dumps across the entire market.
USDT.D is now in the vicinity of the long term descending trendline and some initial bearish signs are visible. Since it is the 3rd touch of the said trendline, we don't usually expect a crossing unless (for any reason) a strong sell pressure in the market kicks in.
The main scenario here is a drop in the index which means a rise in the market.Yet, it needs some more time to do so and the trigger for the drop shall be the breaking of the indicated blue trendline.
The alternate scenario is that USDT.D crosses above the long term descending trendline causing more drop in the market for the coming weeks and months.


usdt.d - Tether dominance Launched in 2014, Tether is a blockchain-enabled platform designed to facilitate the use of fiat currencies in a digital manner. Tether works to disrupt the conventional financial system via a more modern approach to money.

Usdt.dTether dominance is clearly forming a head and shoulders pattern on the 2-hour timeframe. I think it should drop to 4.95 today, and the coins should grow.

USDT at the critical resistancethe USDT dominance is at a very important & multi resistance area.
it does have trendline resistance & 61% of Fibonacci retracement , and looks like we have a bearish divergence on weekly RSI for it as well.
with a weekly candle rejection we might see a rally for cryptos IMO.

Higher Local Highs for USDT.DCRYPTOCAP:USDT.D CRYPTOCAP:TOTAL NASDAQ:MSTR
In a previous post regarding USDT.D my updated 1:0.786 overshoot ratio target was reached. My original TA suggested that the 3 wave correction may be complete when my target was tagged.
After further research into MSTR; the structure does not appear to have completed its correctional phase. Being that MSTR is a leading indicator for BTC and TOTAL; this could suggest that USDT.D may continue to head on up, consequently driving many assets to lower local lows and quite a few to all time lows. (Check out my MSTR Publish).
For USDT.D; this 3 wave correction may in fact develop into a 1:1 retracement. I would imagine that we could get a wave down from here after hitting the 0.786 overshoot and possibly find support on September 2020 resistance/support structure before making another wave up, but those details can often become a bit fuzzy, so don't take my word for it.
In the previous trend up; from March 24' to August 24', there was a fairly clean 5 waves up that provided the clues of the trend, with the 5th wave marking the top. This is not the case for this trend up being that we have a double bottom at the begging of the trend and a messy way on up.
I'll be keeping a closer eye on MSTR as this asset is strongly recommended to follow by my charting coach dRends35, and I'm also noticing that it is on other traders radars as well.
With this note; Be extra cautious out there traders and good luck!
-NOT Financial Advice-

Market USDT Dominance (ATH) DroppingUSDT D is dropping from the last ATH we clearly saw the other days when the market was crashing to the abyss 💥
Smart money may move out once more from USDT into bitcoin and altcoins
As we may know - USDT D is much sensible to the Alt Coin market than Bitcoin
Mainly because the investor behavior is different from very high risk to moderate risk
I put a candle pattern on this chart - as a bullish scenario where liquidity eventually will poor out into altcoins and this time we may see the start of a prolonged bull altcoins season 🍀

USDT Dominance Showing Bearish Divergence – Possible Crypto MarkOn the daily timeframe, USDT dominance is showing a bearish divergence:
Price Action: Higher highs
RSI: Lower highs
This indicates potential weakness in USDT dominance. However, we need today’s candle close for confirmation.
If confirmed, we could see a drop in USDT dominance from 4.5% to 3.8%, which may trigger a strong recovery in the crypto market.
Traders holding major losses may get an opportunity to reevaluate their positions. Let’s watch how this unfolds in the next 24 hours.
🔔 Stay prepared & manage risk wisely!
USDT.D at Key Resistance: Rejection May Boost BitcoinOn the daily timeframe, USDT.D is currently testing a strong resistance level that has been a key zone for several months. If we see a rejection here, it could signal a bullish opportunity for Bitcoin, as a decline in USDT.D often correlates with upward momentum in crypto assets like BTC. Keep a close eye on USDT.D's price action, as a rejection at this level could open the door for further Bitcoin gains. What are your thoughts? Let’s discuss in the comments!

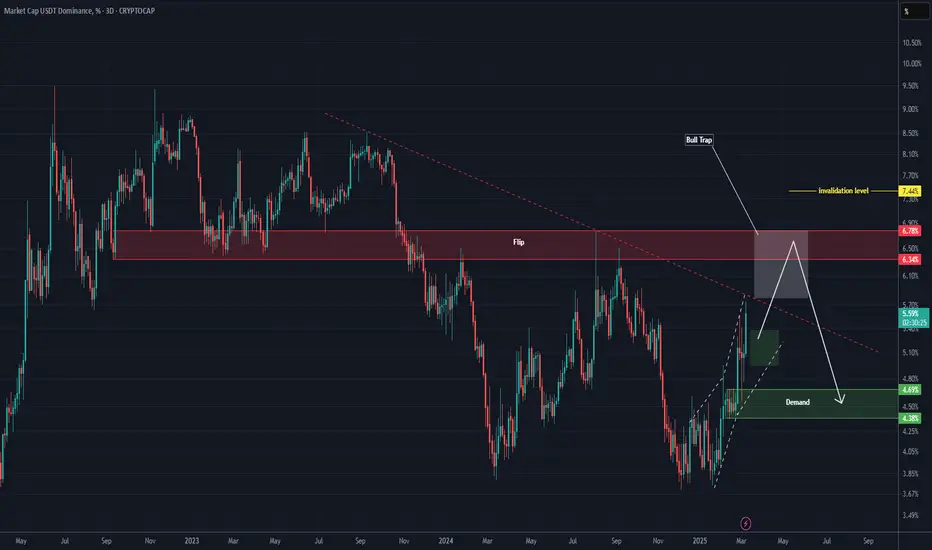
USDT.D Analysis (3D)With buying pressure and a twin tower pattern at the bottom, the downtrend line might experience a fakeout, creating a bull trap, leading to a strong rejection from the red zone downward.
We expect a rejection from the red zone to the downside.
Bitcoin's bottom seems to be around 74K to 68K.
Let’s see what happens.
A daily candle closing above the invalidation level will invalidate this analysis.
For risk management, please don't forget stop loss and capital management
When we reach the first target, save some profit and then change the stop to entry
Comment if you have any questions
Thank You
USDT.D dominance at important resistance? Crypto rally coming?BTC and ETH coming to an important support level. And USDT dominance at the big resistance.
Many cryptocurrency dominance charts, as well as Nasdaq and stock charts at support too.
Is the reversal starting?
We’ll see.
This is not investment advice. Please do your own research.
Wishing you best.
-YusufDeli

USDT Dominance Holding Strong – Altcoin Rally Soon?CRYPTOCAP:USDT Dominance chart shows an uptrend, respecting the rising support line and holding above the 50 EMA. Key levels include strong resistance at 5.40%, mid-support at 4.70%, and strong support at 3.70%.
A breakout above 5.40% could signal altcoin weakness, while a rejection and breakdown below 4.70% may lead to an altcoin rally.
Watch these levels closely—altseason or sell-off? The next move will decide!

USDT.DOMINANCE CHART UPDATE USDT dominance analysis update! It's helpful to examine the key technical factors you're monitoring, such as the descending triangle, resistance trendline, Ichimoku cloud, and 200MA.
Since a drop in USDT dominance can signal bullish momentum for the cryptocurrency, are you looking at price levels to confirm a potential break of support?
If you found this analysis helpful, hit the Like button and share your thoughts or questions in the comments below. Your feedback matters!
Thanks for your support!
DYOR. NFA
