BTC mining in South America for Tether adds to the longAre you ready to take your mining game to the next level? Look no further than Tether's latest venture in Uruguay. With its stablecoin technology and top-notch infrastructure, Tether is poised to revolutionize the mining industry. Join us as we explore this exciting opportunity and discover how you can reap the rewards of this cutting-edge technology.
Also , Tether's recent $1B USDT mint on Ethereum is for chain swaps! This clarification comes straight from the Tether CTO, so you can rest easy knowing this is a positive development for the crypto community. For more information, check out the official statement from Tether. Happy trading!
USDT trade ideas

The cross-chain bridge SyncSwap Move is officially launched and On June 5th, zkSync-based DEX SyncSwap tweeted that the cross-chain bridge SyncSwap Move has been officially launched. SyncSwap Move is supported by the official zkSync bridge and ZK tech, allowing transfers between Ethereum and zkSync Era. USDT and WBTC are the first native tokens supported by Move, and users can trade on SyncSwap.
Move allows users to check withdrawals and claims without any additional fees. The Gas cost of the official zkSync bridge is the same. The bridge token is 100% zkSync native assets and there is no third-party risk. Move is the front end of the official zkSync Era bridge, powered by ZK tech, with the same security as the official bridge. When users approve or transfer funds with Move, they interact directly with the official zkSync smart contract.

Changes to the stablecoins USDT and USDCUSDC market share has fallen from 34.88% to 23.05%
Over the past 1 year, USDC market share has fallen from 34.88% to 23.05%, with market cap dropping from a peak of $55 billion to $29 billion. BUSD's market share has plummeted from 11.68% to 4.18%, while Dai has kept its participation rate at 3.66%, down from 4.05% in May 2022. USDT, on the other hand, moved in the opposite direction, with stablecoin market dominance rising to 65.89% from 47.04% a year ago. Its market cap soared to $83.1 billion, the
In a recent interview with Bloomberg, Circle CEO Jeremy Allaire blamed the decline in stablecoin market cap on the crackdown on cryptocurrencies by US regulators. The current environment in the US seems to be working in Tether's favour.

USDT + USDC +BUSD + TUSD + DAI +GUSD +FX All significant USD Stablecoins cumulated.
Does it show the same pattern as the previous bull market?

Data: A giant whale bought about 1 million ARB with 1.15 millionAccording to news on May 23, according to Twitter user Ember’s monitoring, a giant whale used 1.15 million USDT to buy about 1 million ARB at an average price of about $1.145. In addition, it also transferred 1.5 million USDT to OKX.

USDT vs USDC Reserve BreakdownUSDT (Tether) vs USDC (Circle) reserves☝️
USDT seems to be more diversified then USDC, as they’ve split their reserves into 7 different asset classes. Compared to USDC who are only diversified into 3.
USDT has a healthy 4% of their reserves in Gold, which is up 8% year to date SO FAR. They’re more likely to survive a liquidation process, compared to USDT when the next Crypto crash happens💥

USDT and USDC supply to Total crypto market capSignificant Minting of stable coins is highly correlated with the size of the total market cap

Data: The address starting with "0x0b89" bought 1.08 million ARBAccording to the news on May 17, according to the monitoring of the chain analyst Ember, the address starting with "0x0b89" just bought 1,082,733 ARBs for 1.3 million USDT again, with an average price of $1.2. It is reported that the address held for 3 days after buying ARB last time: on May 13, 1,529,810 ARB was bought with 1.81 million USDT, and sold at a loss of 20,000 last night.


USDTWhen the USDT/USD exchange rate rises, it typically means that demand for USDT is increasing relative to USD. This could be due to a variety of reasons such as an increase in demand for stablecoins for trading purposes, or as a way to hedge against market volatility.
As BTC is often traded against USDT on many cryptocurrency exchanges, a rising USDT price could potentially have an impact on the BTC price as well. If the demand for USDT increases, this could potentially lead to an increase in demand for BTC, which could drive up its price.
However, it's important to note that the relationship between USDT and BTC is complex and there are many other factors that can influence their prices, including market sentiment, news events, and overall market conditions. Traders must analyze multiple indicators and consider various factors when making trading decisions.

all stable coins mc vs total mc All stables market cap to total marketcap gives us overall stables dominance. Here I have very nice confluence with 3 different important fibbonaci level. Correction may be ended already, and this will cause a nice discunts on all crypto. ...

USDT 1D Technical Indicators Point to Bullish TrendAs a student of the art of trading, I have been monitoring the market conditions for Tether (USDT). The market cap for USDT is currently at 78.556 billion dollars, with a resistance level of 78.787 billion dollars and a support level of 72.467 billion dollars.
Looking at the technical indicators, the 20-day moving average (MA) is currently at 74.628 billion dollars, and the 50-day and 100-day MAs are at 71.726 billion dollars and 69.168 billion dollars, respectively. The 200-day MA is at 68.185 billion dollars, indicating a bullish trend.
The CME gap and RSI:SMA indicators are showing signs of strength, indicating that USDT may continue its upward momentum. However, it is important to note that the MACD is currently at 2.448 billion dollars, which is relatively low, and the histogram and 200MA signal are at 718.479 million dollars and 1.73 billion dollars, respectively. This suggests that there may be some potential for a bullish crossover and upward price movement in the near future.
As a trader, it is important to stay vigilant and to carefully monitor the market conditions. It may be wise to consider taking profits on any long positions if USDT reaches the resistance level of 78.787 billion dollars, and to look for opportunities to enter long positions if the support level of 72.467 billion dollars is held.
Overall, while the technical indicators are currently bullish, it is important to remain cautious and to have a well-defined trading strategy in place to manage risk and to maximize potential profits.

Use Case for USDTTicker $X.USDT
Pros/Cons for a good friend.
1. USDT avoids volatility. See comparison chart below showing the relationship between the S&P500 and USDT. Note that there is not any existent co-efficient between the two.
2. USDT is prone to inflation. USDT is tethered to the US Dollar meaning it will be impacted by inflation. Example, 8.9% YoY.
3. Relationship between USD/JPY. See chart below noting the co-efficent between the two.
4. Staking/mining of coin using Ehtereum or the like can be profitable and outpace inflation and avoid volatility of the market while earnings a consistent reward.
5. Relationship between 10Y Yield and US Growth Stocks/Ethereum shows that USDT is not completely stable.

USDT Casino Collapse is imminent here's my proof --Be Warned--
Right I just got some time to get around looking into Tether after recent events, and I have to say I have never seen such an uneducated community get fooled by a "Merkle Tree" proof of reserves?
---Problem one---
The Binance CEO states a Merkle Tree is the best way to prove user funds, why does this not work? There is ZERO way's to check if multiple users are allocated the same USDT (Tether) on their trading accounts or balances.
People hold balances on exchanges for insane APY returns that is another story but I have done some research and hardly anyone is using Tethers "Redeem" feature that you have to be VERIFIED to even use this removes anyone outside the know to have access to this system, ON top of that
Minimum fiat withdrawal or deposit
100,000 USD*
How can you expect people to possibly call the bluff on Tether if their limits are that high? WHY is their limits that high to redeem USDT for a USD currency equivalent balance? How many Stock Apps have limits like this for real USD on app stores? Not many.
---Problem two---
If USERS cannot withdraw small amount of USDT for USD that can be sent to an FDIC insured bank account in America you're all most likely holding a USDT that is valued less than 0.05c on the dollar.
Merkle Tree reserves are completely pointless as you would need to go through millions of accounts, I expect binance would flood this data with 20 million random generated accounts with asset allocation, this means you would have to go through each and every single one of these to confirm with the USER that their assets are allocated to that account.
And if you did this I'm sure you would have multiple accounts claiming to own the same USDT balance.
---Problem Three---
I have spent 5 hours today contacting representatives of major exchanges including Binance, ByBit, Phemex, Bitfinex, all of them are over exposed or completely exposed to keeping funds in USDT even though some of their contracts state USD that is misleading its not a base USD currency. In the real world we use FDIC banks with our trading brokers that settle and use USD balances as the USD is actually allocated and real.
---Problem Four---
Everybody / expert trying to short this crypto market in the final stage is about to lose everything, including your famous influencers you're going to see their wealth disappear faster than the Dot Com bubble CEOs, reason? everyone trading on these platforms are settled in USDT that if a collapse occurs you cannot redeem them. the few exchanges that have US bank accounts tied to their platform will let you redeem them sure, but you can short Bitcoin or Ethereum to -95% levels you could make 100 Million dollars but what's the value of your profits when USDT goes with it and you can only redeem it like a failed UST?
---Problem Five---
How can I explain why this is going on and what's the motivation behind it?, lets use a Casino for the example as many people know Casinos.
This Casino - ONLY operates Texas Hold EM Poker tables and major tournaments. (Which is a perfectly fair game)
This Casino - ONLY allows you to play with their CHIPS that needs to be converted from a USD deposit. (Which is a perfectly fair system, handled by each individual state Casinos are regulated and finances checked to prevent them circulating more CHIPS than USD deposits, states fine them when this happens similar to underage people allowed to gamble hence the incentive makes it pointless to even try as a Casino when you're already winning)
This Casino - Is regulated and checked by many US based Auditors and the US Government, including using real US Bank accounts.
---Final Problem---
I want you to imagine This Casino, running trillions of dollars in poker tournaments attracting people all around the world globally they pay influencers for sign up rewards they create the entire system from scratch, this Casino now has inside players with UNLIMITED CHIPS allocated betting against real people taking users deposits and user assets.
Imagine playing at a poker tournament yes the non Casino insider could win and take a prize but what about the other 97% of players? that's right you have lost everything. You're playing against market makers that see all your stops all your trades and have unlimited USDT to wick your money causing people to lose everything, all the excess Marketcap and profits they gain while actually converting the USD and spending it on real world assets, the only way for them to actually steal your original USD holdings is to make you lose their USDT they allocated you and multiple people at the same time. As dire as this sounds its ingenious.
---Final Warning---
Now Imagine this poker table has 10 million players who bought into the tournament for on average 10,000 USD each and got CHIPS (USDT) to play on the tables.
Now Imagine the situation we are currently in where people figure out the Merkle Tree is pointless and majority of user funds will evaporate the moment people try to find ways to redeem REAL USD, Its over.
This entire Phone app wallets, hardware wallets Ethereum USDT balance chain is irrelevant they have convinced you all to hold their CHIPS on every UNREGULATED point of access possible so you wonder why the SEC does not do anything with power? they don't have to this will blow up.

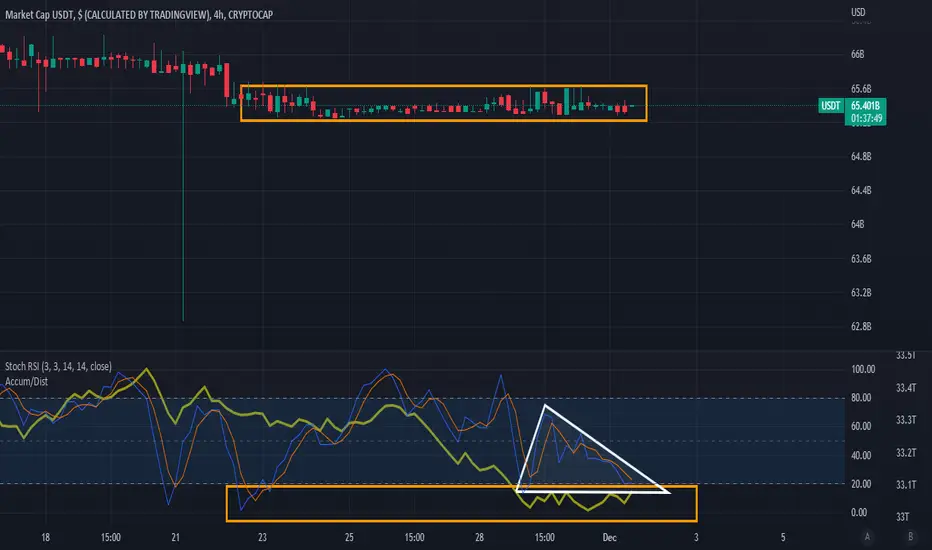
AD & Stoch RSI Bottom w/ desc. triangle breakout setupaccumulation, and anticipating a breakout in USDT... Also the RSI is in a Descending Triangle Pattern w/ the AD pending upward movement through it, which will confirm New Money (smart money) buying...
Crypto Market Risk ExposureThis layout is used to understand the level of risk exposure in the crypto market.
There are 3 data, in order from top to bottom:
1. USDT+USDC+DAI: Market Cap main stablecoins.
2. USDT.D+USDC.D+DAI.D: Dominance main stablecoins.
3. Bicoin/Dollar.
The data seen together makes us understand whether investors prefer to go risk-off or risk-on based on the divergence/convergence between the values of USDT.D+USDC.D+DAI.D and Bitcoin/Dollar. The more the two data diverge, the more investors take refuge in stablecoins, while the more the two data converge, the more investors buy BTC using stablecoins. As for the USDT+USDC+DAI data seen together with the other two, it serves to weigh the level of confidence in the crypto market during its phases, eg. the combination of flattening/reduction of the stablecoins market cap with the increase of their dominance makes us understand not only that investors are running away from BTC(and Alts) but also that they are making cash-out in FIAT, effectively removing ready liquidity on the market which will find it more difficult to recover in a short time(eg period from 2022-03-07 to 2022-07-12, historical record red candles on the W). Analyzing the last week instead we are seeing a change of direction, from divergence to convergence, the dominance of the stables has reached the peak and is now reversing heading towards the first support at 8.63%, while BTC is start climbing towards the resistance at 31.7k, in the meantime the market cap of the stables is continuing to fall in a first historical retracement, a sign that the market continues to lose ready liquidity to give a greater boost to BTC, also witnessed by the low trading volumes.

Temporary death for USDT!After a while I've been keeping my eyes on Cryptos and especially USDT, I found that its near to dump to trend line drawn.
Don't hold USDT and don't buy any crypto for now .It'd better change your stable coin or so.

Crypto Money FlowHello, because the blockchain is public we can see in real time when or if new money is flowing into crypto in the form of rising stablecoin marketcaps.
This is an important insight which would normaly only be visible to exchanges in classic fiat finance.
Without new money entering the market there wont be a sustained raise in crypto prices.
The graph shows the sum of the 4 biggest stablecoin marketcaps.
Currently money is leaving the crypto ecosystem which is confirming to me that the overall downtrend is not over.
I posted this as it could be useful for future analysis on money flows into/out of crypto and as a metric to watch for potential trades in the future.
Always dyor!
I think most of crypto is a pump and dump/Ponzi/scam/bubble and you should only invest money your 100% willing to loose!
Crypto is by far the most risky asset class, if you want to invest with serious money you better put that into lower risk ETF´s etc.!
At some point the bubble will burst, only question is when to me.

Stable coins vs Bitcoin - Breaking downStable coins marketcap have broken down the trendline vs BTC marketcap.
This is bullish for BTC!
Question is how low will we go?
Stable coins will always have a big part in crypto currency. But I'd rather we have less stables in the top 20 coins!

Interesting (usdt+usdc)/total vs. Bitcoin ChartIf Cash level broke the trend line and went lower, a big rally in cryptos is on the way.

🔥 Stable Coin Dominance Signaling Potential BottomIn todays analysis I want to focus on the stable coin dominance, which is calculated by the following formula:
(CRYPTOCAP:USDT+CRYPTOCAP:USDC)/CRYPTOCAP:TOTAL)
I'm only looking at USDT and USDC since they are the largest stables by far, and BUSD's marketcap is not available on Tradingview (afaik).
As seen on the chart, the stable coin dominance has been steadily rising over the last couple of years. This indicates that stables are, relatively, becoming a larger part of the total crypto market cap.
During this period, the stable coin dominance has been following a bullish channel. Every time the top of the channel has been hit (red), it coincided with a major bottom for BTC. Every time the bottom of the channel has been hit, it coincided with a major top for BTC.
With the stable coin dominance falling ever since it hit the top of the channel in June, a case can be made for the fact that BTC has bottomed and that we're only going up from here.
For the coming few weeks I'm still more bearish than bullish on crypto, but I still find it interesting to take a look at potential bottom indicators.

the dominance of stable coins to the market stagethe charts shows the dependence of dominance of stable coins and the stage of the market cycle

Tether is slowly going downThat is too suspicious. The market is Up, but the Tether is loosing his power. Be aware from this s*hit
