#Buy BitCoin#Buy BTCUSD
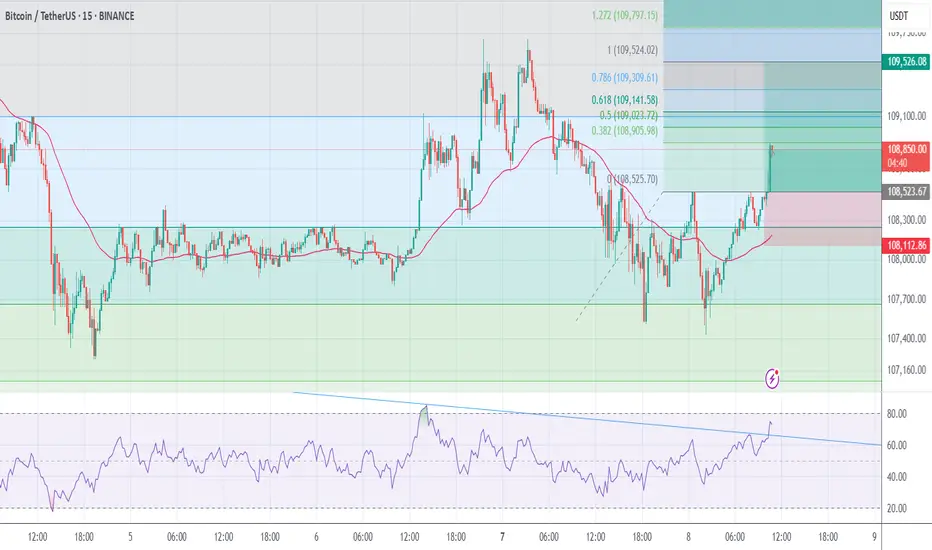
this trading system based on Divergency ans fibo
EntryPrice =108500
T.P= 109500
S.l=108100
USDTBTC trade ideas
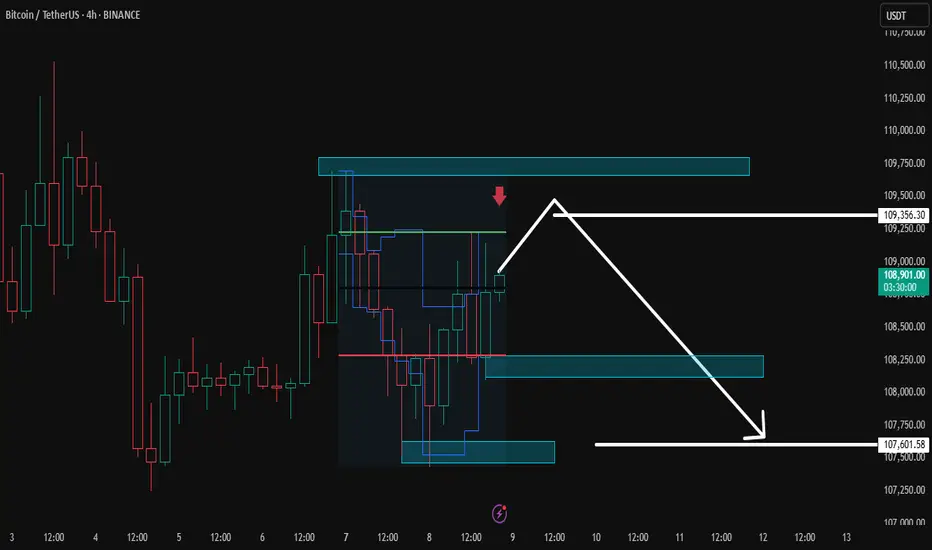
bitcoin targets...Based on the patterns and price movements in Bitcoin, I have identified possible targets in the image.
BTC-USDT Market Analysis for the Last 24 Hours
Hello, crypto enthusiast! 👋 Let’s see what has been happening with Bitcoin over the past 24 hours!
🔍 Price Action
Bitcoin dipped slightly during the day, sliding from ~108,970 USDT to a current price of about 108,166 USDT. That’s a decline of roughly 0.7 %—nothing too dramatic for the crypto market! 😉
📰 Hot News
• John Bollinger (renowned technical analyst) said that “Bitcoin is close to a breakout”; many analysts remain upbeat despite the small pullback.
• South Korea is seeing explosive crypto-market growth: total capitalization has topped $74.8 billion, and daily trading volume has reached $10.7 billion—higher than on the country’s two main stock exchanges!
• Fun fact: Korea’s well-known “kimchi premium” means crypto prices there can run about 10 % above global levels due to strong local demand. 🌶️
📊 Technical View
During the last 24 hours BTC traded between $107,393 and $109,048. Volumes were especially heavy from 21:00 to 22:00 on 7 July, when more than 100 million USDT changed hands.

BTC/USDT Technical Analysis, 2025-07-07 11:30 UTC📊 BTC/USDT Technical Analysis, 2025-07-07 11:30 UTC
🕒 Binance Spot
📆 July 7, 2025 | 11:30 GMT Candle Observations
───────────────
💡 Price: 108712.97 USDT
📉 EMA200 (Dynamic): 108938.31
🟩 Support Watch: 107512.97
🟦 Resistance Target: 109782.97
───────────────
🔍 We're observing price action developing below EMA200, with a recent Piercing Line formation at a noted dip zone. This setup may suggest buyers are attempting to reclaim short-term control.
⚠️ Key tactical support remains near 107512.97, where historical reaction zones and liquidity zones intersect.
📈 A move toward 109782.97 is being monitored as a potential resistance test, in line with local OBV divergence and recovering bid pressure.
📌 Market Microstructure Notes:
• Order Book Imbalance leaning toward bids (+0.45)
• OBV Trend: +10.17% vs 5-period MA
• Thunder Engine Volume Acceleration: ⚡ Observed
• Whale Ask Cluster: ~640k USDT near top of range
📉 No guarantees of breakout or reversal watching how price reacts around key levels. Maintain cautious positioning near support/resistance pivots.

How to Trade Smart Money Concepts (SMC)\ How to Trade Smart Money Concepts (SMC)\
\ This article explores the foundation, key tools, and practical insights of Smart Money Concepts — and why it’s worth your attention.\
In today's fast-changing financial landscape, Smart Money Concepts (SMC) has become a popular strategy among modern traders. But what is SMC exactly, and how can it improve your trading decisions? This article breaks it down in a simple, professional way for traders at all levels.
---
\ What Are Smart Money Concepts?\
SMC is a trading approach based on the belief that large institutions ("smart money") like banks and hedge funds control most of the market's movements. These institutions often move the market in ways that confuse or trap retail traders. The goal of SMC is to understand and follow the footsteps of these big players.
Instead of relying on simple patterns or indicators, SMC focuses on:
\ - Market structure\
\ - Supply and demand zones\
\ - Liquidity pools\
By aligning your trades with the behavior of smart money, you can position yourself more strategically in the market.
---
\ Key SMC Concepts Explained\
\ Order Blocks\
Order blocks are zones on the chart where large institutions have placed significant buy or sell orders. These zones often lead to strong price reactions and act as hidden support or resistance levels. Order blocks are considered more precise than traditional supply and demand areas.
Example: ()
\ Fair Value Gap (FVG)\
A Fair Value Gap occurs when price moves sharply in one direction, leaving a gap or imbalance in the price action. These areas often get filled later and can act as magnets for price.
In a bearish move, the FVG is the gap between the low of the previous candle and the high of the next one. In a bullish move, it's the reverse.
Example: ()
\ Timeframe Consideration\
If you can’t monitor charts during the day, avoid relying on 5–30 minute setups. Consider 4H or daily timeframes for clearer signals and more manageable trading decisions.
\ Liquidity\
Liquidity refers to price zones where lots of pending orders exist. These are usually at obvious highs, lows, or trendlines. Smart money often targets these areas to trigger stop-losses and generate movement.
One common tool to identify liquidity is a "pivot point," which is a candle with a lower low or higher high than its neighbors.
Example: ()
\ Break of Structure (BOS)\
BOS occurs when price breaks above or below a previous high or low, signaling a possible trend continuation.
Example: ()
\ Change of Character (ChoCH)\
ChoCH happens when the market changes direction. For example, if price breaks a higher low in an uptrend, it may signal a reversal.
Example: ()
Combined with BOS: ()
---
\ How SMC Compares to Wyckoff\
The idea of "smart money" isn't new. Richard D. Wyckoff, a pioneer in technical analysis, laid the foundation for understanding market cycles driven by institutions. His price cycle theory includes four phases:
\ 1. Accumulation\
Smart money buys while the public is unaware.
\ 2. Markup\
Price rises as smart money pushes the market.
\ 3. Distribution\
Smart money sells into public buying.
\ 4. Markdown\
Price falls as the cycle completes.
SMC borrows from this logic but focuses more on structure and liquidity zones. Still, the core idea is the same: understand what big players are doing, and follow them.
\ For deeper insights into Wyckoff, explore additional resources focused on accumulation/distribution cycles.\
---
\ Summary\
Smart Money Concepts give traders a deeper look into market mechanics. By focusing on order blocks, fair value gaps, liquidity, and structure breaks, SMC helps identify high-probability trade setups based on institutional behavior.
It may seem complex at first, but once you understand the basics, SMC can become a powerful tool in your trading strategy. Whether you’re new or experienced, aligning with smart money can improve your edge in the market.

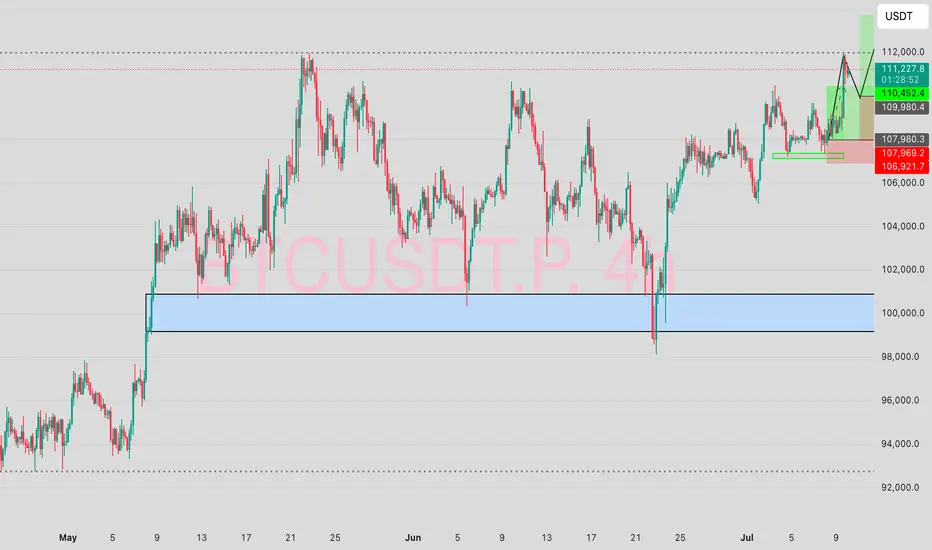
The Whale’s Blueprint: Read It Before It Happens🧠 The Real Game
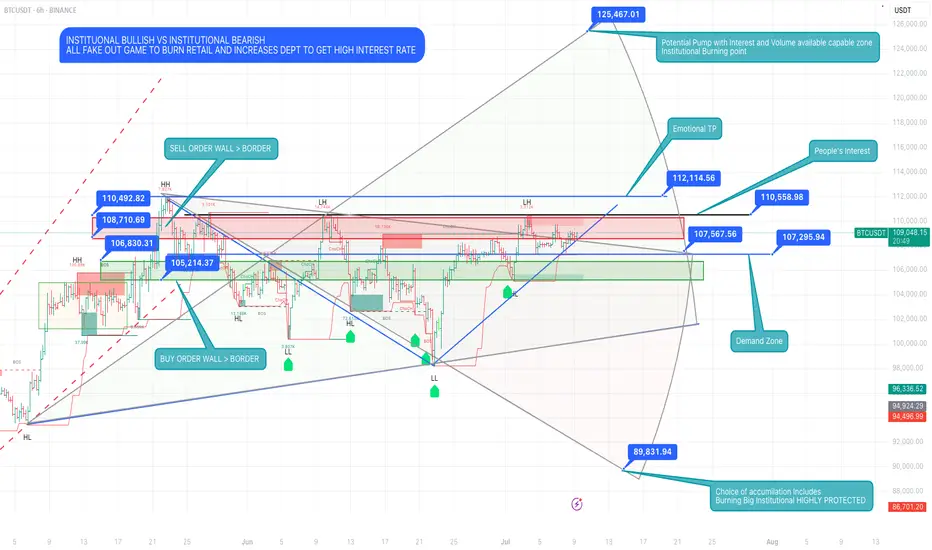
Institutional Bullish vs Institutional Bearish — It Was Never About Direction.
This chart isn’t about setups.
It’s a blueprint of manipulation, a battlefield map where:
• Retail gets trapped at emotional highs
• Liquidity gets swept in layers
• Institutions reload in silence
• And the price becomes the puppet, not the player
🔺 Top Red Zones (106K–112K):
These aren’t resistance. They’re execution zones for sell walls, fake breakouts, and late long liquidations.
🔻 Green Demand Zones (105K & Below):
Not support. They’re reaction chambers — where whales absorb panic and retail exits in fear.
💥 125K is not a fantasy. It’s a controlled explosion waiting to happen —
But only if the trap is set right and the fuel (volume + interest) loads in.
🧱 Real accumulation doesn’t happen in comfort.
It happens in the shadows, at the edges of fear.
This isn’t price action.
This is power action.
⸻
“Most trade the surface.
Snipers wait beneath it…
and strike before the story reveals itself.”
#BTCUSDT #LiquidityGame #WhaleTrap #InstitutionalZones #SniperMindset #KaizenMethod #TheRealGame
BITCOINAs of July 11, 2025, Bitcoin (BTC) is experiencing a strong bullish surge, reaching new all-time highs:
Current Price: Around $117,786 per BTC, up about 1.55% on the day, with an intraday high near $118,780.
Market Cap: Approximately $2.33 trillion, reflecting significant institutional and retail interest.
Trading Volume: High, with 24-hour volume exceeding $124 billion, indicating robust market activity.
Key Drivers Behind Today’s Bitcoin Rally:
New All-Time High: Bitcoin recently surpassed its previous record, hitting nearly $118,800, fueling bullish momentum.
Massive Short Squeeze: Over $1 billion in short positions were liquidated within 24 hours, including around $570 million in Bitcoin shorts, accelerating the price rally.
ETF Inflows: US spot Bitcoin ETFs have seen substantial inflows (around $50 billion this week), signaling strong institutional demand.
Technical Breakout: Technical indicators show a strong bullish trend, with Bitcoin targeting levels above $126-130K,
Macro Environment: The US dollar is weakening sharply (its worst performance since 1973), boosting risk assets like Bitcoin.
Growing Adoption: Corporate treasury purchases and positive regulatory developments in the US are enhancing investor confidence.
Market Sentiment and Outlook:
The Relative Strength Index (RSI) is above 70, indicating strong bullish momentum but also suggesting caution for a possible short-term pullback.
The number of Bitcoin wallets holding BTC has increased significantly, showing renewed accumulation by investors.
Technical Outlook Bullish, target $120K+
Bitcoin’s rally today is driven by a powerful combination of technical breakout, institutional buying, short squeeze dynamics, and supportive macroeconomic factors, making it one of the strongest moves in crypto markets this year.
#BTC #BITCOIN

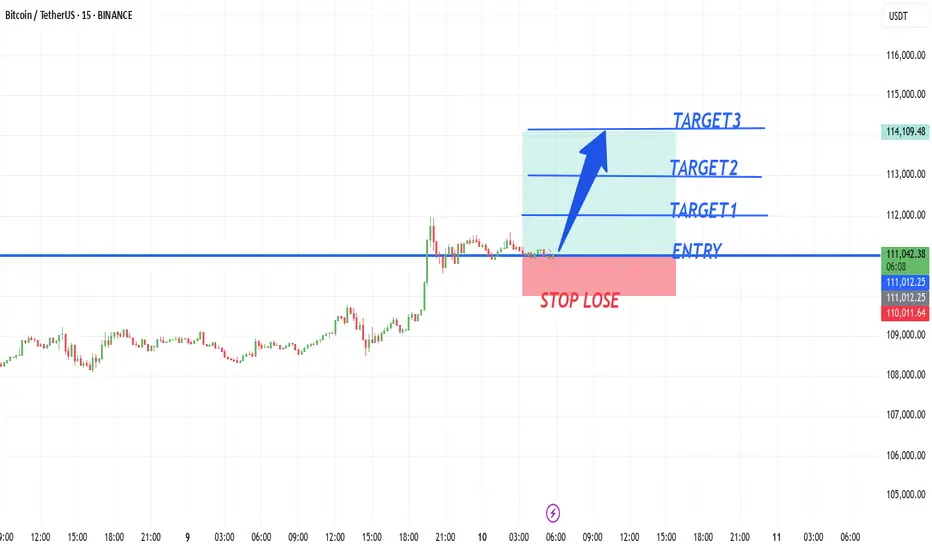
BTCUSD NEW LOOKBtcusd buy from 111,000,
target1 112,000
target2 113,000
target3 114,000
Stope lose 110,000
TRADE AT YOUR OWN RISK
Bitcoin ATHBINANCE:BTCUSDT This is amazing for crypto community because this level-up all of lover crypto currencies.
Next target: 120.000K
Best for pollback levels: 111.000K & 105.500K
👓We are this time keep calms emotional in buy or sell.

BITCOIN ATH? More to come!With BTC seeing a new ATH, speculations are there for whether it continues in upward projection or falls back.
My prediction is simple, CRYPTOCAP:BTC will do a temporary pullback around the 109,000$ region and goes back up to around 113,000$ within the shortest time.
This temporarily pullback will be a result of buyers who already took their profits. Of course, Institutional investors are even more poised to buying more.
News may impact this projection but investors are willing to see it fly.
Ultimately, you can never go wrong with Bitcoin buy.
#DYOR #NFA
A bearish 12 Month candle could be in the cardsBitcoin made an yearly high of 20% after 6 months in on the yearly candle
This does not make me feel great about the rest of the year
a clear sell signal would be an higher timeframe close under 100k after an upthrust to new ath around 110k - 120k
around 50k-54k for me is an good buy level to build an longterm position:
0.382 fib retracement for an primary 1-2 wave
0.500 fib retracement from the 25k low
0.886 fib retracement from 49k low
50% pullback from current high to projected low
where will bitcoin go ? i don't know, but i do know where i want to buy and when i want to sell

BTCUSDT | 30-min & 4H Outlook🔍 Structure & Price Action
BTC is trading within a rising wedge (blue lines) nearing apex — typical bearish setup.
Price is repeatedly getting rejected near macro trendline (~108.8K–109K).
30-min shows clean breakdown from lower wedge support, retesting the zone now.
On 4H, BTC is still under key resistance zone between 109.6K–110.4K, previously rejected twice.
🔻 Bearish Signals
Multiple Sell signals on both timeframes.
Bearish divergence visible in RSI and MACD on 4H.
Volume spike on the breakdown → confirming sellers in control.
🔑 Key Levels
Support: 107.7K (current zone) → loss opens path to 106.6K, then 104.4K.
Resistance: 108.9K–109.4K = confluence of EMA cluster + macro TL + Fib zone.
📊 Indicators (4H)
RSI dropping from mid-zone (~48), no bullish momentum
DMI shows increasing ADX with -DI over +DI → trend strengthening bearish
TSI & Wave Trend both curling down
Stochastic in overbought, starting to reverse
🎯 Summary
Bias: Bearish below 108.6K
Invalidation: Bullish breakout above 109.6K + volume close
Setup: Watch for retest and rejection at ~108.4K–108.6K = clean short trigger
Next Targets: 107.2K → 106.6K → 104.5K

$BTC - Much Higher or Much Lower. EoY '26I'm not gonna lie, I drew these lines with my balls. I use them to move my cursor on my computer monitor.
This is not financial advice. This is just how my deep gut instinct likes to draw brushstrokes.
I gave 4 optional trajectories.
These will likely not happen, nor is it likely that the Price Action and Valuation will stay within these lines.
Enjoy and Happy Trading!
Mr. Storm

Is Bitcoin Getting Ready to dump?
In this analysis, I looked at the weekly, daily, and 4-hour timeframes and found some key signals that suggest a major shift might be coming in Bitcoin’s movement over the next few days and weeks.
If you don’t want to get caught off guard by the next big move, make sure to watch the video all the way through!

Bitcoin: The night before the plunge? →104,000?
Bitcoin fell under pressure from highs, with short-term bearishness but strong long-term fundamental support.
1. Market fundamentals
Institutional holdings continue to grow
BlackRock Bitcoin ETF (IBIT) exceeds $72 billion in size, dominating the market
MicroStrategy holdings increased to 597,000 BTC (about $63 billion), continuing to increase holdings on dips
Global Bitcoin ETF Net inflow of $4 billion in June shows strong demand for institutional allocation
Policy and regulatory progress
The U.S. Treasury Department plans to include Bitcoin in the "strategic reserve assets" to enhance its legal status
The SEC will make a ruling on spot ETF option transactions on July 15, which may bring new liquidity
The Trump administration plans to impose a 60% tariff on China, and market risk aversion may heat up again
On-chain data changes
A 14-year dormant address recently transferred 80,009 BTC (about $8.69 billion), triggering concerns about selling
The lightning network capacity exceeded 5,000 BTC, and Tether (USDT) completed the lightning network integration
II. Technical depth Degree analysis
(1) Medium-term trend structure (4-hour level)
Rising channel break: After the price peaked at $112,000, it continued to fall below the rising trend line support
Range oscillation formation: Currently, $98,000-110,700 constitutes the main trading range, and the middle track support is $104,000
Volume change: The recent decline is accompanied by an increase in trading volume, indicating that the short-term momentum is increasing
(2) Short-term trading signals (1-hour level)
Double top pattern confirmation: $110,700 was tested twice without breaking, forming a typical reversal structure
Moving average system short arrangement: EMA5/10/30 formed a death cross, suppressing price rebound
Key support level:
▶ First support: $106,500 (Fibonacci 38.2%)
▶ Second support: $104,000 (psychological barrier + previous low)
▶ Strong support: $98,000 (lower track of the range)
III. Trading strategy suggestions
1. Aggressive short position layout
Entry range: $109,000-109,500
Stop loss setting: $111,000 (above the previous high)
Target: $106,500→$104,000
Technical basis: downward trend line suppression + RSI top divergence
2. Steady retracement of short positions
Entry signal: 108,000-108,500 rebound encountered resistance
Stop loss setting: $110,000 integer barrier
Target: $104,000 (break down to see 98,000)
3. Long defense area
Key observation position: 104,000 US dollars (if there is a large volume to stop the decline, you can try long with a light position)
Breakthrough signal: Stabilizing 110,700 US dollars will restart the upward trend
IV. Multi-dimensional market outlook
Short-term (1-2 weeks):
Affected by technical suppression and whale movements, it is expected to maintain 104,000-110,700 range fluctuations
Focus on the effectiveness of 106,500 support, breaking down will accelerate the test of the lower track of the range
Medium-term (Q3 quarter):
Institutional continued holdings + Fed rate cut expectations constitute long-term support
If it breaks through 112,000 US dollars, it will open up to 120,000-125,000 upside space
Risk warning:
The SEC option trading ruling on July 15 may cause violent fluctuations
Global macroeconomic data (especially CPI) will affect market risk preferences
V. Professional trading suggestions
▶ Currently, the "rebound short" strategy is preferred, and stop loss is strictly set
▶ Long-term investors can arrange in batches in the range of 98000-104000
▶ Pay close attention to:
Daily ETF fund flows, changes in on-chain whale addresses (glassnode alert system), US CPI data (released on July 12)
Conclusion: Although the short-term technical side is bearish, the long-term fundamental support of Bitcoin remains solid. It is recommended that traders seize the opportunity of range fluctuations, operate flexibly at key support/resistance levels, and wait for new trend signals to be confirmed.

BTC BEARISH IDEAL HOT BTC bullish ideal, BTC buys where Sensational and i dont expect the sell to be les either me and my whole theam eat let get it with BTC
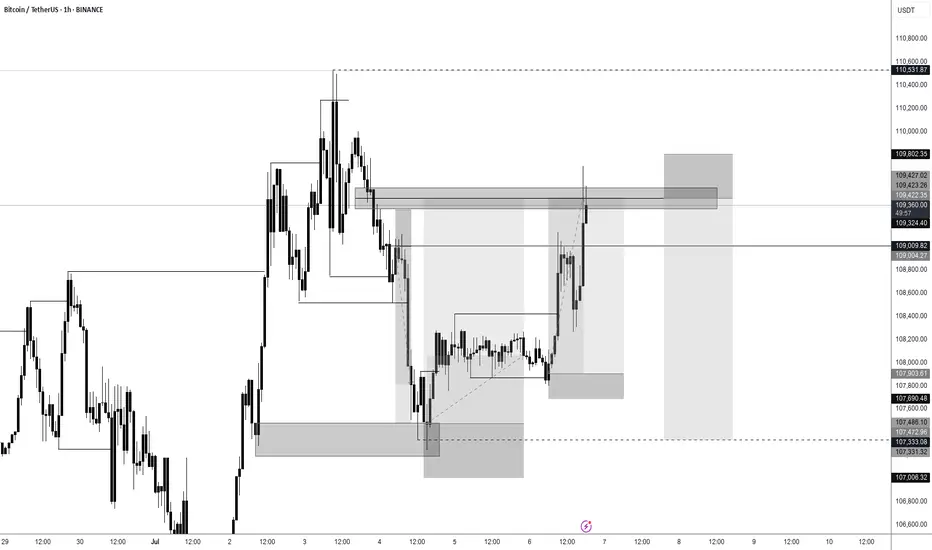
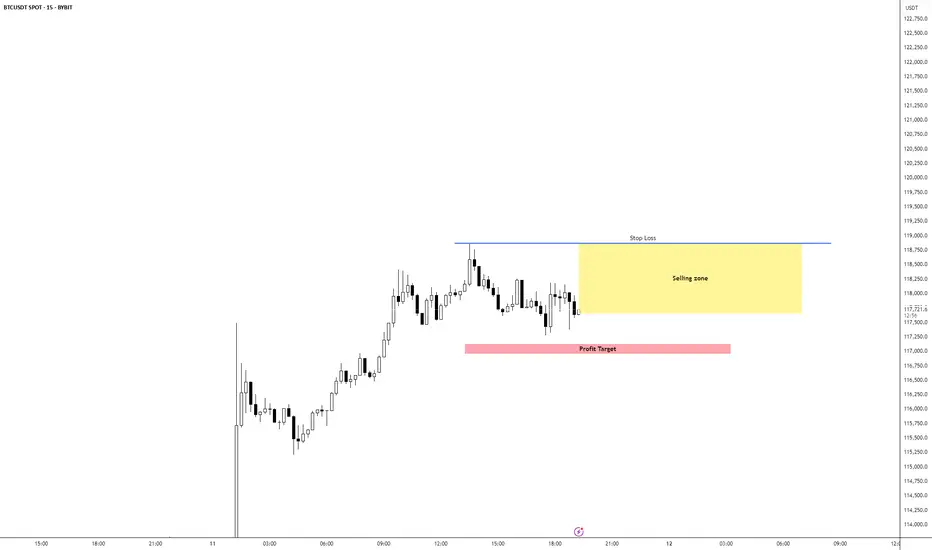
BTC/USD Short IdeaBTC/USD is currently bullish overall but seems overextended, Expecting a pullback to the 5m Equilibrium levels which would be our TP area. 1M has switched bearish adding confluence to our setup.
I would be layering short positions inside the yellow selling zone
BTCUSDTBitcoin came and made its move according to the FVG, which was in the $98,000 to $99,000 range, but considering the war that took place between Iran, the United States, and Israel and that affected the markets, I expected it to reach the $91,000 or even $85,000 area and then make a move, but considering the previous analysis and consolidation in the $109,000 area and the breakout of $110,000, it started its move and is expected to go up to $120,000 in the short term and up to $144,000 in the medium term.

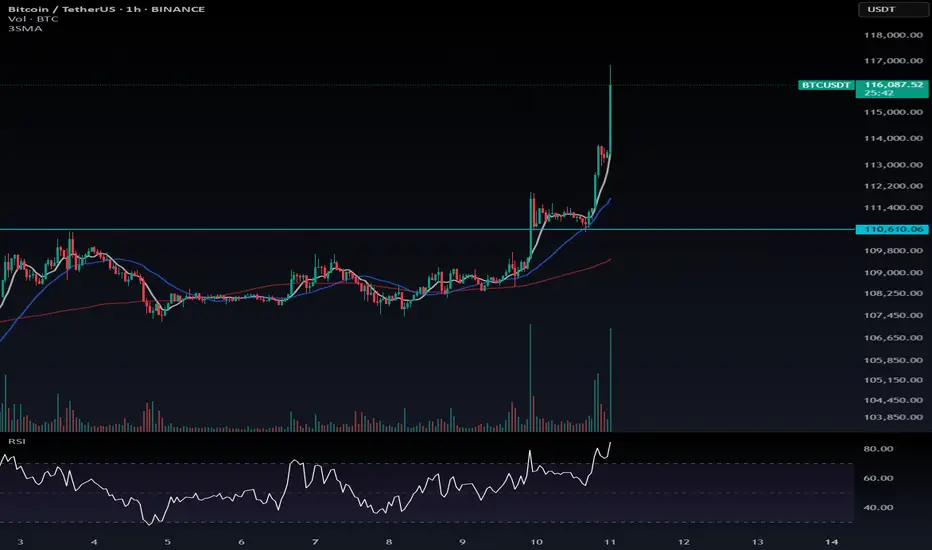
Hope you entered that long position!🚀 Hope you entered that long position!
I really tried to help you catch this move — and now it looks like Bitcoin has hit its first target.
If you want, you can take some profit here. But my suggestion? Hold that position with the mindset that some short-term profit might be missed, but the overall trend still looks strong.
📉 There’s a possibility of a minor pullback down to 110,610, even as a quick shadow — and then the upward move could continue.
📌 If you're holding altcoin positions, take profit on them. BTC dominance hasn’t dropped sharply yet, so alts are more likely to see pullbacks. Bitcoin still has more room to run in my view.
💬 Did you catch the trade?
🟢 In profit or waiting for higher targets?
Drop a comment 👇 Let's see how everyone's doing!
Bitcoin Breaks All-Time High: What’s Next?Bitcoin (BTC) has once again captured the world’s attention by smashing through its previous all-time high (ATH). This milestone has sparked excitement and speculation across the crypto community and beyond. But the key question remains: Will BTC continue its upward trajectory, or is a correction on the horizon?
Long-Term Outlook: The Bullish Case
In the long run, the fundamentals for Bitcoin remain strong. Several factors support a positive outlook:
Institutional Adoption: More institutional investors are entering the market, providing greater liquidity and legitimacy.
Scarcity and Halving Cycles: Bitcoin’s fixed supply and periodic halving events historically drive long-term price appreciation.
Macro Trends: Ongoing concerns about inflation and fiat currency devaluation continue to make BTC an attractive hedge.
Given these dynamics, we believe Bitcoin’s long-term trajectory remains upward.
Short-Term Caution: A Correction May Be Coming
While the long-term view is optimistic, the short-term picture may be less rosy:
Overheated Market Indicators: Rapid price surges often lead to overbought conditions, increasing the likelihood of a pullback.
Profit-Taking: After breaking ATH, some investors may lock in gains, adding selling pressure.
Technical Resistance: Historical patterns suggest that corrections often follow major breakouts.
We anticipate a potential correction, possibly pulling BTC back to the $90,000 range. This adjustment could unfold in the coming week or weeks as the market digests recent gains.
What Should Investors Do?
Stay Calm: Volatility is part of the crypto landscape. Corrections are healthy for sustainable growth.
Focus on Fundamentals: Remember why you invested in BTC in the first place.
Consider Dollar-Cost Averaging: Spreading out purchases can help mitigate the impact of short-term swings.
Conclusion
Bitcoin’s break above its all-time high is a testament to its enduring appeal and the growing confidence of investors. While a short-term correction may be likely, the long-term case for BTC remains compelling. As always, prudent risk management and a focus on fundamentals are key to navigating the exciting—and sometimes turbulent—world of crypto.
Do not consider it as investment advice.
#crypto #bitcoin #analysis

HolderStat┆BTCUSD fixed above the triangleBINANCE:BTCUSDT is rebounding from a consolidation base at $106,000 with strong bullish structure. The triangle breakout and recent higher lows point toward a move to $115,000–$120,000 if momentum continues.

BTCUSDT – Calm Before the BreakoutBitcoin is holding firmly above the ascending trendline, consolidating within the accumulation range of $98,000 to $117,000. The current structure suggests that buyers remain in control, especially after a strong rebound from the $98,450 support zone.
In terms of news, BTC has been slightly affected by market concerns over new U.S. tariffs. However, on-chain data still shows strong accumulation around the $108,000 level. If this base holds, BTCUSDT could break out toward the $117,424 target in the near term. Conversely, if the trendline fails, the $98,000 level will be the final stronghold for the bulls.

