BTC/USDT bullish with reverse head and shoulderBTC/USDT completed the reverse head and shoulder pattern.
It could be bullish by the pattern.
USDTBTC trade ideas

BTC - Are you the one who is long?If yes! Book, Looks like a LIQ hump trap here! Wait for 105k smooth, or let it fall to retrace up to 109,860 to initiate!

BitcoinHello everyone, I have a opinion about bitcoin chart I analyzed bitcoin chart at monthly timeframe and it obviously related to Elliot waves and I combined it with price action and I extract some good information about Price Road of bitcoin so in my opinion bitcoin going to decrease and I show that on chart how bitcoin price will be behave.
Have a good trade

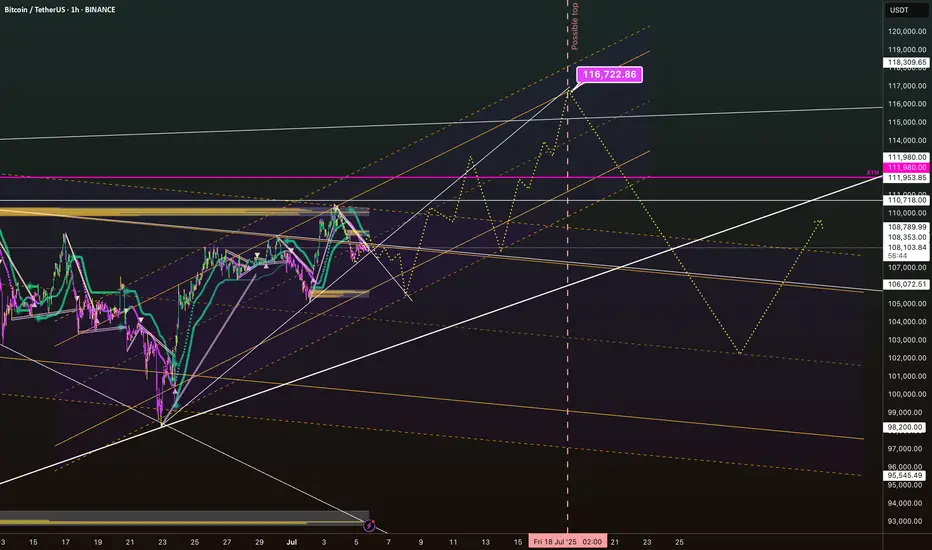
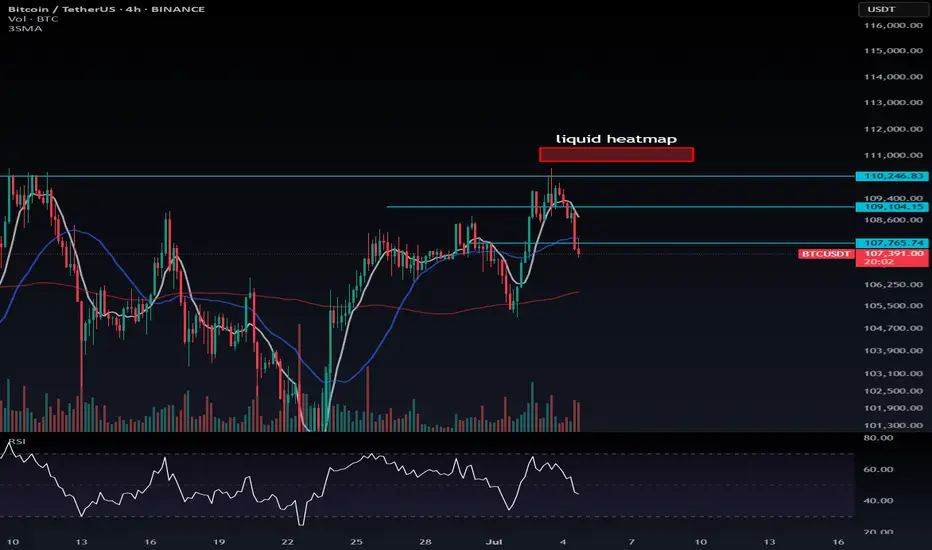
BTC/USDT July Outlook: Road to 116K or a Trap Below?The current structure shows Bitcoin consolidating after a strong bounce off the June lows. We’re now forming a potential bullish continuation pattern within a clear rising channel (dashed yellow lines), but the price is currently testing a mid-channel liquidity zone around $108,000–$110,000.
Key observations:
Local resistance zone: $111,980 (marked ATH) – a major liquidity magnet that could trigger a squeeze if broken. Support range: $106,000–$103,000 – strong confluence zone if price rejects current structure. Potential fakeout: Liquidity dip down to the $98,200–$95,500 zone is possible before a mid-July reversal (highlighted yellow path and vertical time marker on July 18).
Upside target: The upper channel boundary and projected fib confluence points to a bullish target of $116,722 by mid-to-late July.
Invalidations:
Sustained break below $95,000 could negate the bullish structure and push us into deeper correction territory.
Timing: The key date to watch is around July 18, where multiple structural lines and projection paths converge.
What’s your bias for July? Trap and rip… or stairway to 117K?
#Bitcoin #BTCUSDT #CryptoAnalysis #TradingView #LiquidityZones #BTCJulyOutlook
BTCUSDT: building up for a bigger pullback.As it stands, BTC is at a very important area. There's a first sign that the trend will change for the coming days and I expect the price to drop towards the 103k area.

Bullish on BTC Here is a clean, professional analysis of your BTCUSDT 1D chart:
---
1️⃣ Chart Context
Pair: BTCUSDT.P (Perpetual Futures)
Timeframe: Daily
Current Price: ~111,350
Chart Type: Breakout and projection mapping
Key Levels Marked:
Resistance zone: 134,989 – 140,087
Support trendline (yellow): Ascending from March low
Local horizontal support (yellow): ~104,000 region
---
2️⃣ Structure Analysis
🔹 Trend
BTC is in a strong uptrend with higher highs and higher lows since March 2025.
A breakout from a flag/pennant pattern has recently occurred, signaling continuation.
🔹 Support & Resistance
Current resistance zone (~111,000–113,000): Price is testing this zone.
Major resistance zone (134,989 – 140,087): Strong supply zone for future targets.
Trendline support: Acts as dynamic support, currently near 100,000, rising weekly.
---
3️⃣ Price Action
A clean breakout candle is seen above the consolidation.
Retest of breakout zone possible (~108,000 – 110,000) before continuation.
A measured move aligns with a potential target to 135,000–140,000.
---
4️⃣ Projection Plan
Based on my white projection arrow: ✅ Base scenario: Price breaks above the local consolidation cleanly and heads toward 135,000–140,000. ✅ Retest of the breakout zone may occur to grab liquidity before the push. ✅ If price closes above 113,000 on a daily, momentum confirmation for the run is strong.
5️⃣ Trade Plan (Not Financial Advice)
Entry: On breakout confirmation above 113,000 or retest near 108,000–110,000 with bullish confirmation.
Target: 134,989 and partial close, then 140,087 final target.
Stop Loss: Below local support (yellow line) near 104,000 or trendline depending on risk appetite.
Risk Management: Size positions to risk max 1–2% per trade.
6️⃣ Potential Risks
⚠️ Global macroeconomic conditions or sudden BTC volatility. ⚠️ Fake breakout wicks trapping longs above 113,000. ⚠️ Daily close below 104,000 would invalidate bullish structure in the near term.
Summary
BTCUSDT is in a bullish continuation structure aiming for 135–140K.
Price is currently at a critical breakout level; a clear close above and retest would be optimal.
Manage risks with clear invalidation below 104,000

Bitcoin: New highs are ready to break
In-depth analysis of the Bitcoin market: Breakthrough opportunities under the resonance of fundamentals and technical aspects
I. Overview of the current market situation
As of July 10, 2025, the price of Bitcoin is currently in a high consolidation stage after breaking through $112,000 to set a record high. The highest increase in 24 hours was 3%, and the cumulative increase this year was about 19%, showing a strong upward momentum2. However, market volatility is still significant. The latest data shows that the amount of liquidation in a single day is as high as $510 million, involving more than 100,000 traders2, reminding investors to maintain risk awareness in optimism.
II. Key drivers of fundamentals
1. Improved policy environment
US cryptocurrency regulation is turning to a loose direction. The regulatory roundtable promoted by the new SEC Chairman Paul Atkins is expected to implement new policies in July-August, aiming to define clear regulatory boundaries, reduce law enforcement actions, and promote the United States to become a global crypto asset center2. This policy shift has significantly boosted market confidence and removed some obstacles for institutional funds to enter the market.
2. Institutional funds continue to pour in
The net inflow of spot Bitcoin ETFs in 2025 has reached US$14.4 billion2, indicating that the traditional financial market's acceptance of Bitcoin continues to increase. 135 listed companies such as MicroStrategy have included Bitcoin in their balance sheets2, and corporate-level allocation demand has formed a stable buying support. The recent weaker-than-expected US employment data has strengthened the Fed's expectations of a rate cut in September, further prompting funds to accelerate the inflow of risky assets such as Bitcoin2.
3. Market narrative upgrade
The role of Bitcoin has shifted from "alternative currency" to "reserve asset", and CICC pointed out that its positioning as "digital gold" is widely accepted2. National-level allocation cases are also increasing, such as Pakistan's announcement of the establishment of a strategic Bitcoin reserve2. This narrative shift is reshaping the value assessment framework of Bitcoin.
4. Macroeconomic linkage
The Federal Reserve's monetary policy remains a key variable. Trump's chief adviser recently publicly accused Powell of being the "worst Federal Reserve chairman in history", saying that if interest rates are not cut on July 29, "catastrophic consequences"3 may occur3. At the same time, the US trade policy of imposing a 50% tariff on copper (to be implemented as early as August 1) has exacerbated market uncertainty3. Historical data shows that Bitcoin often performs well in liquidity easing cycles, and the current market's expectations for interest rate cuts are forming potential positives.
III. In-depth analysis of technical aspects
1. Key price structure
After breaking through the horizontal consolidation range, Bitcoin is currently in a high-level accumulation state:
Upper target: The historical high of $112,000 is the recent key psychological resistance, and a new upside space may be opened after breaking through2
Recent support: $110,700 (top and bottom conversion position) constitutes the first line of defense
Trend support: $109,700 (upward trend line) is an important line of defense for bulls
Key defense: There is significant liquidity support in the $108,500 area, and a break below may drop to the $106,000-107,200 support area26
2. Technical indicator signals
Trend indicators: Moving averages of all major time frames (5-day to 200-day) remain in a bullish arrangement, confirming that the overall upward trend remains unchanged4
Momentum indicators: RSI is in the neutral area near 53, not showing overbought; MACD remains positive despite slightly weakened momentum6
Volatility analysis: Bollinger Bands continue to narrow, and EMA on the 4-hour chart converges, which usually indicates that major fluctuations are coming5
Derivatives data: Binance CVD (cumulative volume increment) continues to be negative, indicating that selling pressure exists, but spot buyers successfully defend key support5
3. Main capital movement
The disk shows that $23 million of unfulfilled sell orders are piled up at the $110,000 mark, forming a significant resistance9. At the same time, there is a $17.27 million buy support in the $108,388-108,500 range9, indicating that the long and short sides are fiercely competing in the current area. This large order distribution pattern suggests that the market may test the upper resistance first and then fall back to consolidate.
IV. Operational strategy recommendations
1. Trend trading strategy
Long position layout: Establish long orders in batches in the support area of 110,700-109,700 US dollars, and set the stop loss below 108,500 US dollars
Breakthrough chasing long: If the price stands above 112,000 US dollars, you can add positions, and the target is 114,500 US dollars (potential area for short squeeze)2 and higher
Target setting: Short-term target is 112,000 US dollars, and the medium-term target can be seen to 116,000 US dollars2 or 137,000 US dollars4 according to the volume
2. Reversal trading strategy
Short opportunity: If it falls below $108,500 and then rebounds to $109,700 without breaking, you can try shorting with a light position, and set the stop loss above $110,700
Deep correction: If it falls below the $108,500 support, it may test the $106,000-107,200 area6, and then you can observe the stabilization signal
3. Risk management points
Position control: The risk of a single transaction should be controlled within 2% of the total funds
Leverage use: It is recommended not to exceed 3-5 times leverage in the current high volatility environment
Event sensitive period: Focus on key points such as the Federal Reserve’s interest rate decision on July 29 and the implementation of the tariff policy on August 137
V. Outlook and conclusion
1. Short-term (1-3 months) outlook
Bitcoin is currently in a favorable environment where technical and fundamental resonances occur. If ETF fund inflows continue or the Federal Reserve releases a clear signal of interest rate cuts, the price is expected to test $116,0002. However, we need to be alert that regulatory policies that fail to meet expectations or macroeconomic deterioration may lead to a pullback to the $102,000-105,000 support zone27.
2. Long-term (until 2030) value prospects
Cycle model: According to the peak rule of 550 days after halving, this round of bull market may have a 2-3 month peak window2
Technical target: Long-term rising channel points to $168,500 (Fibonacci extension level)2
Scarcity drive: After the halving in 2030, the supply will further shrink, coupled with the global inflation hedging demand, and the highest is expected to reach $660,4712
3. Summary of investment advice
Bitcoin's breakthrough of $112,000 is the comprehensive result of policy, liquidity and narrative upgrades2. The current technical structure remains bullish, and it is recommended to focus on low-multiple ideas, focusing on the $110,700-109,700 support area. Investors should pay attention to low-friction investment channels such as spot ETFs, avoid high leverage operations, and prepare for potential fluctuations. As the institutionalization process accelerates, Bitcoin is completing the transformation from a marginal asset to a mainstream configuration option. Long-term investors can seize the layout opportunities brought about by every major pullback.
BTC/USD SCENARIO Bitcoin is trying to break out of the 110,000
If we break out we will see a new high
If we don’t break it we could see 105k possibly 100k
(BTC/USDT).- Bitcoin (BTC/USDT) .
- Current price testing resistance at $110,489.
- Descending trendline indicates potential bearish pressure.
- Key support levels: $107,466, $105,000, $102,693.
- Potential upside target: $112,500 if resistance breaks.
- Potential downside target: $100,000 if support fails.

BITCOIN BITCOIN ,instead of forecasting the price movement, i will follow its price action,
break of the current supply roof on 3hr is a buy confirmation and target will be 115-117k and if we retest and fail to break the descending 3hr supply roof we are selling and target will be 94k (ema+sma ) strategy 4hr demand floor and aggressive sell will be around 90k zone .
NOTE ;everybody is a good trader ,but not everyone is patient enough to wait for a free trade.
trading is 100% educated probability ,don't take it personal.
focus on learning ,rather than how rich you want to become overnight.

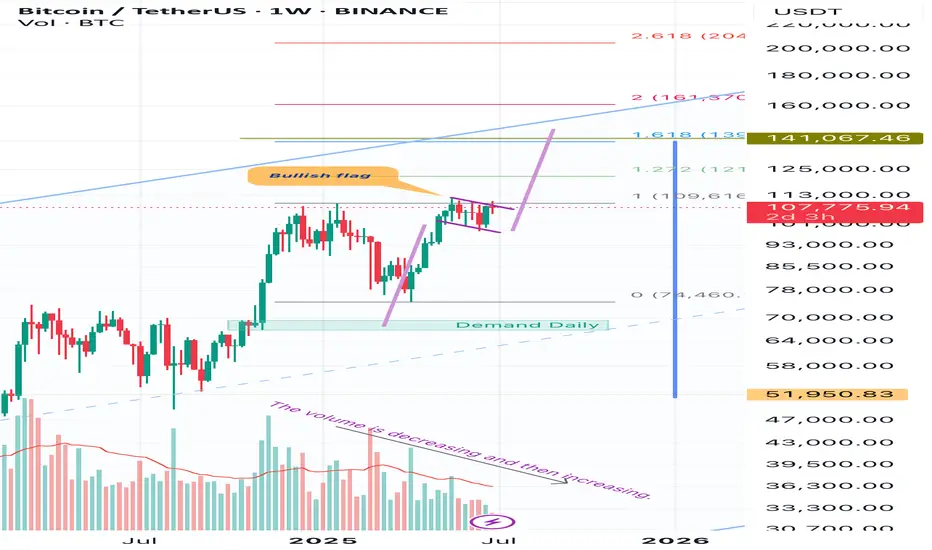
BtcusdtHello friends, in these important days of the markets, I wanted to share an analysis of Bitcoin with you. I think it is in a bullish flag and the target is 136,000 and within reach. It is 140,000. And I think that considering that the volume is decreasing, this indicates that with a sudden increase in volume, it will exit this bullish flag upwards with great intensity and speed.
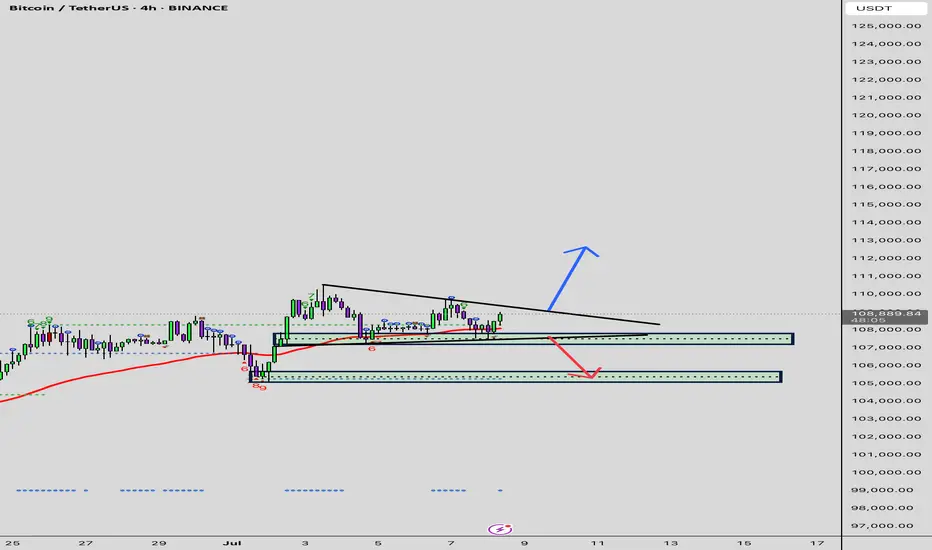
Bitcoin Technical Analysis – Key Supports in Focus🔥 Bitcoin Technical Analysis – Key Supports in Focus
Bitcoin (BTCUSDT) is currently going through a correction after its recent rally. All eyes are now on the $107,000 support level. If this zone holds, we might see a bullish bounce from here.
⚠️ However, if BTC loses this support, the next strong demand zone lies at $105,300 — a critical level to watch for any potential reversal.
📈 On the upside, if bulls take control and price rebounds, the first target would be $113,700, followed by $117,800 as the next major resistance.
🧠 Smart traders are watching these levels closely — don’t miss the next move.
🔔 Follow for more real-time insights, clean charts, and professional TA!
#BTC #Bitcoin #CryptoTrading #BTCUSDT #TechnicalAnalysis #TradingViewIdeas #SupportAndResistance

BTC Analysis (4H)This analysis is an update of the analysis you see in the "Related publications" section
Since the red arrow was placed on the chart, Bitcoin's bullish phase has ended and it has entered a corrective phase. This correction appears to be forming a Diametric pattern, and we are currently in the middle of wave E.
After interacting with the demand zone, the price may move toward the specified targets.
A daily candle closing below the invalidation level will invalidate this analysis.
For risk management, please don't forget stop loss and capital management
Comment if you have any questions
Thank You

BTC - Bullish retest to ATH?Made a composite profile of that little range we had last week.
We took out the lower npoc, then took out the higher npoc and the internal equal highs (which was the only short I see for now)
I'm looking for 107.2-3 to get a bullish reaction, long from there into a clean-up of the 112k highs.
If the July 2nd lows don't hold, I'd look for the 101k npoc, or maybe a frontrun of that at the imbalance fill around 103k.

Outside of the analysis🔔 The Awakening of Legendary Whales | 9 Transactions from 14-Year-Old Wallets! 🔔🕯
Today, the market witnessed a rare event:
Addresses that had been completely dormant since 2011 (back when BTC was under $2!) suddenly woke up — each moving 10,000 BTC, worth around $1 billion!
📌 Details of some transactions:
💸 10,000 BTC
💵 Approx. ~$1.08B
📤 From: A wallet inactive for 14.2 years
⌛️ Time: 18:15
💸 10,009 BTC
💵 Approx. ~$1.079B
📤 From: A similar address, slightly different amount
⌛️ Time: 18:32
🖥 Analysis:
This simultaneous awakening of multiple ancient wallets, along with the movement of BTC toward exchanges, suggests:
There might be a large-scale plan behind the scenes
Possible market play by first-generation whales
Or a project undergoing restructuring and asset redistribution
👀 Interesting fact: In 2011, these addresses were only worth around $34,000. Today? They're moving billions.
💎 When Bitcoin’s past wakes up, the future starts to tremble…
Bitcoin will Bearish conformed Structureon Thursday Bitcoin Price briefly reclaimed at 110K this morning as macro tailwinds and institutional flows lifted crypto but analysis say clear catalyst is still needed to break all time high after the long impulsive rally earlier in the year.
BTC has been trading with in descending channel on the daily time frame looking after the Long time price will needs break and catch there Support 105K Level if the price stays below more then could next zone formed 102K
You may find more details in the chart i need support from you Guys And feel free to share your thoughts other views in the comments.

BITCOIN BITCOIN ,instead of forecasting the price movement i will follow its action, it doesn't matter the direction ,am always right because i follow the direction.
break of the current supply roof on 3hr is a buy confirmation and target will be 115-117k and if we retest and fail to break the descending 3hr supply roof we are selling and target will be 94k (ema+sma ) 4hr demand floor and aggressive sell will be around 90k zone .
NOTE ;everybody is a good trader ,but not everyone is patient enough to wait for a free trade.
trading is 100% educated probability ,don't take it personal.

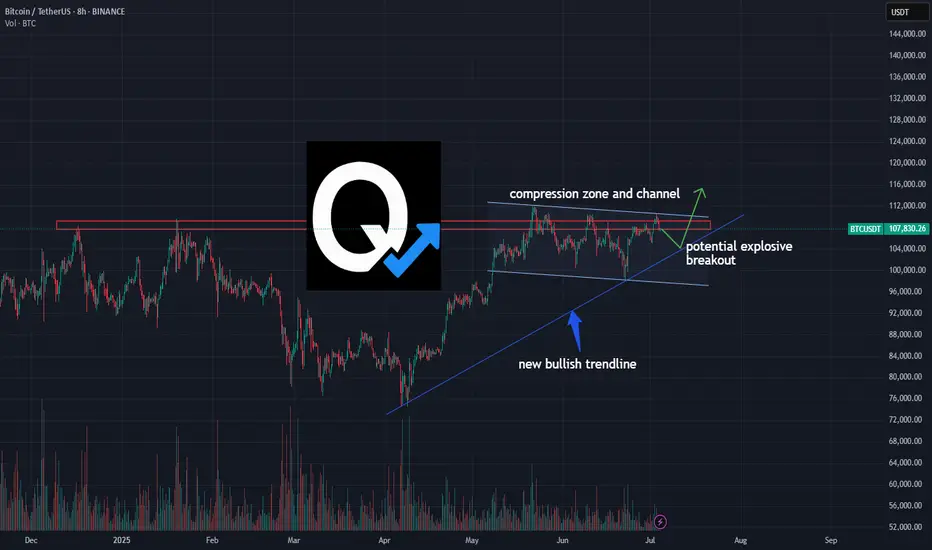
BTC/USDT – Compression Points to Potential Explosive BreakoutBitcoin is grinding into a major compression zone between horizontal resistance and a new bullish trendline. Volume is tightening, structure is intact, and the pressure is building.
This 8H chart highlights a classic breakout setup — a squeeze inside a channel, supported by an ascending trendline that has held clean since April.
🚀 A breakout above $110K could open up rapid upside continuation.
🧭 A retest of the trendline would offer a possible high-reward long entry.
📉 Breakdown invalidates the structure — watch $104K closely.
This is not financial advice — just a breakdown of what the chart is showing. Trade safe, think independently, and manage your risk.
#BTC #Bitcoin #CryptoTrading #BTCUSDT #TechnicalAnalysis #BreakoutSetup #CompressionZone #QuantTradingPro
Final move by the bears? Bulls lining up for ATHHi traders and investors!
Buyers have reached the first target at 108,952.
On Binance spot, BTC missed the second target (110,530.17) by just 99 cents.
Is this a setup for a breakout and a run toward a new ATH?
So far, the price action looks like a level manipulation around 108,952: volume in all 3 bars interacting with this level is concentrated above it.
Just below lies a buyer zone (107,500 – 105,100).
I am watching for buyer reaction once the price reaches this area.
This analysis is based on the Initiative Analysis concept (IA).
Wishing you profitable trades!

BITCOINTHE pullback into structure will be watched ,if the daily candle gets rejects on the daily trendline, then the buy holds .if they fail then the daily cross supply roof will send price tanking
the price action is playing a quick one ,technically i wasn't expecting a break of 4hr demand descending trendline line acting as support floor. patience is key, allow the daily candle to close for clear directional bias..
the uptrend future will lie on daily candle close and the weekly candle close will be the final verdict.
trading is 100% educated probability, so don't take personal, even when your analysis are wrong ,accept it and try again.
overall, resilience and consistency are what will distinguish you from other traders.
do have a happy blessed weekend.
we coming new week on money and winnings .
#btc #bitcoin #gold #silver #copper

Understanding SFP In Trading1. What is a Swing Failure Pattern (SFP)?
A Swing Failure Pattern (SFP) occurs when the price temporarily breaks a key swing high or low but fails to continue in that direction, leading to a sharp reversal.
This pattern is often driven by liquidity grabs, where price manipulates traders into taking positions before reversing against them.
An SFP typically consists of:
A false breakout beyond a previous swing high/low.
A sharp rejection back within the prior range.
A liquidity grab, triggering stop-loss orders and fueling a reversal.
SFPs provide powerful trade opportunities, signaling potential reversals and the exhaustion of trends.
2. Understanding Liquidity Grabs & Stop Hunts
The financial markets are structured around liquidity. Large institutions and algorithmic traders require liquidity to execute their large orders efficiently.
One way they achieve this is by triggering liquidity grabs and stop hunts.
Liquidity Grab:
Occurs when price moves beyond a key level (e.g., swing high/low), activating orders from breakout traders and stop-losses of trapped traders.
Smart money absorbs this liquidity before pushing the price in the opposite direction.
Stop Hunt:
A deliberate price movement designed to trigger stop-loss orders of retail traders before reversing.
Often seen near major support and resistance levels.
These events are crucial for understanding SFPs because they explain why false breakouts occur before significant reversals.
3. Why Smart Money Uses SFPs
Institutions, market makers, and algorithmic traders use SFPs to:
Fill large orders: By grabbing liquidity at key levels, they ensure they can enter large positions without causing excessive price slippage.
Manipulate retail traders: Many retail traders place stop-losses at obvious swing points. Smart money exploits this by pushing the price beyond these levels before reversing.
Create optimal trade entries: SFPs often align with high-probability reversal zones, allowing smart money to enter positions at better prices.
Understanding how institutions operate gives traders an edge in identifying manipulative moves before major price reversals.
4. Market Structure & SFPs
Market structure is built upon a series of swing highs and swing lows. Identifying these key points is crucial because they represent areas where liquidity accumulates and where price is likely to react.
Swing High (SH): A peak where price makes a temporary high before reversing downward.
Swing Low (SL): A trough where price makes a temporary low before reversing upward.
Types of Swing Points in Market Structure
Higher Highs (HH) & Higher Lows (HL) – Bullish Trend
Lower Highs (LH) & Lower Lows (LL) – Bearish Trend
Equal Highs & Equal Lows – Range-Bound Market
5. Liquidity Pools: Where Traders Get Trapped
Liquidity pools refer to areas where traders' stop-loss orders, pending orders, and breakout entries accumulate. Smart money uses these liquidity zones to execute large orders.
Common Liquidity Pool Zones:
Above swing highs: Retail traders place breakout buy orders and stop-losses here.
Below swing lows: Stop-losses of long positions and breakout sell orders accumulate.
Trendline & Range Liquidity:
Multiple touches of a trendline encourage traders to enter positions based on trendline support/resistance.
Smart money may engineer a fake breakout before reversing price.
6. Identifying Bullish SFPs
SFPs can occur in both bullish and bearish market conditions. The key is to identify when a liquidity grab has occurred and whether the rejection is strong enough to confirm a reversal.
Bullish SFP (Swing Low Failure in a Downtrend)
Price sweeps a key low, triggering stop-losses of long traders.
A strong rejection wick forms, pushing price back above the previous low.
A shift in order flow (bullish market structure) confirms a potential reversal.
Traders look for bullish confirmation, such as a higher low forming after the SFP.
Best bullish SFP setups occur:
At strong support levels
Below previous swing lows with high liquidity
After a liquidity grab with momentum confirmation
7. Identifying Bearish SFPs
Bearish SFP (Swing High Failure in an Uptrend)
Price takes out a key high, triggering stop-losses of short traders.
A sharp rejection forms, pushing the price back below the previous high.
A bearish shift in order flow confirms downside continuation.
Traders look for bearish confirmation, such as a lower high forming after the SFP.
Best bearish SFP setups occur:
At strong resistance levels
Above previous swing highs where liquidity is concentrated
With clear rejection wicks and momentum shift
8. How SFPs Signal Reversals
SFPs provide early warning signs of trend reversals because they expose areas where liquidity has been exhausted.
Once liquidity is taken and the price fails to continue in that direction, it often results in a strong reversal.
Key Signs of a Strong SFP Reversal
Long wick rejection (indicating absorption of liquidity).
Close back inside the previous range (invalidating the breakout).
Increased volume on the rejection candle (confirming institutional activity).
Break of short-term market structure (trend shifting).
Divergences with indicators (e.g., RSI divergence at the SFP).
9. Identifying High-Probability SFPs
One of the most critical aspects of a valid SFP is how the price reacts after a liquidity grab. The candle’s wick and close determine whether an SFP is strong or weak.
A. Wick Rejections & Candle Closes
Key Features of a Strong SFP Wick Rejection
Long wick beyond a key swing high/low (indicating a liquidity grab).
Candle closes back inside the previous range (invalidating the breakout).
Engulfing or pin bar-like structure (showing aggressive rejection).
Minimal body size relative to wick length (e.g., wick is 2–3x the body).
Bullish SFP (Swing Low Failure)
Price sweeps below a key low, triggering stop-losses of buyers.
A long wick forms below the low, but the candle closes back above the level.
This signals that smart money absorbed liquidity and rejected lower prices.
Best bullish SFPs occur at major support zones, previous swing lows, or untested demand areas.
Bearish SFP (Swing High Failure)
Price sweeps above a key high, triggering stop-losses of short sellers.
A long wick forms above the high, but the candle closes back inside the range.
This signals that smart money absorbed liquidity and rejected higher prices.
Best bearish SFPs occur at resistance levels, previous swing highs, or untested supply areas.
❌ Weak SFPs (Avoid These)
❌ Wick is too small, meaning the liquidity grab wasn’t significant.
❌ Candle closes above the swing high (for a bearish SFP) or below the swing low (for a bullish SFP).
❌ Lack of strong momentum after rejection.
B. Volume Confirmation in SFPs
Volume plays a crucial role in validating an SFP. Institutional traders execute large orders during liquidity grabs, which often results in spikes in trading volume.
How to Use Volume for SFP Confirmation
High volume on the rejection wick → Indicates smart money absorption.
Low volume on the breakout move → Suggests a lack of real buying/selling pressure.
Increasing volume after rejection → Confirms a strong reversal.
Spotting Fake SFPs Using Volume
If volume is high on the breakout but low on the rejection wick, the move may continue trending rather than reversing.
If volume remains low overall, it suggests weak market participation and a higher chance of chop or consolidation instead of a clean reversal.
Best tools for volume analysis:
Volume Profile (VPVR)
Relative Volume (RVOL)
Footprint Charts
10. Key Takeaways
SFPs are Liquidity Grabs – Price temporarily breaks a key high/low, triggers stop losses, and then reverses, signaling smart money absorption.
Wick Rejection & Close Matter – A strong SFP has a long wick beyond a swing point but closes back inside the range, invalidating the breakout.
Volume Confirms Validity – High volume on rejection wicks indicates smart money involvement, while low-volume breakouts often fail.
Higher Timeframes = Stronger SFPs – 1H, 4H, and Daily SFPs are more reliable than lower timeframe setups, reducing false signals.
Confluence Increases Probability – SFPs are most effective when aligned with order blocks, imbalances (FVGs), and major liquidity zones.
Optimal Entry Methods Vary – Aggressive entries capitalize on immediate rejection, while confirmation and retracement entries improve accuracy.
Proper Stop Loss Placement Prevents Fakeouts – Placing SL just beyond the rejection wick or using structure-based stops reduces premature exits.
Take Profit at Key Liquidity Levels – Secure profits at previous swing highs/lows, order blocks, or imbalance zones to maximize returns.

BTCUSDTBitcoin has two paths: if it stabilizes above 111,800, it can go to the target of 144,540, but if this move is a fake break, it can go to the targets of 91,410 and even 85,662, but it is expected to fall and then move.

BTC vs DXY – Macro Setup at a Crossroads
Looking at BTC and DXY on the weekly, we’ve seen 3 key periods so far. In the first two, the pattern was clear: BTC went up, DXY went down.
Now we’re in the third period: what’s next?
👉 Has the move already played out?
👉 Is it happening now?
👉 Has DXY bottomed and BTC topped, or will DXY go lower while BTC climbs?
Macro conditions may help guide us.
BTC looks strong — supported by ETF inflows, on-chain strength, and institutional demand.
DXY looks weak — with softer economic data and rising expectations for rate cuts.
In my view, tariffs are likely to weigh heavier on DXY than BTC, favoring more upside for BTC.
The recent Big Beautiful Bill could also add fuel to BTC while adding pressure on DXY.
Always take profits and manage risk.
Interaction is welcome.
