BTC weekly price predictionthis is my personal idea and analysis and i dont follow any other one analysis
USDTBTC trade ideas

BTC Weekly Analysis : Rise or Fall ? Let's SeeBy analyzing the #Bitcoin chart on the weekly timeframe, we can see that last week’s candle closed at $108,350, and BTC is currently trading around $107,500. If the price manages to hold above $105,700, we could expect further upside momentum. The next potential bullish targets are $111,700, $124,000, and $131,800.
So far, this analysis has yielded over 9% return, and we’ll be sharing more updates soon from lower timeframes!
🎥 If you enjoyed this video analysis and found it helpful, please show your support with a LIKE and COMMENT below!
These video-style breakdowns take time and effort, and I’ll only continue them with your support 🙌
Your engagement is my biggest motivation to keep going 💛
Thanks for being part of the journey!

BITCOIN FLASHING EARLY BEARISH SIGNALS!!! (Don’t get trapped) I am explaining why Bitcoin might start crashing towards $93k. If we get enough confirmations, amazing RR short opportunities might be great money-making machines !!!

Check if price can hold above M-Signal indicator on 1D chart
Hello, traders.
If you "Follow", you can always get new information quickly.
Have a nice day today.
-------------------------------------
I failed to register a modified indicator of StochRSI indicator on TradingView alone, so I added it to the existing OBV by readCrypto indicator.
From the top of the indicator setting window to the bottom
1. OBV indicator of Low Line ~ High Line channel
2. PVT-MACD oscillator indicator
3. StochRSI indicator
They are registered in the order above.
Since the values used are all different, you should activate and use one indicator.
Please check the chart above.
------------------------------------------
(BTCUSDT 1D chart)
It is showing a downward trend as it failed to rise above the HA-High indicator (108316.90) on the 1D chart.
It is currently checking whether there is support near 107340.58, which is the StochRSI 50 indicator point.
If it fails to receive support and falls, it is expected to fall to around 104463.99.
The 104463.99 point is the DOM (60) indicator point of the 1W chart, which corresponds to the end of the high point on the 1W chart.
Since the StochRSI 20 indicator point is formed near the 104463.99 point, its importance can be considered high.
-
Since the M-Signal indicator of the 1D chart is passing near 106133.74, there is a possibility of volatility when touching this area.
Since the volatility period begins around July 2 (July 1-3), it is necessary to keep an eye on the current movement.
-
However, the key is to buy near the HA-Low indicator and sell near the HA-High indicator, so the current movement may be natural.
This volatility period is expected to last until around July 10 (July 9-11), so be careful when trading to avoid being fooled by fakes.
----------------------------------------
- The StochRSI indicator is showing signs of transitioning to a state where K < D.
- The PVT-MACD oscillator indicator is showing signs of decline.
- The OBV indicator of the Low Line ~ High Line channel is showing signs of decline in the High Line.
Therefore, if you look at the indicators, they are showing signs of decline overall.
However, if the OBV rises above the High Line, the price will show signs of rise.
Therefore, we need to observe the movements of the indicators while checking whether there is support at the StochRSI 50 indicator point.
Basically, the time to make a purchase is when it shows support near the DOM (-60) ~ HA-Low indicator.
If you want to make a purchase outside of that, you should not forget that a short and quick response is required.
The indicators that tell you the high point are HA-High, DOM(60) indicators.
In addition, there are StochRSI 80 and StochRSI 20 indicators that require quick response.
-
Thank you for reading to the end.
I wish you successful trading.
--------------------------------------------------
- Here is an explanation of the big picture.
(3-year bull market, 1-year bear market pattern)
I will explain the details again when the bear market starts.
------------------------------------------------------

BTCUSDT: Trend in 2H time frameThe color levels are very accurate levels of support and resistance in different time frames.
A strong move requires a correction to major support and we have to wait for their reaction in these areas.
So, Please pay special attention to the very accurate trend, colored levels, and you must know that SETUP is very sensitive.
BEST,
MT

BTC/USDT 4H – High-Probability Decision Point Ahead Bitcoin is currently retesting a confluence-rich zone — a textbook decision area where structure meets sentiment.
🔻 What’s in play?
🟥 Demand Zone / Bullish Order Block / Breaker Block (visible on 1H)
📈 Third-touch test of the ascending trendline – statistically known to trigger strong moves
⚪ Price sitting just above the 200 EMA acting as dynamic support
🧱 Prior resistance flipped to support — now being validated again
Despite the correction, structure remains intact. This is a healthy retracement unless price starts closing below trendline + zone with volume.
🔀 Possible Outcomes:
Bounce: If buyers step in here, this could mark the next leg in the uptrend.
Breakdown: A strong close below the zone/trendline could shift structure and sentiment bearish.
⚠️ No trade bias here — let price show its hand.
💬 What’s your view — bounce or break? Comment below!
✍️ Chart marked with structure logic only — not financial advice.

BITCOIN → Pause for consolidation before growth. 115K?BINANCE:BTCUSDT focus on the structure on D1. The market is forming local resistance and consolidation after growth. The fundamental background is positive. BTC is following the SP500
The market is recovering in line with the stock market (SP500, NQ) after the de-escalation of the situation in the Middle East. The fall in the DXY is also providing support.
Technically, the focus is on the consolidation phase after the distribution triggered by a false breakout of 100K. The price stopped before the resistance at 108100 and rolled back to 106500, confirming the boundaries of the local trading range, the essence of which is a pause for a breather before a possible continuation of growth. The structure on D1 is compression towards resistance. The trigger is 108100, and a breakout of this level could trigger distribution towards 110500 and ATH.
Despite the fact that the market is under a cascade of resistance (resistance: 108100, 110400, 11900 (ATH)), an important nuance is that after strong growth, the price moved into accumulation in the 100K-110K range on D1-W1, and there are no reasons for a decline yet.
Resistance levels: 108100, 108900, 110400
Support levels: 106500, 104650
If the market structure within 106500 - 108100 remains unchanged and BTC continues to storm the consolidation resistance in the “compression to level” format and stick to the level, the chances of a breakout will increase. I do not rule out the possibility of a pullback to 106500, 105650 before a possible rise to ATH.
Best regards, R. Linda!

Bitcoin ready to move towards 85,000When a trend line is broken, it suffers for a few days and then moves
Tp1:85000
To2:80000
2p3:63000

The only plays you need this week! 🚀 Join us as we dive into the highs and lows of Bitcoin this week! 🔥
Opportunities like this don’t show up every day — and we’ve got a strong feeling there’s a 10X trade hiding somewhere in this video! 👀💰
We’re locked in on the charts like eagles 🦅, watching closely to see if any of our setups come to life. You won’t want to miss what’s coming next! 📈📊
✨ Stay tuned for daily updates, smart setups, and sharp moves! ✨
📅 Weekly Schedule:
🛠️ Daily Setups: Monday to Friday
🎓 Class: Every Tuesday (if stars align 🌟 – subject to confirmation)
Let’s make it a big week! 💪🚀

Bitcoin BTC price analysis BTC.D and events calendar for JulyToday is the last day of the month and the last day of the second quarter, so there may be some volatility in the markets between 🐂 VS 🐻
💰 The CRYPTOCAP:BTC chart shows an interesting picture — the price has reached the upper limit of the consolidation channel, and now:
1️⃣ The scenario with an upward breakout is quite clear: a breakout from the channel upward and consolidation above $108-110k= a move to $125k during July.
2️⃣ A correction to $99k will mean that buyers have taken control of the OKX:BTCUSDT price, preventing it from updating its lows. This will be a clear signal to buy, because further growth is inevitable.
3️⃣ A deep correction to $91,660 (filling the GAP that formed on the CME BTC chart) or slightly lower. This is the last “unclosed” GAP, which, according to TA rules, should be filled for a full-fledged growth trend to begin.
So which scenario is closer to your heart, which one do you believe in?
Or write your version of events in the comments.
Interesting observations to think about:
◆ Over the past two weeks, the inflow of funds to #BTCETF has exceeded $5 billion, but the price of #BTCUSD on CEX exchanges has not been able to “break out” upward. Is this just ETF "property of numbers", or are spot #Bitcoin sales that strong?
◆ The BTC.D indicator has reached a critical level of 66%, and it will be interesting to see whether it will give altcoins some breathing room next month.
(If there are a lot of likes and comments under the idea, we will additionally describe our thoughts on BTC.D and USDT.D.)
◆ SP 500, by the way, has updated its highs, and the last few months on the stock market are very similar to the beginning and middle of the COVID-19 pandemic in 2020.
◆ And in principle, July promises to be very eventful:
👉 By July 9, Trump is expected to make a statement regarding the tariff wars with the rest of the world, which he has put on hold.
👉 July 18 marks the beginning of Mercury retrograde, which “influences” people's behavior and ‘superstitions’ and forces them to be “more cautious” when making trading decisions (and trading bots don't care about emotions and beliefs)
👉 And on July 30, there will be a FOMC meeting, where Mr. Powell may announce a rate cut, as the US is in a recession, which is time to acknowledge.
If we have forgotten anything, please add it in the comments!

Short BTC, it is about to retrace and test 100000 again!As BTC gradually fell back, the rebound did not stand above 110,000 in the short term, proving that there is strong selling pressure above, and the trend line formed by the technical high point 111,000 and the second high point 110,000 formed an important resistance area, which limited the rebound space of BTC and strengthened the demand for BTC's short-term retracement.
According to the current trend, the short-term oscillation bottom area of 106,000 may be broken at any time. Once it falls below the oscillation area, it may arouse a certain degree of profit-taking chips and stimulate BTC to accelerate its decline. I think BTC will at least test the 105,000-104,000 area again during the retracement, and may even test the 100,000 integer mark again.
Therefore, shorting BTC is still the preferred option for current short-term trading.
Consider shorting BTC in the 108,000-109,000 area, and the target area in the short term is 104,500-103,500. After breaking this area, the target can be extended to 101,000-100,000.
BINANCE:BTCUSDT BINANCE:BTCUSDT BITSTAMP:BTCUSD

Bitcoin Playing Below The Crucial Area, Im Out of The Market🥱 I’ve been active in this market since 2017, and I’ve never seen it this dull and exhausting.
👉 Bitcoin has been ranging around the $110K level for nearly six months now, and once again, it’s trading below a critical resistance level. In my opinion, staying out of the market and just observing is still the best approach.
📥 Trading in such market conditions can be mentally draining, which is why I prefer to stay on the sidelines and simply watch for now
📉 Any rejection from this area could lead to a price drop down to the 95K zone. Although there’s a possibility of a buying pressure up to the 115K level as a shadow, even if this scenario plays out, it won’t change my overall outlook on Bitcoin

MONDAY - TRADE OF THE DAYFew nice plays over the weekend shame I am not active on weekends.
I will be posting a video later today so see you in class!

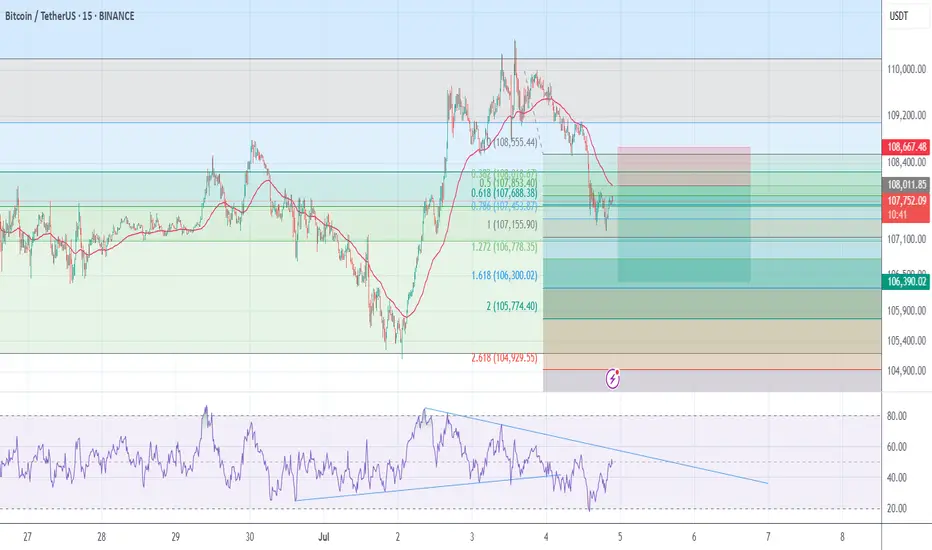
#Sell Bitcoinmy trading system is based on divergency and fibo.
#Sell Bitcoin
entry price = 108000$
T.P = 106400 $
S.l = 108700 $
RR = 2.5
BTC — Major Resistance & Long TP Zone1. TP longs in red resistance zone (110k–111k)
2. Watch for rejection: possible short setup on bearish reaction
3. Key support at 105k — monitor for bounce
4. If price holds above red zone, scenario invalid — look for breakout

Bitcoin Overall: Likely Short to SupportI think bitcoin will likely find resistance at the current range, or slightly higher, and move down in a stepwise fashion to the indicated supports in the near future.

Bitcoin at a Crossroadshello guys!
In the current 1D chart of BTCUSDT, a Head & Shoulders pattern has formed, suggesting potential for significant price movement in the near term. The structure includes a defined left shoulder, head, and right shoulder, with a descending trendline acting as a critical resistance level.
🔹 Bearish Scenario:
If the price respects the descending trendline and fails to break above the neckline (around $109,480) , a bearish reversal is likely. In that case, the target based on the pattern lies near the $93,500–94,000 support zone. This level aligns with a previous consolidation area, making it a strong candidate for a reaction or bounce.
🔹 Bullish Scenario:
On the flip side, if the price breaks above the neckline and the descending trendline, invalidating the pattern, a strong bullish continuation could unfold. The potential breakout target would be around $127,000–130,000, in line with the projection from the head of the pattern.

Skeptic | Bitcoin Deep Dive: Rate Hikes, War Tensions & TriggersInterest Rates: The Big Picture
Let’s start with the Federal Reserve’s move—interest rates jumped from 4.25% to 4.5% . What’s the deal? Higher rates mean costlier borrowing , so businesses and folks pull back on loans. This drains liquidity from risk assets like Bitcoin and SPX 500, slowing their uptrend momentum or pushing them into ranges or dips. Now, mix in the Israel-Iran conflict escalating ? Straight talk: risks are sky-high , so don’t bank on wild rallies anytime soon. My take? BTC’s likely to range between 97,000 and 111,000 for a few months until geopolitical risks cool (like Russia-Ukraine became “normal” for markets) and the Fed starts cutting rates. Those two could ignite new highs and a robust uptrend. Let’s hit the charts for the technicals! 📊
Technical Analysis
Daily Timeframe: Setting the Stage
You might ask, “If 100,000 support breaks, does that mean we’ve formed a lower high and lower low, flipping the trend bearish per Dow Theory?” Absolutely not! Here’s why: our primary uptrend lives on the weekly timeframe, not daily. The daily is just a secondary trend. If 100K cracks, it only turns the secondary trend bearish, leading to a deeper correction, but the major weekly uptrend stays intact.
Spot Strategy: No spot buys for now. Economic and geopolitical risks are too intense. I’ll jump in once things stabilize. 😎
Key Insight: A 100K break isn’t a death sentence for the bull run—it’s just a shakeout. Stay calm!
4-Hour Timeframe: Long & Short Triggers
Zooming into the 4-hour chart, here’s where we hunt for long and short triggers:
Long Trigger: Break above 110,513.92. We need a strong reaction at this level—price could hit it early or late, so stay patient for confirmation.
Short Trigger: Break below 101,421.65. Same vibe—watch for a clean reaction to tweak the trigger for optimal entry.
Pro Tip: These levels are based on past key zones, but time outweighs price. Wait for a reaction to nail the best entry. Patience is your edge! 🙌
Bitcoin Dominance (BTC.D): Altcoin Watch
As BTC dips, BTC.D (Bitcoin’s market share) is climbing, meaning altcoins are taking a bigger beating. Don’t touch altcoin buys until the BTC.D upward trendline breaks. They haven’t moved yet—you might miss the first 10-100%, but with confirmation, we’ll catch the 1,000-5,000% waves together. 😏
Shorting? If you’re shorting, altcoins are juicier than BTC—sharper, cleaner drops with more confidence. Patience, patience, patience—it’s the name of the game.
Final Thoughts
My quieter updates lately? Blame the geopolitical chaos, not me slacking . I’m hustling to keep you in the loop with clear, actionable insights. here, we live by No FOMO, no hype, just reason. Protect your capital—max 1% risk per trade, no exceptions. Want a risk management guide to level up? Drop a comment! If this analysis lit a spark, hit that boost—it keeps me going! 😊 Got a pair or setup you want next? Let me know in the comments. Stay sharp, fam! ✌️

The Pattern That Could Launch Bitcoin, pt. 2There appears to be an IH&S pattern forming inside of the larger IH&S's right shoulder (see my previous post for the larger one). I've seen this happen a few times and then a break out upwards! Results may vary of course lol.
If it drops from here support could be at around $102k and then $100,500.

BTC Breakdown Escalates Bearish MomentumBitcoin has officially broken below the critical 104K support level, invalidating the recent short-term bullish structure. The price action reflects a clear shift in market sentiment, confirmed by the bearish EMA/SMA crossover and a firm rejection from the strong supply zone between 110K–111.8K.
This rejection formed a clean lower high around 110K, followed by a decisive drop below the weak supply area and failure to hold 104K a key level previously acting as a demand floor. The current structure now favors downside continuation, with the 98K zone as immediate focus.
If bearish momentum persists, attention will shift toward the Weak Potential Reversal Zone and eventually the Recommended Buy Back Zone around the 84K–86K area. This zone aligns with a historical support range and may offer high-probability entries for medium-term accumulation.
Until price reclaims the 104K–105.5K region, rallies are likely to be sold off within the supply zones. Short-term traders may look to trade the breakdown toward the highlighted support levels, while long-term investors should monitor price reaction within the buyback region.

Long IdeaI'm seeing a possible bullish cypher pattern forming for the mini blow off top for btc. This mimics the SPX500 and currently in lagging state. Ater that, it will go back around 50k - 60k area, probably to eliminate saylor out before going to the 240k - 280k region..

Example of how to draw a trend line using the StochRSI indicator
Hello, traders.
If you "Follow", you can always get new information quickly.
Have a nice day today.
-------------------------------------
We use the StochRSI indicator to draw a trend line.
We draw a trend line by connecting the peaks of the StochRSI indicator, i.e. the K line, when they are created in the overbought area or when they are created in the overbought area.
That is, when the K line of the StochRSI indicator forms a peak in the overbought area, the trend line is drawn by connecting the Open values of the falling candles.
If the candle corresponding to the peak of the StochRSI indicator is a rising candle, move to the right and use the Open value of the first falling candle.
When drawing the first trend line, draw it from the latest candle.
Since the third trend line indicates a new trend, do not draw anything after the third trend line.
The currently drawn trend line corresponds to the high-point trend line.
-
Therefore, you should also draw the low-point trend line.
The low-point trend line is drawn by connecting the K line of the StochRSI indicator when the top is formed in the oversold zone.
The low-point trend line uses the low value of the candle when the K line of the StochRSI indicator forms the top in the oversold zone.
That is, it doesn't matter whether the candle is a bearish candle or a bullish candle.
The drawing method is the same as when drawing the high-point trend line, drawing from the latest candle.
The top of the best K line of the StochRSI indicator was not formed within the oversold zone.
(The top is indicated by the section marked with a circle.)
Since the trend line was not formed, the principle is not to draw it.
If you want to draw it and see it, it is better to display it differently from the existing trend line so that it is intuitively different from the existing trend line.
-
The chart below is a chart that displays the trend line drawn separately above as a whole.
It is also good to distinguish which trend line it is by changing the color of the high-point trend line and the low-point trend line.
The chart below is a chart that distinguishes the high-point trend line in blue (#5b9cf6) and the low-point trend line in light green (#00ff00).
The low-point trend line is a line drawn when the trend has changed, so it does not have much meaning, but it still provides good information for calculating the volatility period.
-
To calculate the volatility period, support and resistance points drawn on the 1M, 1W, and 1D charts are required.
However, since I am currently explaining how to draw a trend line, it is only drawn on the 1M chart.
-
I use the indicators used in my chart to indicate support and resistance points.
That is, I use the DOM(60), DOM(-60), HA-Low, HA-High, and OBV indicators to indicate support and resistance points.
Since the DOM(-60) and HA-Low indicators are not displayed on the 1M chart, I have shown the 1W chart as an example.
The indicators displayed up to the current candle correspond to the main support and resistance points.
Although it is not displayed up to the current candle, the point where the horizontal line is long is drawn as the sub-support and resistance point.
It is recommended to mark them separately to distinguish the main support and resistance point and the sub-support and resistance point.
The trend line drawn in this way and the support and resistance points are correlated on the 1D chart and the volatility period is calculated.
(For example, it was drawn on the 1M chart.)
The sections marked as circles are the points that serve as the basis for calculating the volatility period.
That is,
- The point where multiple trend lines intersect
- The point where the trend line and the support and resistance points intersect
Select the point that satisfies the above cases at the same time to display the volatility period.
When the point of calculating the volatility period is ambiguous, move to the left and select the first candle.
This is because it is meaningless to display it after the volatility period has passed.
If possible, the more points that are satisfied at the same time, the stronger the volatility period.
If the K-line peak of the StochRSI indicator is formed outside the overbought or oversold zone, it is better to exclude it when calculating the volatility period.
-
The chart below is a chart drawn on a 1D chart by summarizing the above contents.
The reason why there are so many lines is because of this reason.
For those who are not familiar with my charts, I have been simplifying the charts as much as possible these days.
However, when explaining, I have shown all the indicators to help you understand the explanation.
-
Thank you for reading to the end.
I hope you have a successful trade.
--------------------------------------------------

BTC/USDT 4H Outlook - Bearish Setup playing outAs expected, BTC is now moving toward the 4H liquidity zone.
❗Price is breaking structure from the Daily FVG resistance, showing bearish momentum.
🔍 Current confluences in play:
— Rejection from Daily FVG
— 4H structure shift
— Clean imbalance below
🎯 My next key zone is 104K (4H liquidity)
Reaction there will guide the next move.
Stay tuned for more updates
