The Pattern That Could Launch Bitcoin, pt. 2There appears to be an IH&S pattern forming inside of the larger IH&S's right shoulder (see my previous post for the larger one). I've seen this happen a few times and then a break out upwards! Results may vary of course lol.
If it drops from here support could be at around $102k and then $100,500.
USDTBTC trade ideas

BTC Breakdown Escalates Bearish MomentumBitcoin has officially broken below the critical 104K support level, invalidating the recent short-term bullish structure. The price action reflects a clear shift in market sentiment, confirmed by the bearish EMA/SMA crossover and a firm rejection from the strong supply zone between 110K–111.8K.
This rejection formed a clean lower high around 110K, followed by a decisive drop below the weak supply area and failure to hold 104K a key level previously acting as a demand floor. The current structure now favors downside continuation, with the 98K zone as immediate focus.
If bearish momentum persists, attention will shift toward the Weak Potential Reversal Zone and eventually the Recommended Buy Back Zone around the 84K–86K area. This zone aligns with a historical support range and may offer high-probability entries for medium-term accumulation.
Until price reclaims the 104K–105.5K region, rallies are likely to be sold off within the supply zones. Short-term traders may look to trade the breakdown toward the highlighted support levels, while long-term investors should monitor price reaction within the buyback region.

Example of how to draw a trend line using the StochRSI indicator
Hello, traders.
If you "Follow", you can always get new information quickly.
Have a nice day today.
-------------------------------------
We use the StochRSI indicator to draw a trend line.
We draw a trend line by connecting the peaks of the StochRSI indicator, i.e. the K line, when they are created in the overbought area or when they are created in the overbought area.
That is, when the K line of the StochRSI indicator forms a peak in the overbought area, the trend line is drawn by connecting the Open values of the falling candles.
If the candle corresponding to the peak of the StochRSI indicator is a rising candle, move to the right and use the Open value of the first falling candle.
When drawing the first trend line, draw it from the latest candle.
Since the third trend line indicates a new trend, do not draw anything after the third trend line.
The currently drawn trend line corresponds to the high-point trend line.
-
Therefore, you should also draw the low-point trend line.
The low-point trend line is drawn by connecting the K line of the StochRSI indicator when the top is formed in the oversold zone.
The low-point trend line uses the low value of the candle when the K line of the StochRSI indicator forms the top in the oversold zone.
That is, it doesn't matter whether the candle is a bearish candle or a bullish candle.
The drawing method is the same as when drawing the high-point trend line, drawing from the latest candle.
The top of the best K line of the StochRSI indicator was not formed within the oversold zone.
(The top is indicated by the section marked with a circle.)
Since the trend line was not formed, the principle is not to draw it.
If you want to draw it and see it, it is better to display it differently from the existing trend line so that it is intuitively different from the existing trend line.
-
The chart below is a chart that displays the trend line drawn separately above as a whole.
It is also good to distinguish which trend line it is by changing the color of the high-point trend line and the low-point trend line.
The chart below is a chart that distinguishes the high-point trend line in blue (#5b9cf6) and the low-point trend line in light green (#00ff00).
The low-point trend line is a line drawn when the trend has changed, so it does not have much meaning, but it still provides good information for calculating the volatility period.
-
To calculate the volatility period, support and resistance points drawn on the 1M, 1W, and 1D charts are required.
However, since I am currently explaining how to draw a trend line, it is only drawn on the 1M chart.
-
I use the indicators used in my chart to indicate support and resistance points.
That is, I use the DOM(60), DOM(-60), HA-Low, HA-High, and OBV indicators to indicate support and resistance points.
Since the DOM(-60) and HA-Low indicators are not displayed on the 1M chart, I have shown the 1W chart as an example.
The indicators displayed up to the current candle correspond to the main support and resistance points.
Although it is not displayed up to the current candle, the point where the horizontal line is long is drawn as the sub-support and resistance point.
It is recommended to mark them separately to distinguish the main support and resistance point and the sub-support and resistance point.
The trend line drawn in this way and the support and resistance points are correlated on the 1D chart and the volatility period is calculated.
(For example, it was drawn on the 1M chart.)
The sections marked as circles are the points that serve as the basis for calculating the volatility period.
That is,
- The point where multiple trend lines intersect
- The point where the trend line and the support and resistance points intersect
Select the point that satisfies the above cases at the same time to display the volatility period.
When the point of calculating the volatility period is ambiguous, move to the left and select the first candle.
This is because it is meaningless to display it after the volatility period has passed.
If possible, the more points that are satisfied at the same time, the stronger the volatility period.
If the K-line peak of the StochRSI indicator is formed outside the overbought or oversold zone, it is better to exclude it when calculating the volatility period.
-
The chart below is a chart drawn on a 1D chart by summarizing the above contents.
The reason why there are so many lines is because of this reason.
For those who are not familiar with my charts, I have been simplifying the charts as much as possible these days.
However, when explaining, I have shown all the indicators to help you understand the explanation.
-
Thank you for reading to the end.
I hope you have a successful trade.
--------------------------------------------------

BTCUSDTHello Traders! 👋
What are your thoughts on BITCOIN?
In our previous outlook, we anticipated a pullback to the channel bottom followed by a bullish move, and so far, price has followed that scenario perfectly.
Bitcoin is now approaching the channel top and a major resistance zone. At this point, we are watching two potential scenarios:
Scenario 1 – Pullback Before Continuation:
If price rejects the resistance, a correction toward the midline of the channel (which aligns with a key support level) may occur. This could offer a strong entry point for the next bullish wave.
Scenario 2 – Breakout and Retest:
If Bitcoin breaks above the channel and resistance zone, we can look for buy opportunities on the pullback to the broken level, with potential targets at higher levels.
Price action in this area is crucial. Both a midline pullback and a resistance breakout could provide valuable trading setups.
Is Bitcoin gearing up for a breakout, or is another correction coming first? Share your view below! 🤔👇
Don’t forget to like and share your thoughts in the comments! ❤️

2/1/15I promised to update the idea of what will happen with the graph in the future. At 22 cm, we should now fall down.

BTC/USDT 4H Outlook - Bearish Setup playing outAs expected, BTC is now moving toward the 4H liquidity zone.
❗Price is breaking structure from the Daily FVG resistance, showing bearish momentum.
🔍 Current confluences in play:
— Rejection from Daily FVG
— 4H structure shift
— Clean imbalance below
🎯 My next key zone is 104K (4H liquidity)
Reaction there will guide the next move.
Stay tuned for more updates

BTCUSDT Daily – Bullish Engulfing = Big Move?Whenever we've seen a bullish engulfing candle on the daily timeframe, it’s often followed by a strong upward move. This pattern has repeated consistently throughout the current cycle.
🔹 The recent daily close shows a clean bullish engulfing right off the 50 EMA support.
🔹 Previous purple zones also highlight areas where similar engulfing candles led to sharp rallies.
🔹 Price is once again reclaiming momentum after a liquidity sweep — a classic accumulation signal.
📈 If history repeats, we could be eyeing another leg higher toward the $112K–$115K zone.
Pattern Psychology:
"This bullish engulfing isn’t just a candle — it's a sentiment shift, where buyers overpower sellers completely in one session."
🔹EMA Bounce Strategy:
"Price is using the 50 EMA as a trampoline — a typical smart money support zone."
🔹 Rejection of Breakdown Narrative:
"The fakeout below 100,582 support could be a classic bear trap, setting up for a liquidity-driven rally."
🔹 Pivot Zone Reaction:
"Immediate pivot zone (102,292) reclaimed — price now in a favorable position to target next R1 around 110,000."
🔹 Historical Context:
"This setup mirrors the March bounce, where similar structure and RSI/MACD confluence led to a 12% surge."
⚠️ Disclaimer:
This is not financial advice or a buy/sell recommendation. Analysis is for educational purposes only.
All chart markings and interpretations are original.

BTC MTF AccumulationThis is the current accumulation model i am watching to bring BTC back to ATH's and form the second deviation of the HTF distribution model. I would prefer if we could go lower and form a range from there, but at the moment thats all i got.

BTCUSDT:Sharing of the Latest Trading StrategyAll the trading signals last week have resulted in profits!!! Check it!!!👉👉👉
Bitcoin Technical Analysis (4-Hour Chart):
Price remains within an ascending channel. The MACD above the zero line with expanding red histograms indicates bullish dominance. After firmly breaking above the key resistance at $105,000, price is testing $110,000.
Caution: The RSI near 70 has entered overbought territory, increasing short-term pullback risks.
Support levels: $106,000 and $105,000.
Trading Recommendation for Aggressive Traders
Consider light long positions near $106,000 on pullbacks, with stop-loss set below $105,000.
Trading Strategy:
buy@105000-106000
TP:108000-110000

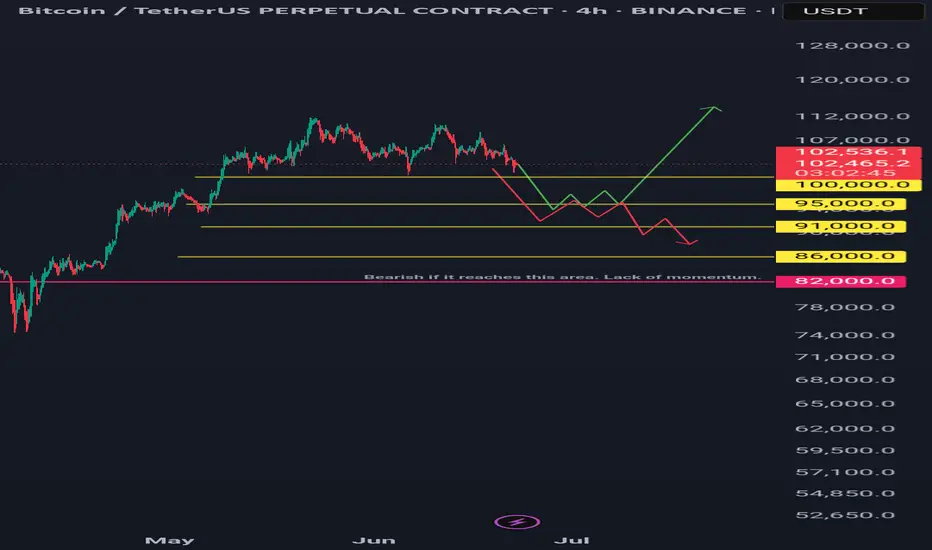
Btcusdt 4hr tf scenarios.Two scenarios: green and red lines.
Green Line: A bounce and sustained recovery above the 100-day and 200-day daily moving averages is bullish.
Red Line: A bounce followed by a lack of momentum and a break below a previous low is bearish.
Long Horizontal Red Line: If the price reaches this area, it could signal the start of a downtrend unless new bullish fundamentals emerge.
My Point of View (POV): I am bearish, primarily due to the ongoing war, similar to the conflict that began between two other countries a year ago.
However, it's important to note that every crisis and recession has historically presented a buying opportunity for institutions and 'whales.' Therefore, be prepared with funds for dollar-cost averaging (DCA), then simply hold and forget. It is recommended to conduct backtesting and research to identify optimal buying areas. DCA is key. Only invest money you can afford to lose.
StochRSI indicator and support and resistance levels
Hello, traders.
If you "follow" me, you can always get the latest information quickly.
Have a nice day today.
-------------------------------------
The StochRSI indicator on the left chart is slightly different from the StochRSI indicator on the right.
The StochRSI indicator on the left chart is the StochRSI indicator provided by default in TradingView, and the StochRSI indicator on the right chart is an indicator with a modified formula.
The StochRSI indicator is a leading indicator that is reflected almost in real time.
Therefore, it reacts sensitively to price changes.
Although it is advantageous because it reacts sensitively, it also increases the possibility of being caught in a fake, so I thought that a slight delay(?) was necessary, and so I created the StochRSI indicator on the left chart.
If you look at the relationship between the K and D of the StochRSI indicators on the two charts, you can see that there is a big difference.
In the end, you can predict the movement by checking whether the movement of the K line has escaped the overbought or oversold section.
However, I think that you will receive information that can determine the sustainability of the trend depending on the positional relationship between K and D.
Therefore, it is important to distinguish the inflection points that occur in the StochRSI indicator.
This is because these inflection points provide important information for drawing trend lines.
Therefore, the StochRSI indicator on the left chart, which better expresses the inflection point, is being used to draw the trend line.
(Unfortunately, this indicator was not registered on TradingView because I did not explain it well.)
-
As a new candle was created, the StochRSI indicator on the left chart is showing an inflection point on the K line.
The StochRSI indicator on the right chart is showing a transition to a state where K < D.
We will have to check whether the inflection point was created only when today's candle closes, but I think that the fact that it is showing this pattern means that there is a high possibility of a change in the future trend.
Since the next volatility period is expected to start around July 2nd (July 1st-3rd), I think it has started to show meaningful movements.
-
It is true that you want to buy at the lowest price possible and sell at the highest price.
However, because of this greed, one mistake can lead to a loss that can overturn nine victories, so you should always be careful.
Therefore, if possible, it is better to check for support and respond.
In that sense, I think it is worth referring to the relationship between K and D of the StochRSI indicator on the left chart.
This is because the actual downtrend is likely to start when K < D.
-
In order to check for support, you definitely need support and resistance points drawn on the 1M, 1W, and 1D charts.
Ignoring this and checking for support at the drawn support and resistance points can result in not being able to apply the chart you drew to actual trading.
Therefore, you should draw support and resistance points first before starting a trade.
Otherwise, if you draw support and resistance points after starting a trade, you are more likely to set support and resistance points that reflect your subjective thoughts, so as I mentioned earlier, you are more likely to lose faith in the chart you drew.
If this phenomenon continues, it will eventually lead to leaving the investment market.
-
It is important to determine whether there is support by checking the correlation between the StochRSI indicator and other indicators at the support and resistance points drawn on the 1M, 1W, and 1D charts.
Even if the inflection point of the StochRSI indicator or other indicators occurs at a point other than the support and resistance points you drew, you should consider it as something that occurred beyond your ability to handle.
In other words, you should observe the price movement but not actually trade.
As I mentioned earlier, if you start to violate this, you will become less and less able to trust the chart you drew.
-
Accordingly, the basic trading strategy I suggest is to buy near the HA-Low indicator and sell near the HA-High indicator.
However, since the HA-Low and HA-High indicators are expressed as average values, they may move in the opposite direction to the basic trading strategy.
In other words, if the HA-Low indicator is resisted and falls, there is a possibility of a stepwise downward trend, and if the HA-High indicator is supported and rises, there is a possibility of a stepwise upward trend.
Therefore, the basic trading strategy mentioned above can be considered a trading strategy in the box section.
In the case of deviating from this box section, it is highly likely to occur before and after the volatility period indicated by the relationship between the trend line using the StochRSI indicator mentioned above and the support and resistance points drawn on the 1M, 1W, and 1D charts.
Therefore, special care is required when conducting new transactions during the volatility period.
This is because there is a high possibility of being caught in a fake when trading during the volatility period.
-
The DOM(60) and DOM(-60) indicators are good indicators to look at together with the HA-Low and HA-High indicators.
The DOM indicator is an indicator that comprehensively evaluates the DMI, OBV, and MOMENTUM indicators.
Therefore, the DOM(60) indicator is likely to be at the end of the high point range, and the DOM(060) indicator is likely to be at the end of the low point range.
In the explanation of the HA-Low and HA-High indicators,
- I said that if the HA-Low indicator receives resistance and falls, there is a possibility that a stepwise downtrend will begin,
- and if the HA-High indicator receives support and rises, there is a possibility that a stepwise uptrend will begin.
In order for an actual stepwise downtrend to begin, the price must fall below DOM(-60), and in order for a stepwise uptrend to begin, it must rise above DOM(60).
In other words, the DOM(-60) ~ HA-Low section and the HA-High ~ DOM(60) section can be seen as support and resistance sections.
-
If these correlations start to appear, I think you will be able to create a trading strategy that fits your investment style without being swayed by price volatility and proceed with trading.
The reason for analyzing charts is to trade.
Therefore, the shorter the time for chart analysis, the better, and you should increase the start of creating a trading strategy.
-
Thank you for reading to the end.
I hope you have a successful trade.
--------------------------------------------------

Bitcoin (BTC): We Called It, $120K Happening + Volatility ComingBitcoin had an amazing start and bounce from our buy zone, where price has bounced properly and is now heading toward the local high area, which we intend to see broken.
So far the buyers keep the dominance momentum well, but we have to remember, during such times when we are approaching the ATH area, volatility is guaranteed, and so is the liquidity hunting in both ways.
Swallow Academy

Bitcoin long back to $110000Recently opened a long position on bitcoin. Aggressive entry. Soon I anticipate a push back up to 110000
4hr trend is still in tact. 1hr trend is bearish failed to make new LL.
Lets see how it goes.
2RR trade roughly.

BTC Roadmap Still Intact Bullish Momentum Building Toward 120KBitcoin Price action continues to validate the bullish roadmap shared in our last BTC post. The market respected the Immediate Buy Back Zone, springing from a demand backed structure into a fresh impulsive leg.
Notably, price has carved a clean 5-wave structure supported by recurring bullish pennants and continuation patterns each breakout driving momentum higher. Our target at 120,151 remains firmly intact, with price action showing healthy structure and controlled pullbacks.
The current setup remains valid as long as price holds above 106,655 and especially 100,941, which now act as structural pivot zones. Any deeper correction into the Demand Area would only serve as a re-accumulation window before the next leg.
Let’s see how price behaves into June. Momentum is aligning with structure.
Share your thoughts, like the post, and drop your setup confirmations on the comment section.

BTC Just Breakout! Are we ready for new ATH? BTC just breakout from 4h trendline and anticipate for any retracement soon before sky rocket into new ATH, historically saying my target will be on $148k.
NFA!!
DYOR!!

HolderStat┆BTCUSD retesting of the trend lineKUCOIN:BTCUSDT has pushed above 107,000 and reclaimed key levels after breaking from triangle and consolidation zones. Structure supports a move toward the 112,000 resistance zone (ATH). Higher lows and strong rallies continue to define the trend.

BTC - Perfect Trendline TestOur previous post can be found here: www.tradingview.com
From what we were pointing out yesterday how BTC was testing our trendline of support - today we have seen the fulfillment of this move as we saw two more touchpoints of support on the trendline and are now making our way back towards the red trendline as stated in our last post.

BTC Correction's 📉 Significant Bitcoin Correction During Uptrend
After a strong bullish rally, Bitcoin has entered a correction phase, retracing nearly 25% of its recent gains. Interestingly, this correction aligns exactly with the 200-period moving average on the 4-hour chart, marking a potential key support level.
🔍 Is Bitcoin’s Correction Over or Just Beginning?
The overlap with the 200 MA could signal the end of the correction, but if this zone fails to hold, deeper targets between the 35% and 75% retracement levels may come into play.
🛡️ Potential Support Levels for Bitcoin if the Correction Continues:
First support: 102,200 USD – 25% correction
Second support: 93,200 USD – 35% correction
Third support: 84,100 USD – 50% correction
Fourth support: 74,600 USD – 75% correction

BTCUSDT daily analysisia have shared one hour timeframe analysis and this is daily timeframe and i am following priceaction candle and volume with SMC and more my own personal and private strategies

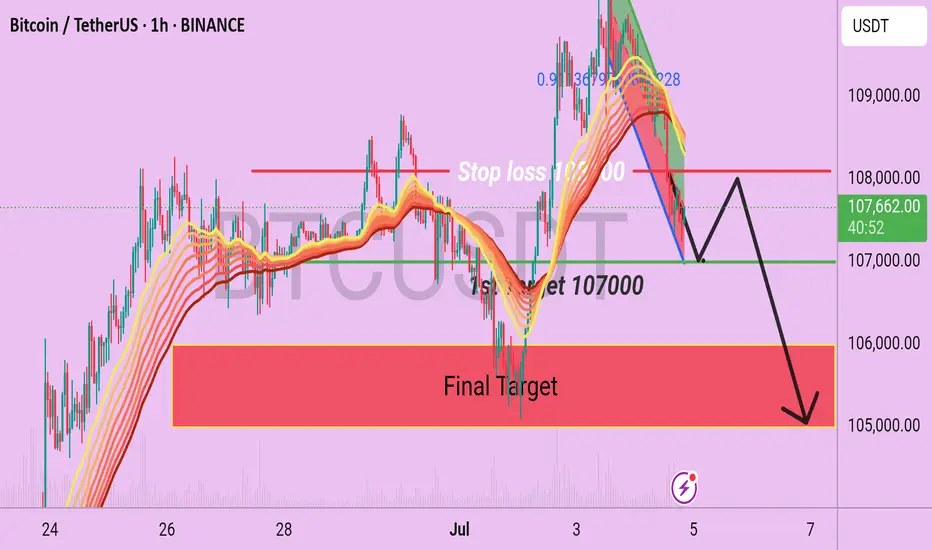
BTC/USDT H1 Chart Out look Bitcoin is Now running at near the 107500 and following a short term Bearish pattern on EMA 50 and 200 by using that we can consider on sell side with the given Targets like 107000 which is near the Bitcoin is consolidating and the Final target support is 106000/105000.
Bearish Scenario
1st Target is 107000 ( from here it may make some retest)
2nd Target is 106000( main target).
3rd Target is 105000.
Use stop loss at 108100.
BTC shorting opportunity comes againBTC climbed above 108000 again, and the short-term bullish power was slightly stronger. According to the current strength, BTC still has room for growth, but it is still under pressure in the 109000-110000 area in the short term; if there is no major positive news, BTC may find it difficult to break through the resistance area in the short term under the current conditions, and may even experience stagflation and retreat again after approaching the resistance area.
Therefore, I think shorting BTC with the help of the resistance area is still the first choice for short-term trading. We can boldly short BTC in the 108500-109500 area and look towards the target area around 106000 again.

Check support at 108316.90-111696.21
Hello, traders.
If you "Follow", you can always get new information quickly.
Have a nice day today.
-------------------------------------
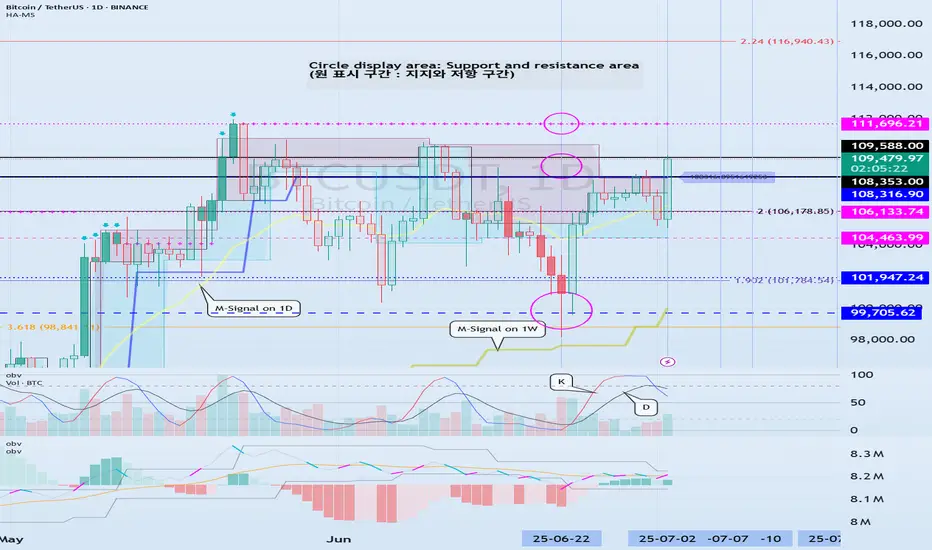
(BTCUSDT 1D chart)
Among the many trend lines, the one marked 1W is the important one.
Therefore, we need to look at whether it can rise above the 1W trend line or rise along the trend line.
If not, and it falls below 108316.90, it may lead to further decline, so we need to think about a countermeasure for this.
This volatility period is expected to continue until July 3, but it is expected to last until July 11, so caution is required when trading.
-
Indicators that indicate high points are DOM(60), HA-High, and StochRSI 80.
HA-High and StochRSI 80 are formed around 108316.90, and DOM(60) is formed at 111696.21.
Therefore, the 108316.90-111696.21 section is a high point boundary section, and if it is supported and rises in this section, it is highly likely that a stepwise uptrend will begin.
The conditions for a stepwise uptrend to begin are:
- The K of the StochRSI indicator must show an upward trend below 80,
- The PVT-MACD oscillator indicator must show an upward trend above the 0 point,
- The OBV of the Low Line ~ High Line channel must show an upward trend. If possible, it is better for the Low Line ~ High Line channel to form an upward channel.
When the above conditions are met, I think that if it is supported and rises in the 108316.90-111696.21 section, it is highly likely that a stepwise uptrend will continue.
If the above conditions are not met, it is likely that it will show a downward trend again while pretending to rise.
-
Thank you for reading to the end.
I wish you successful trading.
--------------------------------------------------
- This is an explanation of the big picture.
(3-year bull market, 1-year bear market pattern)
I will explain more details when the bear market starts.
------------------------------------------------------
Bitcoin - Flag pattern is brokenBitcoin had been consolidating within a flag pattern for the past three months. That pattern has now officially broken to the upside, with the price surging to $109K — a strong bullish signal fueled by encouraging news around institutional adoption.
Based on both the technical flag breakout and ongoing fundamental momentum, the next target for Bitcoin is $145K. Any move beyond that would be considered a bonus in this current bull cycle.
Stay tuned for more updates.
Cheers,
GreenCrypto
