CONSOLIDATIONfriends BTC will consolidate inside the channel for couple of days . if it break upside it will make all time high definitely. if it break downside there is chance of dump till 105k.
USDTBTC trade ideas

Bitcoin is in a downward trend.Hello dear friends.
Considering the trend of Bitcoin, it is expected that this Bitcoin will fall to around $100,000.
❌Please note that this is just a prediction, so be careful with your capital.

BTCUSDT: Positive CDV Divergence for Potential Long Setups• Market Overview: Bitcoin currently sits at a pivotal point. Although the price movement has been somewhat indecisive, we’re watching closely for signs of bullish momentum.
• CDV Divergence Focus: Our attention is on a potential positive Cumulative Volume Delta (CDV) divergence. This takes shape when the price makes a lower low but CDV registers a higher low (regular bullish divergence), or when the price posts a higher low and CDV shows a lower low (hidden bullish divergence). These patterns can hint at growing buying interest even if price action hasn’t caught up yet.
• Support Zones (Blue Boxes): The highlighted blue zones on the chart signal potential support levels where buyers may step in. These are mapped from prior demand areas or structural support points.
• Trade Setup: Should a confirmed positive CDV divergence appear near or inside one of these blue zones, it could offer a strong case for a long entry. This would suggest that while the price may look weak, buying strength is quietly building underneath.
• Managing Risk: Any long entry must be accompanied by a well-defined invalidation level—typically just below the blue box support or the lowest point of the divergence.
Disclaimer: This is a technical pattern-based analysis intended for informational purposes only. Trading involves risk. Always perform your own due diligence and assess your risk appetite before entering any trades.

BTC - Will the Bears finally get their chance?Buy Side Liquidity Sweep in Progress
Price is currently climbing toward a region densely packed with resting buy side liquidity, marked by multiple previous highs. The area around 108,900 to 111,000 is especially significant, with two clear liquidity pools stacked above recent swing highs. These levels are likely to attract price as market participants seek to trigger stop orders and induce fresh buying interest—setting the stage for a potential reversal.
Weakness in the Current Impulse
The recent rally has advanced with minimal retracement and virtually no visible Gaps. This lack of corrective structure often indicates imbalance and suggests the move is overextended. When price moves upward too cleanly, it tends to leave behind thin liquidity zones, making the entire leg vulnerable to a sharper correction once exhaustion sets in.
Fair Value Gap as a Draw Below
Below current price lies a prominent bullish Fair Value Gap around 104,000. This inefficiency was left unfilled during the last leg up and may now serve as a magnet for price. These types of Gaps are often revisited by the market in an effort to rebalance supply and demand, especially after aggressive moves that break structure to the upside.
Once the higher liquidity levels are swept, watch for a clear reaction—either a strong rejection or lower timeframe structure shift—which could signal that the top is in. If that shift materializes, price may begin a downward leg targeting the unfilled Gap below. The magnitude of the move, combined with the lack of structure on the way up, leaves plenty of room for corrective action.
For those looking to engage, waiting for confirmation on a lower timeframe—such as a break of short-term bullish structure or the formation of a bearish Gap—can help time entries more precisely. In setups like these, patience is key: let the Sweep play out, observe how price reacts, and only then consider stepping in.

Bitcoin Prepares for Upward MoveBitcoin has formed a flag pattern, indicating consolidation at a structural base. A confirmed breakout on the daily chart would strengthen the case for a continued upward trend.

Bitcoin (BTC): Still Hovering Near ATH | Seems WeakeningBitcoin is still hovering near the local ATH area, where sellers and buyers are fighting over the zone there.
There is nothing clear yet so we keep on monitoring, but we are seeing smaller signs of weakness, which indicate upcoming volatile movement as we are approaching the end of the month.
Now we will keep an eye on how sharp the monthly opening will be and based on that, we will trade. Our attentions are still at $120K for now.
Swallow Academy

BTC/USDT Trade Setup – Lord MEDZStrategy: Goldbach Fair Value Gap + Smart Money Concepts (SMC)
Timeframe: 6H
Bias: Long
Trade Parameters
Entry: 102,577
Stop Loss: 99,527
Take Profit: 118,153
Risk to Reward: Approximately 5:1
Confluences and Justification
Price is expected to retrace into a clear Fair Value Gap (FVG) formed after displacement, aligning with the Goldbach model.
The structure confirms a completed reaccumulation phase, presenting a high-probability long setup.
This would complete the right shoulder of the classic inverse head and shoulders pattern, with the shoulder projected to dip into the POI. Head and shoulders patterns are often manifestations of Wyckoff accumulation or distribution phases, for those who may not be aware.
Liquidity left inside the gap provides inducement, increasing the likelihood of a sweep into the 102.5K zone.
The take-profit target at 118,153 aligns with the high of the Goldbach Fibonacci extension level.
Execution Plan
Wait for price to return to the FVG zone around 102,577. Look for confirmation such as a bullish displacement candle, a lower time frame BOS (break of structure), or mitigation of a lower time frame order block. Upon confirmation, execute long with a stop below 99,527. Take profit is set at 118,153.
Final Note from Lord MEDZ
"I await the return of price to imbalance. The reaccumulation is complete, and the alignment is clear. Entry shall be taken where inefficiency remains, and profit shall be claimed where liquidity awaits."

The Critical Blue Line – Will Bitcoin Soar or Sink
🔹 Bitcoin Technical Analysis – Key Blue Line, Bear Trap Possibility & Long-Term Scenario
On the Bitcoin chart, the blue horizontal level has acted multiple times as both support and resistance. The price has broken it several times but failed to sustain above, indicating high-volume decision-making zones by institutions and large players.
📉 Why this pattern keeps repeating:
Strong supply and demand concentration at this level.
Inability to break and hold shows market indecision.
Repeated fakeouts are likely used to shake out weak hands.
🔍 Important hidden scenario: Bear Trap Potential
If the price dips below the blue line but quickly reclaims it, it may form a bear trap, tricking short sellers into entering prematurely. This move could ignite strong bullish momentum from trapped sellers and renewed buyers.
🔮 If price holds above the blue line:
Signals market strength and potential bullish structure shift.
Targets:
109,800
117,200
120,000+ (Long-term)
📛 If support fails again:
Retracement toward the lower channel near 101,000 or lower is possible.
📊 Conclusion:
This zone is one of the most critical decision points in the current market. Traders should combine volume, candlestick behavior, and confirmation signals to avoid getting trapped by fake breaks

Bitcoin Bullish Flag Breakout Incoming?MARKETSCOM:BITCOIN is currently consolidating within a bullish flag pattern on the daily chart, following a strong impulse move from the $74,000 support zone marked in April. The price is hovering near a critical horizontal resistance zone ($ 108,000–$ 109,000), which has historically acted as a major barrier to further gains.
Technical Highlights:
Bullish Flag Pattern: Clear flag formation after a strong uptrend, suggesting continuation potential.
Strong Support Rebound: April's bounce from the ~$74K support zone marked a key higher low.
EMA: Price is currently trading above both the 50-day and 100-day EMAs — a bullish sign of momentum.
Breakout Potential: A confirmed breakout above the flag resistance (~$109K) could ignite a strong rally toward $130K+.
Breakout Move: If the flag pattern plays out, CRYPTOCAP:BTC could target the $125K–$135K zone in the coming weeks.
Buy Entry: Once the day candle closes above the flag resistance line

#BTCUSDTbearish side of the btc is slow, as the volume of sell is not that high...…any strategy doesn't fit the lower low, i am seeing btc to the 132k.
anyone overthere with a new different strategy regarding btc?

Bitcoin - Time to sell, huge drop will follow (must see!)Bitcoin is currently approaching a very strong resistance of this major bullish flag! We definitely want to sell resistances and buy supports, not the other way around, until we have confirmations. Bitcoin's price action is statistically very boring during summer seasons! Usually high volatility kicks in in September. I think we cannot really expect a new all-time high in the next few weeks. Instead, we should see a big range. In the short term, Bitcoin should go back at least to around 102,600 USDT to fill up the FVG. Also, markets always move in waves, and this move from 98,200 seems to be exhausted already.
On the chart we can clearly see a blue trendline, and price went below this trendline at the end of May. This indicates that the uptrend is over and a consolidation/distribution phase is in progress. This phase is usually represented as a bull flag, triangle, rectangle, or wedge. When we look at the current price action, it looks like a bullish flag consolidation pattern. Bitcoin is currently in the sell around 109k
There are 2 types of traders. The first one they love to trade ranges, and the second they love to trade breakouts and higher volatility environments. Currently I think Bitcoin is creating a range, so do not expect any crazy movements until this bullish flag is valid.
Bullish flags are usually bullish patterns, but often they break down and act like bearish patterns. So what would happen if this bullish flag breaks down? That would send the price of Bitcoin to the 0.618 FIB, which is at 88,882 USDT. What if this bullish flag breaks out? That would send the price of Bitcoin to 116,000 to 125,000, but to establish this price, we first need to see the low of the bull flag, which is not confirmed yet. I will definitely inform you in one of my next analyses, so write a comment with your altcoin + hit the like button, and I will make an analysis for you in response.
Trading tip at the end: "A trader needs to accept the losses to maintain their emotional stability. Losses are a crucial internal part of trading that helps traders to learn how to grow from their losses. Traders learn from losses and implement required changes in their strategies for better results in future trades." Trading is not hard if you have a good coach! This is not a trade setup, as there is no stop-loss or profit target. I share my trades privately. Thank you, and I wish you successful trades!

BTC Preparing for Final Sweep Before Breakout?I’m currently waiting for a long opportunity on BTCUSDT. Price is consolidating in a range, and I believe we’re approaching the final support zone within this structure. The key area I’m watching is the 4H imbalance zone between ~102,968 and ~104,535, which also aligns with a strong structural support level.
I expect price to sweep this area, potentially triggering stop-losses below recent lows and then show a bullish reaction If confirmed, I’ll look to enter long targeting the liquidity resting around 108,762.
I’ll be watching closely for a reaction and confirmation

long bitcoin from 106160ALL trading ideas have entry point + stop loss + take profit + Risk level.
hello Traders, here is the full analysis for this pair, let me know in the comment section below if you have any questions, the entry will be taken only if all rules of the strategies will be satisfied. I suggest you keep this pair on your watchlist and see if the rules of your strategy are satisfied. Please also refer to the Important Risk Notice linked below.
Disclaimer

All this just before Fedwire implements ISO20022?#bitcoin #btc price attempted a breakout but today failed with dumps. There "may" be other attempts but while ISO20022 subject is approaching, isn' t it wise to think about #xrp and other ISO20022 licenced coins will overperform the others (BTC, ETH, SOL and all other non iso certified coins) in near future? Not financial advice.

Bitcoin Price Analysis! What's Next?Bitcoin Price Analysis! What's Next?
From our last analysis, Bitcoin increased from 107K to 108.5K
The price reached the limits of the pattern so far making everything more difficult because it increased, but with very low volume.
This time, BTC added some more data.
You may watch the analysis for further details
Thank you!

[SeoVereign] BITCOIN Bearish Outlook – June 29, 2025We are the SeoVereign Trading Team.
With sharp insight and precise analysis, we regularly share trading ideas on Bitcoin and other major assets—always guided by structure, sentiment, and momentum.
🔔 Follow us to never miss a market update.
🚀 Boosts provide strong motivation and drive to the SeoVereign team.
--------------------------------------------------------------------------------------------------------
Hello,
This is Seobeorin, approaching technical analysis not as a result but as a prediction, from a realistic perspective.
I am presenting a bearish view on Bitcoin as of June 29, 2025.
If you refer to the Ethereum idea from June 27, 2025, you can confirm that I presented a bearish perspective on Ethereum at the time. The basis for that perspective is still valid, and we are currently waiting for the take-profit level to be reached. The reason I selected Ethereum at the time was because I believed that the downward pressure on Ethereum was relatively stronger than that on Bitcoin.
However, based on today’s Elliott Wave count on the Bitcoin chart, I now judge that Bitcoin is also likely to experience some short-term downward pressure. Therefore, I am presenting a short position idea on Bitcoin.
The first take-profit target is set near $106,056. Depending on future price movements, this take-profit target may be narrowed or expanded. I will continue to track this idea, and as it develops, I will align the reasoning accordingly to organize the thought process more clearly.
Thank you.

Bitcoin Rejected at Value Area High — Full Market Auction Lower?Over the past 24 hours, Bitcoin has seen a short-term pullback after being rejected from the daily resistance level, which aligns with the value area high. The reaction also coincides with a volatility squeeze shown on the Bollinger Bands — hinting at a controlled, technical rejection rather than a panic selloff. If the market follows traditional auction theory, a full rotation toward the value area low may now be in progress.
Key Technical Points:
-Value Area High Rejection: Price was rejected from high time frame resistance and respected auction theory principles
-Targeting $103,000 Value Area Low: Price may rotate lower if resistance continues to cap upside
-$100,000 Psychological Support Untapped: Remains a magnet for liquidity if the range plays out fully
Bitcoin’s structure over the past week has remained range-bound between $108,000 and $100,000. The recent failure to break through the value area high at the upper end of this range has now triggered a controlled pullback — technically expected based on market auction dynamics. Once a value area high is respected and price cannot sustain above it, the natural response is for the market to seek equilibrium by rotating toward the value area low.
This theory aligns with current confluences: the rejection occurred exactly where daily resistance, the value area high, and upper Bollinger Band resistance converged. The rejection was not sudden or erratic, but gradual — indicating that this is likely a technical rejection, not emotional selling. If this rotation plays out as expected, the next key support will be found near the $103,000 region.
What further supports this narrative is the untouched $100,000 psychological level, which remains a natural magnet for both liquidity and sentiment. From a market structure perspective, $100K serves as a clean test zone for buyers to step in and attempt to form a bottom — particularly if the pullback is slow and controlled rather than volatile and sharp. Until then, all signs suggest that the upper limit of the current range has held.
If Bitcoin remains capped beneath $108,000, expect further downside pressure. A full market auction rotation could bring price to $103,000, with the potential to dip as low as the $100,000 psychological level. This zone will be key for judging the strength of buyers and determining whether the range continues or a broader breakdown begins. Only a reclaim of the value area high would invalidate this structure.

Bitcoin Approaches PRZ – Will the Falling Wedge Break ?Bitcoin ( BINANCE:BTCUSDT ) failed to break through the Support zone($106,800-$105,820) after attacking it five times , and started to rise again.
Bitcoin is currently moving near the Resistance zone($109,220-$108,280) , Cumulative Short Liquidation Leverage($108,800-$108,085) , Potential Reversal Zone(PRZ) , and Resistance lines .
From a Classical Technical Analysis perspective , Bitcoin's movements over the past two days seem to have formed a Falling Wedge Pattern .
From an Elliott Wave theory perspective , Bitcoin appears to have completed the main wave 4 within the Falling Wedge Pattern. The structure of the main wave 4 was a Double Three Correction(WXY) .
I expect Bitcoin to attack the Resistance lines after breaking the upper line of the Falling Wedge Pattern . If Bitcoin fails to break the Resistance lines before the global markets close , we can expect Bitcoin to fall again. Because entering Saturday and Sunday , the trading volume is generally low , and I think Bitcoin needs a lot of volume to break the resistances .
Do you agree with me?
CME Gap: $106,645-$106,295
Cumulative Long Liquidation Leverage: $106,055-$105,430
Note: If Bitcoin manages to break the Support zone($106,800-$105,820), we should expect further declines.
Please respect each other's ideas and express them politely if you agree or disagree.
Bitcoin Analyze (BTCUSDT), 1-hour time frame.
Be sure to follow the updated ideas.
Do not forget to put a Stop loss for your positions (For every position you want to open).
Please follow your strategy and updates; this is just my Idea, and I will gladly see your ideas in this post.
Please do not forget the ✅' like '✅ button 🙏😊 & Share it with your friends; thanks, and Trade safe.

BTC - Testing Trendline Here is an update to our previous post:
Zoom into the lowertime frame (1H) here is a zoomed in look at what is going on. Right now BTC just tested the trendline we pointed out in the last post. As you can see we have many touchpoints of support on this trendline (green arrows). Very important to monitor BTC's price action around this trendline.
If price is to lose this level then we would want to watch our fib target of $103k. If price can continue to hold it as support then a move back to test the red trendline is likely.

BITCOIN TOUCHED 110K — THEN REJECTEDNot what bulls wanted to see.
With massive gaps below, this kind of price action ain’t it.

break, BTC soon reaches new ATH💎 Update Plan BTC after NFP (July 3)
Notable news about BTC:
Bitcoin (BTC) recovered to $ 109,000 on Wednesday when the US agreement with Vietnam and the increase in global M2 supply of M2 money has promoted an increase in open interest rates (OI), soaring to 689.78 thousand BTC worth about $ 75 billion. The cryptocurrency market in general has increased the price along with BTC, with leading altcoins, Ethereum (ETH), XRP and Solana (SOL) increased by 7%, 3%and 4%respectively.
Bitcoin, the market cryptocurrency market increased by the trade agreement with Vietnam and M2 money supply soared
The cryptocurrency market has recovered on Wednesday, an increase of 2% to regain the market capitalization of $ 3.5 trillion.
Technical analysis angle
First, congratulate the investors who follow the plan when we previously traded according to the model and had a short signal at 108k and took profit and then Long in the 106k area.
Currently, BTC is in wave 5 and is trapped in the Fibonanci area of 2,618 golden ratio around the price of 109k, this is also the threshold of the price of investors who are under pressure before the price area goes to 112k
The 112k region is a psychological area of profit and will appear on the 109k sales situation before the BTC price may rise further in the last 6 months of the year.
Please follow the channel to receive accurate scenarios about gold and BTC /-Teart /-heart
==> Comments for trend reference. Wishing investors successfully trading

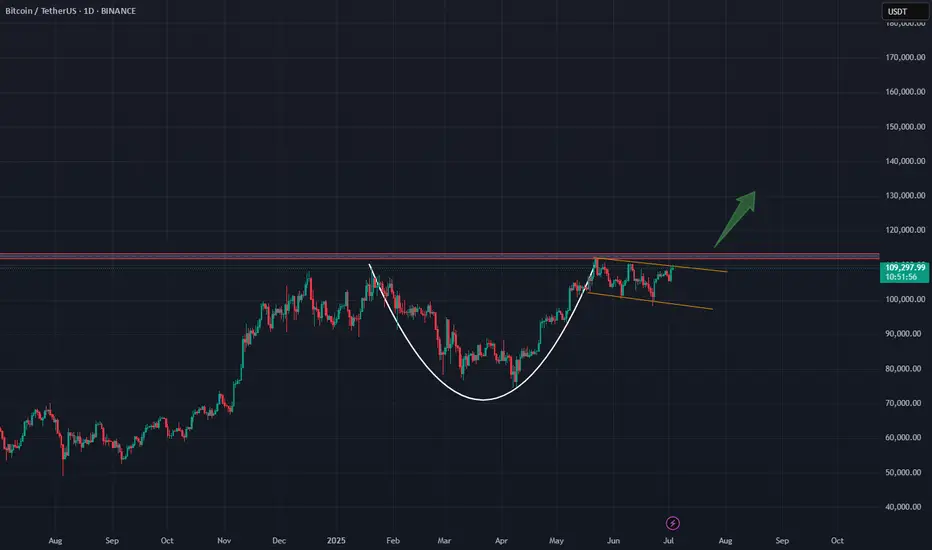
btc usdtbtc usdt
cup patern
I think my eyes are seeing correctly! After the breakout from above and confirmation on the red line, it will move upward.”
BTCUSDT at Best Resistance !!This is the Daily chart of Bitcoin .
BTCUSDT is trading near it Resistance Zone 108,600 - 107,400.
If this level is sustain , then we may see lower prices in BTCUSDT.
Thank You !!
