BTCUSDT at Best Resistance !!This is the Daily chart of Bitcoin .
BTCUSDT is trading near it Resistance Zone 108,600 - 107,400.
If this level is sustain , then we may see lower prices in BTCUSDT.
Thank You !!
USDTBTC trade ideas

BTC\USD SHORT TRADE SETUP BTC/USDT – Short Trade Setup Breakdown (Technical Outlook
Trade Thesis
The area between 103,800–105,000 serves as a strong supply zone, and we’re seeing signs of exhaustion in bullish momentum. The setup suggests a high-probability short opportunity with tight confirmation.
🔸 Entry: Positioned at 103,800, just below resistance, to capture early weakness and avoid chasing.
🔸 Risk Level: The resistance at 105,000 is critical — any break and close above may invalidate this setup.
🔸 Targets:
🎯 Target 1: 97,000 – conservative exit at mid-range demand zone
🎯 Target 2: 96,000 – full target near bottom of the descending channel

Bitcoin Approaches PRZ – Will the Falling Wedge Break ?Bitcoin ( BINANCE:BTCUSDT ) failed to break through the Support zone($106,800-$105,820) after attacking it five times , and started to rise again.
Bitcoin is currently moving near the Resistance zone($109,220-$108,280) , Cumulative Short Liquidation Leverage($108,800-$108,085) , Potential Reversal Zone(PRZ) , and Resistance lines .
From a Classical Technical Analysis perspective , Bitcoin's movements over the past two days seem to have formed a Falling Wedge Pattern .
From an Elliott Wave theory perspective , Bitcoin appears to have completed the main wave 4 within the Falling Wedge Pattern. The structure of the main wave 4 was a Double Three Correction(WXY) .
I expect Bitcoin to attack the Resistance lines after breaking the upper line of the Falling Wedge Pattern . If Bitcoin fails to break the Resistance lines before the global markets close , we can expect Bitcoin to fall again. Because entering Saturday and Sunday , the trading volume is generally low , and I think Bitcoin needs a lot of volume to break the resistances .
Do you agree with me?
CME Gap: $106,645-$106,295
Cumulative Long Liquidation Leverage: $106,055-$105,430
Note: If Bitcoin manages to break the Support zone($106,800-$105,820), we should expect further declines.
Please respect each other's ideas and express them politely if you agree or disagree.
Bitcoin Analyze (BTCUSDT), 1-hour time frame.
Be sure to follow the updated ideas.
Do not forget to put a Stop loss for your positions (For every position you want to open).
Please follow your strategy and updates; this is just my Idea, and I will gladly see your ideas in this post.
Please do not forget the ✅' like '✅ button 🙏😊 & Share it with your friends; thanks, and Trade safe.

BTC massive sell BTC massive sell is about to begin
Wait for confirmation
Buyers are active in the supply zone
Watch out for potential turning points
To the down or upside.
Proper risk management is advised
Happy trading.

BTCUSDT - UniverseMetta - Signal#BTCUSDT - UniverseMetta - Signal
D1 - Formation of the 3rd wave + potential exit from the channel. Stop behind the minimum of the 2nd wave.
Entry: 107481.70
TP: 111110.12 - 115670.15 - 119641.79 - 126457.32
Stop: 104882.98

Bitcoin (BTC): Buyers Are Back in Control | New ATH Incoming?Buyers have taken full control once again where we had a good bounce near our buy zone. As we approach the local resistance zone, we are expecting to see a proper breakout from here, which would then lead us to a new ATH (around $120,000).
Swallow Academy

BTC - High Probability Trade Idea Here we have a major resistance at this upper level. And market seems to create a "Double Top Patter". So its indicating a possible bearish move.
Target and Sl on chart. Follow risk and money management.
BINANCE:BTCUSDT BITSTAMP:BTCUSD BINANCE:BTCUSDT.P INDEX:BTCUSD BYBIT:BTCUSDT.P BINANCE:BTCUSD

BTCUSDTCryptocurrency Futures Market Disclaimer 🚨🚨🚨
Trading cryptocurrency futures involves high risks and is not suitable for all investors.
Cryptocurrency prices are highly volatile, which can lead to significant gains or losses in a short period.
Before engaging in crypto futures trading, consider your risk tolerance, experience, and financial situation.
Risk of Loss: You may lose more than your initial capital due to the leveraged nature of futures. You are fully responsible for any losses incurred.
Market Volatility: Crypto prices can fluctuate significantly due to factors such as market sentiment, regulations, or unforeseen events.
Leverage Risk: The use of leverage can amplify profits but also increases the risk of total loss.
Regulatory Uncertainty: Regulations related to cryptocurrencies vary by jurisdiction and may change, affecting the value or legality of trading.
Technical Risks: Platform disruptions, hacking, or technical issues may result in losses.
This information is not financial, investment, or trading advice. Consult a professional financial advisor before making decisions. We are not liable for any losses or damages arising from cryptocurrency futures trading.
Note: Ensure compliance with local regulations regarding cryptocurrency trading in your region.
thanks for like and follow @ydnldn to have more information outlook and free signal.
About me :
"I am a passionate swing trader focused on analyzing financial markets to capture profit opportunities from medium-term price movements. With a disciplined approach and in-depth technical analysis, I concentrate on identifying trends, support-resistance levels, and price patterns to make informed trading decisions. I prioritize strict risk management to protect capital while maximizing profit potential. Always learning and adapting to market dynamics, I enjoy the process of refining strategies to achieve consistency in trading."

BTC/USDT Technical Analysis, 2025-07-01 19:30 UTCA bullish trade opportunity was identified after price action formed a Piercing Line candlestick pattern, signaling a potential reversal from recent lows.
🔹 Technical Overview:
Entry Price: 105,869.86 USDT
Take Profit (TP): 106,939.86 USDT
Stop Loss (SL): 104,669.86 USDT
200 EMA: 106,320.49 USDT (Price is trading below — potential dip-buy opportunity)
Pattern Detected: Piercing Line (bullish reversal)
🔹 Volume Context:
Recent candles showed moderate volume with signs of buyer interest increasing.
OBV trend has turned slightly positive, supporting a short-term bullish case.
🔹 Order Flow:
Price action is showing signs of recovery from a local support zone.
Some imbalance in the order book tilted toward buyers, with supportive bid liquidity observed.
This setup combines trend deviation, bullish price action, and support reaction, creating a favorable risk-to-reward scenario. Trade is now active and being monitored toward the defined TP level, with strict stop-loss protection in place.

BTC - Bullish SOON!Hello TradingView Family / Fellow Traders. This is Richard, also known as theSignalyst.
BTC has been in a correction phase, and it feels like it's taking forever! ⏳
As long as the blue trendline holds, the overall bias remains bullish. 📈
As BTC approaches the blue trendline—perfectly aligning with a demand zone and support—we'll be watching for trend-following longs to catch the next big impulse move upward. 🚀
For now, we wait! ⏳
📚 Always follow your trading plan regarding entry, risk management, and trade management.
Good luck!
All Strategies Are Good; If Managed Properly!
~Rich

BTCUSDT Trade SetupBTC Still in sideways no major move, wait for the entries. While on weekly tf still expecting a final shakeout, 95-93k then a final leg up towards to 120k. For now wait for the entries to be filled first then must use sl.

BITCOIN PREDICTION THAT WILL MAKE BULLS CRYI am sharing with you exclusive insights that I am seeing on MARKETSCOM:BITCOIN right now.
WARNING: If you are a bull, you might start crying hysterically while watching this video.

All this just before Fedwire implements ISO20022?#bitcoin #btc price attempted a breakout but today failed with dumps. There "may" be other attempts but while ISO20022 subject is approaching, isn' t it wise to think about #xrp and other ISO20022 licenced coins will overperform the others (BTC, ETH, SOL and all other non iso certified coins) in near future? Not financial advice.

BTC buying power is gradually increasing💎 Update Plan BTC at the beginning of the week (June 30)
Notable news about BTC:
Anthony Pompliano has merged Procap BTC with Columbus Circle Capital I, established Procap Financial - a Bitcoin warehouse company up to $ 1 billion. The company will deploy lending activities, derivatives ... in order to create a collection line from BTC, according to the similar model
Bitcoin price is stable at about $ 107.4K on June 27, before the expiry date of options worth up to US $ 40 billion, capable of causing strong fluctuations. At the same time, on June 29, BTC exceeded $ 108k, up ~ 0.68% compared to the previous day
In the past 7 days, BTC maintained around $ 104–107K despite tensions in the Middle East and the US economic data is not heterogeneous. Reduce slightly but receive support from organized cash flow and global trade progress.
Technical analysis angle
Overview of trends - many signs of increasing
Looking at the candle is signaling "Strong Buy" on many time frames, especially healthy momentum, the ability to breakout $ 116k if surpassed the $ 110k resistance
ETF liquidity and organizational capital flows are supporting the trend of increasing, strengthening the possibility of breakthrough.
Moving Averages:
Frame 1H: 64% Bullish signal (MA20 reversed), but there is a neutral signal from short -term ghosts
Daily/Weekly: Golden Cross (Golden Cross) between 50‑ and 200‑ MA, is a long -term trend increase signal
Oscillators:
RSI frame Daily ~ 55, showing neutral momentum, not too much purchased but there is a rise. Double Rounded Top model on the chart Daily, the current trend is neutral - Bearish if the breakdown supports Neckline ~ $ 106k; In contrast, strong recovery above $ 114k will invalid this model
Long -term / Swing Trade: Keep the position if the price is maintained> $ 106k, use $ 103–104K as a spare hole stop.
Short -term / Scalp Trade: can be in order when the test price is $ 106k–107k, small latches around $ 110k.
==> Comments for trend reference. Wishing investors successfully trading

BTCUSDT 30-Min | Microstructure Breakdown at Key ConfluencePrice Action:
BTC rejected from Fib 0.5–0.618 zone (110.2K–111.5K), aligning with rising channel resistance.
Failed breakout attempt above local highs (~109.6K) → price sharply reversed.
Clean breakdown from rising wedge/channel support (blue) and EMA cluster.
Support/Resistance:
Immediate support at 107.5K (red horizontal) now under pressure.
Next key support: 106.6K zone (channel lower bound, Fib cluster, previous demand).
Resistance remains strong at 109.8K–110.2K (gray zone + trendline).
Indicators:
Volume spike during recent breakdown = bearish confirmation
Multiple consecutive sell signals after EMA flattening = momentum shift
Minor bounce attempts got rejected at descending EMA stack
🎯 Quick Take:
Bias: Bearish below 108.2K
Scalp short active while price is under red horizontal + EMAs
Watch for bounce attempt near 106.6K–106.3K
Invalidation: Clean reclaim of 108.6K + bullish volume

Tripple Top There was a clear Tripple top pattern by BTC from the 1day chart view. According to how to trade Tripple top.
HOW TO TRADE TRIPPLE TOP
Wait for price to fall below neckline (bottom line under mountains).
Boom! Price break neckline = sell
Target:
Measure from top of mountain to neckline
That size = profit distance down
Stop loss:
Put above last mountain (safe from bear attack
No guess. No hope. Wait for break. Then smash sell.

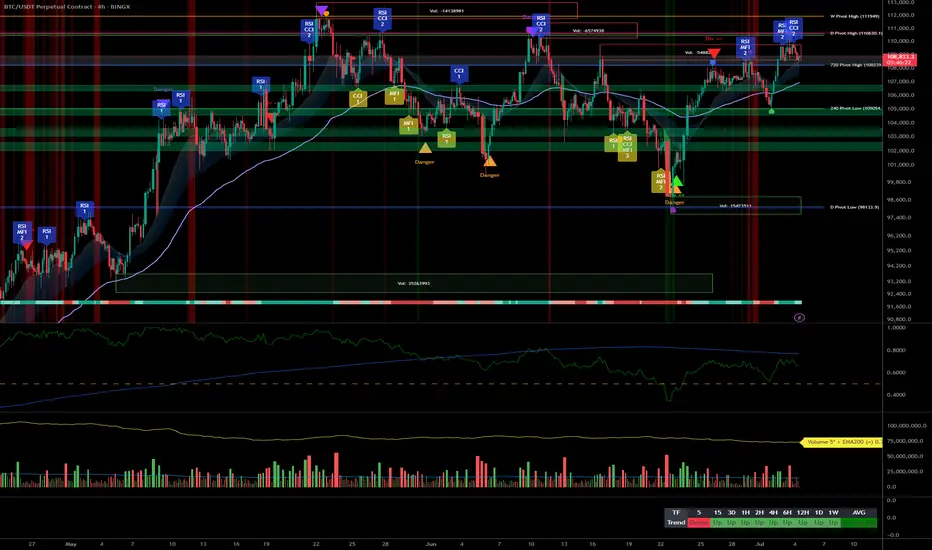
Bitcoin Analysis: Risk under 108k, aiming 111k+ in continuation__________________________________________________________________________________
Technical Overview – Summary Points
__________________________________________________________________________________
Momentum: Strong uptrend across all major timeframes (MTFTI “up”). Buyers remain in control; daily/4H/1H structure robust.
Key supports: 108,239.1 (720min Pivot, critical transversal support), 105,054.7 (240min Pivot), 99,581 (240min Pivot). Active defense seen on 108,239.1 at all timeframes.
Main resistances: 110,630.1 (1D), 110,483.1 (240min), 111,949 (W). The 110–111k area acts as the short-term ceiling.
Volume: Moderate activity, no spikes or climaxes, slight intensification noted on the 30min during key tests.
Risk On / Risk Off Indicator: “STRONG BUY” signal on all Tfs ≥30min, contributing to marked bullish momentum. Minor short-term divergence only on 15min.
Multi-TF behavior: ISPD DIV and Investor Satisfaction are neutral, no extreme behavioral stress; psychology is balanced, neither panic nor euphoria.
__________________________________________________________________________________
Strategic Summary
__________________________________________________________________________________
Overall bias: Bullish, synchronized multi-timeframes, dominant bullish liquidity.
Opportunities: Optimal long entries on validated pullback to 108,239.1, add on breakout of 110,630–111,949. Gradual partial take profit recommended in the 111k area.
Risk zones: Invalidation below 108,239.1 (confirmed H2 close), risk of further correction toward 105k then 99.5k; suggested swing stop under 108,000.
Macro catalysts: No major event, global markets stable. Geopolitical tensions monitored, low short-term impact.
Action plan: Prioritize “buy the dip” on pivots, active monitoring for any breakout/failure. Dynamic stop management, partial profit-taking on extension.
__________________________________________________________________________________
Multi-Timeframe Analysis
__________________________________________________________________________________
1D: Very strong daily structure, high momentum, intermediate supports near 98k/100.5k. Watch for major resistances at 108–111k.
12H/6H/4H: Ranging below 110–111k resistance, no fragility. Supports 108,239.1 and 105,054.7 holding, no selling pressure detected. Watch for breakout/impulse.
2H/1H: Buy zone if maintained >108,239.1, risk of sell-off below this pivot toward 105k. Price is ranging, momentum remains positive.
30min/15min: Consolidation on supports. 15min: temporary divergence on the Risk On / Risk Off Indicator but bullish structure intact unless a clean break below 108,239.1.
Risk On / Risk Off summaries: Dominant “strong buy” tone, synchronized momentum, only weak short-term divergence. No behavioral stress (ISPD DIV neutral everywhere).
__________________________________________________________________________________
Cross-analysis and recommendations
__________________________________________________________________________________
Momentum: Bullish environment sustained as long as >108,239.1. Continued upside bias if breakout above 110–111k is confirmed.
Risks: No major vulnerabilities detected. Very low probability of a local top, except in the case of exogenous macro shock.
Macro & On-chain: Stable newsflow, no distribution from HODLers or significant new inflows. Preferred strategy: swing trading in trend direction, tight stop under the main pivot.
__________________________________________________________________________________
Decision summary
__________________________________________________________________________________
Preferred scenario: Hold long >108,239.1, add on validated pullback, look for breakout with volume extension to 111k+.
Risk management: Stop under 108,000, partial profit-taking in the 110,630–111,949 area.
No immediate macro constraints: Use this calm window to ride the trend.
Monitoring: Resilience of the main support, any sudden geopolitical shocks.
BTC/USDT keeps a clear bullish bias, favoring swing or trend-following strategies as long as key pivots hold. Buy the dips remains optimal while technical structure holds; strict stop management is advised pending any “breakout fail”.
BITCOIN TWO LONG TRADE SETUPS Two potential long trades for Bitcoin are mentioned.
Each trade has an entry point, profit target, and stop loss.
A bullish divergence in the 24-minute time frame is recommended before making the trade.

Skeptic| Cycle Mastery Part 1: HWC, MWC, LWC for Smarter TradingUnderstanding Higher Wave Cycle ( HWC ), Minor Wave Cycle ( MWC ), and Low Wave Cycle ( LWC ) is the key to making informed trading decisions, simplifying when to go long , short , or stay out . This Part 1 masterclass introduces these cycles, their relative nature, and how to align them with your strategy for precise entries and effective risk management . Let’s break it down. 📊
The Three Cycles: HWC, MWC, LWC
We trade across three market cycles:
HWC (Higher Wave Cycle) : The big-picture trend, like Bitcoin’s yearly uptrend.
MWC (Minor Wave Cycle): A medium-term trend, often an uptrend or corrective phase within the HWC.
LWC (Low Wave Cycle): The short-term daily trend, which can be range-bound, uptrend, or downtrend.
Knowing these cycles helps you decide when to e nter long, short, or avoid trading altogether, ensuring you align with the market’s rhythm.
Defining Your Cycles: It’s Relative
The main question before diving in: What timeframes are HWC, MWC, and LWC? The answer is relative—it depends on your strategy. Think of it like a temperature scale: 0°C isn’t “no heat” but a reference point (water’s freezing point). Similarly, your cycles are defined by the largest timeframe you analyze:
HWC: Your highest timeframe (e.g., Weekly for long-term traders).
MWC: The next level down (e.g., Daily).
LWC: Your shortest timeframe (e.g., 4-Hour or 1-Hour).
Ask yourself: What’s the largest timeframe I check? Set your HWC there, then scale down for MWC and LWC based on your trading style. This relativity ensures your cycles fit your unique approach.
While shorter cycles (LWC, MWC) form the HWC, the HWC’s power dominates, influencing smaller cycles. Let’s explore how to trade based on these relationships.
Trading Scenarios: When to Act
Scenario 1: HWC Uptrend, MWC Range
When the HWC is in an uptrend and the MWC is range-bound:
Action: Enter a long position on the first MWC wave when the LWC breaks the ceiling of the MWC range (e.g., a box breakout).
Why? The HWC’s bullish power supports the move, likely triggering an MWC uptrend. This makes the first wave a strong, low-risk entry.
Example: If the LWC (e.g., 4-hour) breaks the MWC range ceiling with a strong candle, you can confidently go long, backed by the HWC uptrend.
Scenario 2: HWC Downtrend, MWC Range
When the HWC is in a downtrend and the MWC is range-bound:
Action: Skip the first MWC wave. If the LWC breaks the MWC range ceiling, avoid going long—the bearish HWC could reject the move, resuming its downtrend.
Wait for the Second Wave: Let the MWC return to a range after the first wave. If the LWC breaks the range ceiling again, go long with confidence—the HWC’s influence is less likely to disrupt this second wave.
Risk Management Tips (if you trade the first wave against the HWC):
Reduce Risk: Lower your position size to minimize exposure.
Take Profits Early: Close the position or secure most profits (e.g., scale out) once you hit your R/R target, as volatility is high.
Wider Stop-Loss: Set a larger stop-loss to account for potential HWC-driven reversals, as stop-loss hunts are common in this scenario.
Adjusting Stop-Loss Size Based on Cycles
Aligned Cycles (HWC, MWC, LWC in Same Direction): When all three cycles align (e.g., all uptrend), set a tighter stop-loss relative to market conditions. Gradually scale out profits instead of closing the position, as the trend’s strength supports higher R/R (e.g., 5 or 10).
HWC Against MWC/LWC: If the HWC opposes the other cycles (e.g., HWC downtrend, MWC/LWC uptrend), use a wider stop-loss. The HWC’s power could reverse the LWC, lowering your win rate if stops are too tight. Expect volatility and plan accordingly.
Final Vibe Check
This Cycle Mastery Part 1 equips you to time MWC waves with precision, aligning HWC, MWC, and LWC for smarter entries. By mastering when to trade the first or second wave, you’ll avoid traps and maximize your edge. Part 2 will dive deeper with examples—stay tuned! At Skeptic Lab, we trade with no FOMO, no hype, just reason. Protect your capital—stick to 1%–2% risk per trade. Want Part 2 or another topic? Drop it in the comments! If this guide sharpened your game, hit that boost—it fuels my mission! 😊 Stay disciplined, fam! ✌️
💬 Let’s Talk!
How will you time your MWC waves? Share your thoughts in the comments, and let’s crush it together!

$BTC Consolidating Before the Next Big Move?CRYPTOCAP:BTC consolidating after a strong bounce!
Bitcoin is holding well above the 106K support zone and forming a tight range just below resistance.
After a false breakout above 100K, the price is compressing just below key resistance at 108100.
This consolidation between 106500 and 108100 looks like a pause, not a top.
If BTC breaks 108100, the next targets are 110500 and ATH.
Market structure is still bullish.
A retest of 106500–105650 is possible before liftoff.
Are you positioned for the breakout?
If you find my updates helpful, don’t forget to like and follow for more!
DYOR, NFA
#BitcoinRecovery

BTC price prediction As my personal analysis if BTC crossing 🚸 110655 without touching the previous high 111960 then BTC moving down 👇 directly or after sideways condition some days

Bitcoin Faces Resistance Rejection — Bearish Divergence Signals Bitcoin is showing signs of exhaustion as it stalls near a high-timeframe resistance level aligned with the value area high (VAH). Recent price action has formed multiple lower timeframe bearish divergences while testing dynamic resistance. This level has now capped further upside attempts and could trigger a market rotation lower if rejected again.
With price consolidating directly beneath this barrier, the probability of a pullback grows stronger, especially if no bullish confirmation breaks the current ceiling.
Key Technical Points:
- Bearish Divergence Developing: Price is holding below the VAH with a weakening momentum signature
- Converging Resistance Zone: Dynamic SR and VAH are aligned at $108,350, now acting as a ceiling
- Range-Based Rotation Setup: If rejected, price could rotate down to the point of control and value area low
Bitcoin’s current structure is classic range behavior, with price gravitating from low to high and back. At the moment, it’s stalled at the value area high, which represents the upper boundary of the most recent range. This level — around $108,350 — has been tested several times, and now a bearish divergence is forming across key momentum indicators like RSI and MACD.
In addition, price is showing multiple rejections against dynamic resistance, forming a pattern of lower highs on lower timeframes. The longer this resistance zone holds, the more likely price will revert to the point of control (POC) — the area with the highest traded volume in the range. If that level doesn’t hold either, a full rotation to the value area low becomes the next probable scenario based on market auction theory.
This rotation would represent a complete cycle from value area high acceptance back to value area low rejection, which is common when buying pressure fades and sellers regain control. For now, Bitcoin remains technically vulnerable as long as price stays capped beneath the $108,350 level.
Bitcoin’s next move hinges on whether it can reclaim the $108,350 resistance zone with volume. If not, expect a corrective phase that targets the POC first, followed by potential continuation down to the value area low. This bearish setup remains valid until price closes decisively above current resistance.

BTC - Reaching to the highest resistance.Bitcoin is approaching its highest resistance zone ever. As it approaches this zone, we need to closely observe the reactions including:
- Price patterns
- Candlestick patterns
- BTC Chart.D
