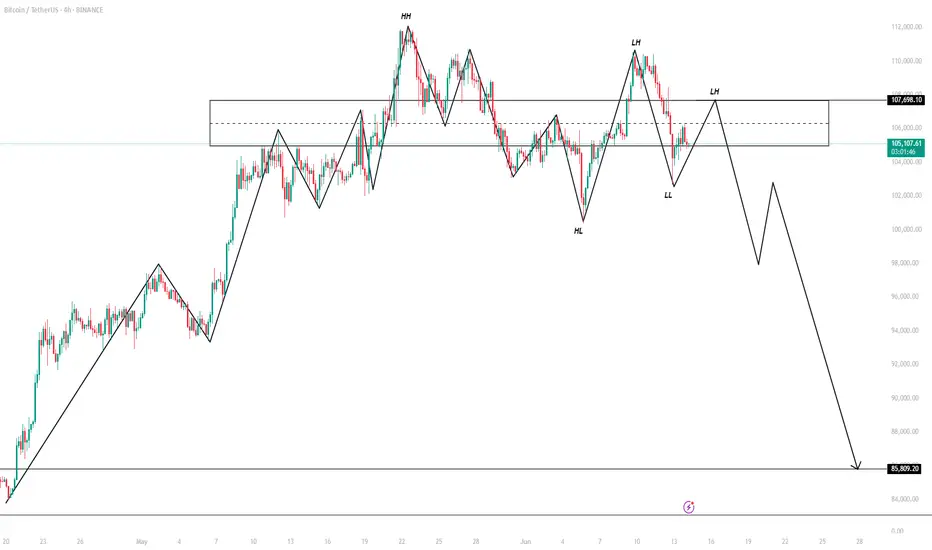
BTC AT DEEP CORRECTION Price failed to break and hold above 111,000, forming a double top or potential lower high structure. Strong bearish drop from 111,000 to 103,500, showing momentum shift to the downside. Likely stop-hunt or liquidity grab below prior lows , Next move will depend on whether it breaks above 107k (bullish) or drops below 103k (bearish).
USDTBTC trade ideas
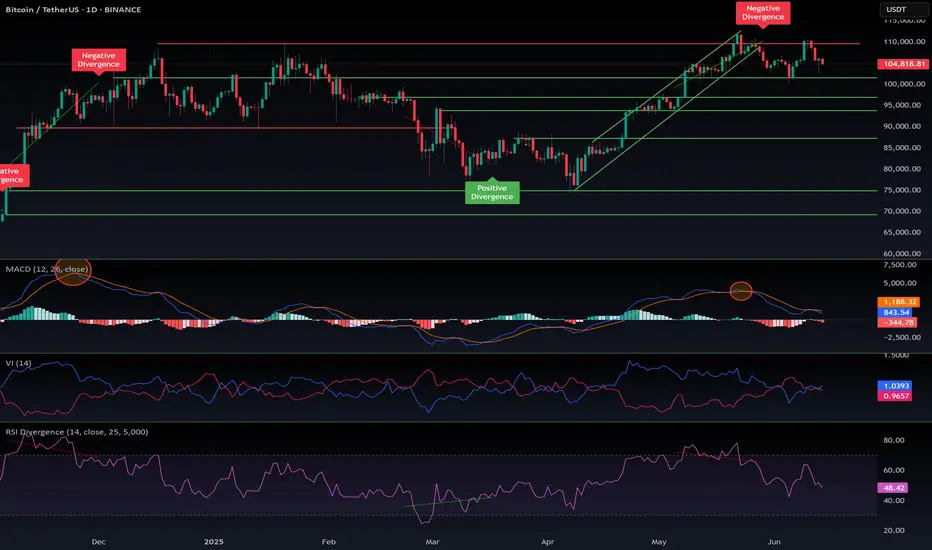
$BTC correction: targets 101k, 97.5k, 94k, 87kThe hype is peaking — institutions, banks, Wall Street, and even governments are buying Bitcoin.
Yet despite the frenzy, BTC has been rejected three times around the $110K level and appears to be heading into another correction.
Bitcoin maximalists are pushing a strong FOMO narrative to attract retail investors, but several factors are pushing back:
- Psychological barrier: At these price levels, retail investors are hesitant. Owning just a "fraction" of a Bitcoin doesn’t appeal to the average person.
- Geopolitical tension: The conflict with Iran is serious. This isn’t a small, isolated country — Iran is a millennia-old civilization with global alliances. This situation won't resolve quickly or easily like Libya, Syria, or Iraq.
- Oil price surge: Escalating tensions could disrupt the Strait of Hormuz, a critical route for global oil. Western sanctions on Russia already strain supply — if Iran joins, where will Europe get its energy? U.S. supply won’t be enough. Expect a spike in inflation.
- Recession risks: Persistent inflation could drive a recession in the second half of the year.
- Trade wars & tariffs: No resolution, just chaos.
- Ukraine-Russia war: Still unresolved. Still draining global stability.
In short, the world is burning — and this is terrible for markets.
Bitcoin maximalists — some even selling company shares to buy more BTC — may soon face the harsh reality: Bitcoin needs a deeper flush before it can rally again. Retail won’t return until altseason clears the way and resets sentiment.
In a cycle dominated by propaganda, institutional manipulation, and global unrest, predictions are fragile. The only guide left: the chart.
Technically, we’re in correction mode again. Comparing with past cycles, potential pullback targets are:
$101K, $97.5K, $94K, $87K
There’s massive support at $74K, but it's unlikely we revisit it soon.
Stay cautious. DYOR.
#Bitcoin #CryptoMarket #BTCUpdate #Geopolitics #Altseason #CryptoCorrection #MacroView #CryptoFOMO #RiskAssets #DYOR
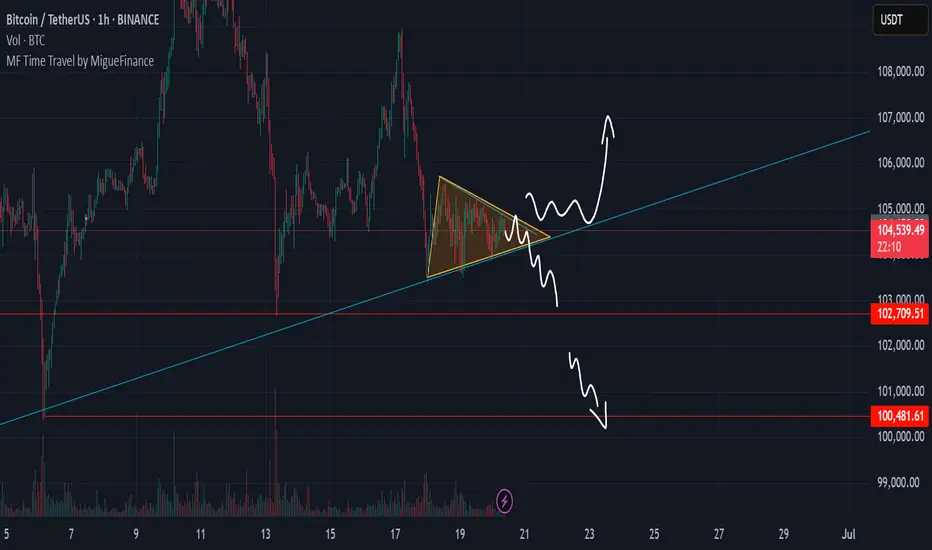
Bitcoin Triangle Pattern, Bullish or Bearish ?We can see LTF bitcoin create mini triangle pattern after downtrend, basically its called bearish triangle continuation. but lets see what is the side will be break
100k vs 107k
Good moment for try to Buy BTCGood moment for try to Buy BTC. Very good down movement and now we make small step of the up. This point can be point for start to move new up trend with update local highest high. Stop to previous local low bar. Will see...

BTC SHORT BEFORE ATHLooking to first short BTC toward the weak low we created during Friday's Asia session. Price left it exposed clean liquidity. If we get the right confirmations.The fake BOS that will take place if we move higher just adds more conviction to my play in the case we do first push towards the daily BPR.
This move would clear the path, set the stage, and potentially give us the entry conditions we want for the higher timeframe play. Where we will be looking for longs towards ATH.
For the HFTF view and what comes after, check the other chart I posted earlier same blueprint, just higher up the ladder.

BTC - Update on Suspected Flash Crash ScenarioFor those of you who have been following my ideas, and I don’t think that would be many - understandably so, because these ideas seem so outrageous and out of the norm - I feel obligated to provide updated numbers per my own personal trade ideas.
I expect BTC to flash crash. In summary, here is why:
1. DXY is breaking down and retesting a major bearish trendline on the monthly. This alongside geopolitical events and sentiment, I expect the dollar to fall rapidly and store of value assets such as BTC to see a multi year bull run.
2. The market has been steadily bringing BTC up since late 2022. This leaves a trail of long position stop losses below the price, leaving a massive chain reaction of sell orders ready to set off one into the next. In other words, the orders required to make the drop are already in the chart.
3. It’s a question of when - BTC is under 3 intersecting bearish trendlines, and we can see how price breaks above and below these support / resistance levels historically. Eventually they will hold and play out, estimating when is tricky - that’s why I use DXY to predict it.
It’s difficult to pinpoint where the upper resistance is - but a pretty solid pick is around 105,200. I’ve used various numbers in the past for this idea, but it’s always refining and evolving based on what I see price doing.
I’m proposing two movements for a massive liquidation sweep of the lows prior to a 3-5 year bull run where BTC sees those quarter million dollar prices.
Scenario 1:
105,200 to 35,000
35,000 retrace to 77,000 ( although this doesn’t have to happen, I just anticipate a 3 wave corrective move)
77,000 to 10,000 (could be as low as 7,000)
7,000 and upwards of 200,000 (after all liquidity is absorbed and reclaimed)
Scenario 2:
105,200 straight down (for the most part) to 17,000 to 20,000
17-20,000 and upwards to 200,000 plus
Personally I feel scenario one is most likely. I’ve been trading this market since 2017 and the newfound “ stability “ of Bitcoin during the last 2 years cannot be trusted. This upwards move IS NOT a bull run. It’s a BEARISH RETEST.
Bearish retests typically move straight up, exactly as what’s been happening - following by a drop roughly 10 times as fast.
Same ideas on the larger time frames as smaller time frames.
WHEN DO I EXPECT THIS TO HAPPEN?
Starting any minute and spanning over the next several days to week.
Anyway - that’s my update for those of you who are interested.
Understand this stuff gets laughed at - but I experienced the same treatment when I told my group to long BTC at 16,500 in Jan 2023 to a target of 90,000. It’s not new to me and I expect it.
Doing my best to help advise and open your minds to alternative ideas.

Bitcoin Crash to $93k is Progressing Well! But be Careful Now!I have explained the price action of Bitcoin, shared my insights on what will happen next, and updated my previous idea on $BTC!
Smash the rocket button if you feel the Bitcoin bearish vibe!

Bitcoin Prediction Update - BTC Crashed as expected! What’s nextBitcoin Crashed as Predicted! I am updating the current price action of CRYPTOCAP:BTC , and if we can reach our main target of $93K! Smash the Rocket Button if you did not completely hate this update! See you very soon again!

Bitcoin sell short go 50k Bitcoin is ready to correct towards $56,000 after the double-top pattern on the weekly time frame.

$BTCUSD: Bull or bear?Choose your adventure gents...
If price breaks up today, it can ignite a daily timeframe trend signal pointing to a rally towards 114k within a few days.
If it breaks down, it will hit 96k within the next two weeks.
I've taken steps to reduce risk but I still trade futures actively in crypto pairs. There's good alpha in my long/short trading system and screening criteria, so I am comfortable trading it actively.
Current techo/fundamental juncture is risky, the way I see it, so if you haven't, maybe consider taking some profits, getting rid of leverage, trailing stops higher, etc.
Definitely not a time to be complacent with record exposure to US stocks from the public and foreigners, Gold hitting levels where it can purchase the same $ in real estate as in previous tops (1980, 2011), and companies buying into crypto to pump their failing business' stocks...to name a few red flags. There's some merit in long term bullish variables, but we might face some technical difficulties before that can materialize, and I rather be prepared by reducing risk in my long term exposure and max drawdown tolerance variables in my positioning and general strategy.
Best of luck!
Cheers,
Ivan Labrie.

16/06/25 Weekly OutlookLast weeks high: $110,507.76
Last weeks low: $102,655.69
Midpoint: $106,581.52
With all eyes on the ever escalating geo-political landscape, how did BTC react and what can we see for this week?
The initial move higher broke through the previous weeks high with strength before a triple top just under ATH, then falling back down towards the lows of $102,650 which was the previous weeks midpoint, both levels were key battlegrounds as pointed out in the last weekly outlook.
Now the midweek fall off could be blamed by the escalating conflict in the middle-east, that is an argument that has merit as risk-on assets naturally take a hit when uncertainty enters the market. From a TA standpoint BTC had three separate attempts at $110,500 and failed it, the bulls therefore have to retreat as the battle is lost and have expended their resources. So I see it as a both FA and TA are responsible for the move.
As the week starts with a positive early move the orderblock at 0.75 line looks like the next key battleground, rejection at that level would see BTC enter a more rangebound environment within the weekly range. Flipping $108,500 makes a weekly high retest probable IMO.
I do believe that the geo-political aspect will play a role this week so volatility is expected.
Good luck this week everybody!

Bitcoin The True king is getting Ready for 130K$It is finally one of those times which happen every few years for Bitcoin and Crypto market and i think personally it is time for a good pump here and for Alt coins.
Major supports now are:
A. 107000$(local support now and here)
B. 102000$(previous daily rejections)
C. 100000$(Major and strong daily support)
After more range or without that soon 114K$ will break to the upside and next strong moves will start there because so many stop loss of sellers and new sellers there can bring good liquidity too.
DISCLAIMER: ((trade based on your own decision))
<<press like👍 if you enjoy💚

Bitcoin Short-Term Recovery Confirmed Bulls Win!Ranging markets/sideways markets is when traders lose the most money. Always keep this in mind.
» Short-term signals are pointing to a recovery right away.
» Bitcoin's drop wicked below the 13-June low but the RSI produced a higher low and thus we have a bullish divergence.
» Bitcoin's current drop went lower yet the chart reveals lower volume now compared to 13-June. This reveals weakness on the bear camp. This means a recovery will happen next, right away.
These are just a few signals but taken together with the altcoins analysis that I showed you and the bigger picture; Ha ha! The bulls win again.
Namaste.

Bitcoin Short-Term 4H Timeframe, Still Bullish But...Bitcoin continues bullish on the 4H timeframe and we have some positive signals coming out of the most recent swing and shakeout.
» The action went below 0.618 but is back above this level.
» The higher low did not reach 0.786 Fib. retracement support, which is a signal of strength.
» Trading volume continues to rise and as the action happens above $100,000, this signal works in favor of the bulls.
Short-term, Bitcoin continues green with the bulls in full control of the chart. When in doubt, zoom out; Crypto is going up.
This is obviously a consolidation pattern because we have higher lows but also lower highs. The revealing signal of course comes from the altcoins, look at Bitcoin Cash and you can get a good example.
The market will resolve bullish once the consolidation ends.
I say this based on market data and the charts.
If you agree leave a comment.
Thank you for reading.
Namaste.

Bitcoin (BTC): Bullish, But Don't Buy Yet! Here's Why.Hello, traders! 👋 Let's break down the current situation with Bitcoin .
🔍 Overall Bias: Bullish
Bitcoin has confirmed its intention to continue the bullish trend towards a new All-Time High ( ATH ). This comes after a successful sweep of Sell Side Liquidity (SSL) and a confirmation of the bullish daily structure.
Price has already corrected into a discount zone, which is generally favorable for buys. But wait! Don't rush to open long positions just yet.
🐳 The Whale's Game Plan
The large players have a crucial Point of Interest (POI) below us — a 4h order block . This specific order block is what engineered the SSL sweep, making it a powerful support level and a magnet for price.
To sweep that liquidity and trigger the stop-loss orders of retail traders, the "whales" had to open short positions. Now, to continue the uptrend, they need to close those shorts at break-even or a small loss. The 4h order block is the perfect place to do that.
My Trading Scenarios
1️⃣ Primary Scenario: The Ideal Entry
I expect a mitigation of this 4h order block. I will be closely watching the price reaction around this POI and the 78.6% Fibonacci retracement level .
If the level holds and we get a Lower Timeframe (LTF) confirmation (e.g., the beginning of a bullish order flow), long positions could be considered.
🎯 Potential Long Entry Zone: ~ $102,745 - $103,868
2️⃣ Alternative Scenario: The Retail Trap
Price might not drop to our POI immediately. It could first bounce from the current levels, luring impatient retail traders into long positions. After that, a sharp drop could shake them out before the real move up begins next week, targeting the Previous Month's High (PML) as a minimum objective.
Conclusion
Patience is key. We need to watch the actual price behavior and reaction once the "whale" delivers the price to our POI.
This is not financial advice. My analysis is for educational purposes only.Hello, traders! 👋 Let's break down the current situation with Bitcoin.

Everyone Talks Charts — But the Order Book Knows FirstHello, Traders! 🤓
Everyone watches the chart. But not everyone watches the market itself. If you’ve ever wondered why the price suddenly jumps or stalls just below resistance, you’re likely looking at the surface, not the structure underneath. And that’s precisely what DOM in trading helps to reveal.
What Is DOM Trading?
Let’s start with the basics. DOM stands for Depth of Market, which shows real-time limit buy and sell orders at different price levels. Some traders call this the trading DOM. Unlike a candlestick, which tells you what already happened, the DOM trading view shows what participants intend to do. This makes it useful for those trying to understand short-term moves, liquidity pressure, or even the psychology behind a specific level.
So if you’re asking, “What is DOM in trading?” or “How does DOM work in crypto?” – it’s essentially a live x-ray of the market’s limit order book.
Order Book Trading in Crypto
The order book, the live list of buy and sell orders, acts like a constantly updating roadmap of trader intentions. In order book trading, it’s not just the numbers that matter but how they shift. For example, traders often notice thick sell walls near round numbers (e.g., $70,000 BTC), sudden order pulls, which can fake out breakout traders, and absorption, where big buy/sell orders are filled silently, without noticeable price change… When analyzed properly, this behavior gives context to price action, something traditional indicators can’t always offer.
How to Use Crypto Trendlines… and Then Watch DOM
Drawing trendlines in crypto is common. Everyone has their version of a breakout setup.
But what happens when the price reaches that line? That’s where DOM trading shines.
It doesn’t predict whether the line will hold or break, but it shows whether liquidity is building or backing away right at the critical moment. The combination of crypto trendlines and DOM behavior often exposes subtle market dynamics, a large bid appearing just as price touches support, for instance, or offers vanishing before a breakout.
That’s not about strategy. It’s about market structure awareness, watching both the levels and the surrounding behavior.
Chart vs DOM: Two Sides of the Same Story
The crypto psychology chart tells you what’s happened — highs, lows, closes. The DOM, on the other hand, shows live trader psychology. And that’s where the psychology of crypto trading gets interesting.
When everyone’s waiting for BTC to hit $100K, for example, you might already see: Buyers are stacking bids at $95K, hoping for a retrace. Sellers layering offers at $99.9K, defending the level. And the sudden orders near $100K, a possible trap. In this way, round numbers in trading aren’t just emotional, they’re structurally significant. Especially in crypto, where the market cap is still heavily influenced by sentiment.
Final Thought
Some traders find it useful to spend a few sessions just observing the DOM. Psychological numbers in trading, like $10K, $20K, or even the famous 100K BTC milestone, are often surrounded by unusual order book behavior. So, the next time price seems to move “out of nowhere,” ask yourself: Was it really out of nowhere… or did the DOM in trading already whisper it?
You don’t need to trade based on it. But knowing how to draw trendlines in crypto and then pairing that with DOM behavior can offer a sharper view of where the market might hesitate, reverse, or run. Sometimes, seeing how others are placing their bets matters more than where. What do you think?

Bitcoin Eyes $108K as Momentum Gathers on Lower Timeframes
Bitcoin traded between $105,971 and $106,032 over the past hour, with a market cap of $2.10 trillion and 24-hour volume of $21.88 billion. The price fluctuated between $104,004 and $106,450 over the past 24 hours, reflecting a narrow intraday range consistent with technical uncertainty on larger timeframes.
Analysis of the 4-hour Bitcoin chart shows a weak recovery phase from the recent drop to $103,388. The volume profile shows an ascending candlestick indicating increased interest, accumulation, and momentum. The rounding bottom structure shows a possible shift in short-term sentiment. Buying power is visible in the $105,500 to $106,000 region, especially when $106,500 is breached forcefully.
Bitcoin Price Watch: Bulls Target 108K as Momentum Grows on Lower Timeframes
BTC/USD daily chart on Bitstamp on June 20, 2025.
Technical indicators offer mixed signals. Among oscillators, the Relative Strength Index (RSI), Stochastics, Commodity Channel Index (CCI), Average Directional Index (ADX), and Ultra Oscillator are neutral. However, the Momentum Oscillator shows positive sentiment, while the Moving Average Convergence Divergence (MACD) shows negative reinforcement, highlighting the inherent contradiction in the directional trend. The moving averages (MAs) are generally biased bullish, with most short- to long-term indices and simple moving averages showing positive signals. Notably, only the 30-day simple moving average is contrary to this, with a negative reading.
In conclusion, while the intraday chart shows a constructive tone and provides opportunities for short-term positioning, the broader trend remains directionless with potential bearish risks. Unless Bitcoin reclaims the area above $110,000 with sustained volume, caution is advised. Traders would be wise to maintain tight risk control and focus on intraday momentum trading as the current daily pattern evolves.
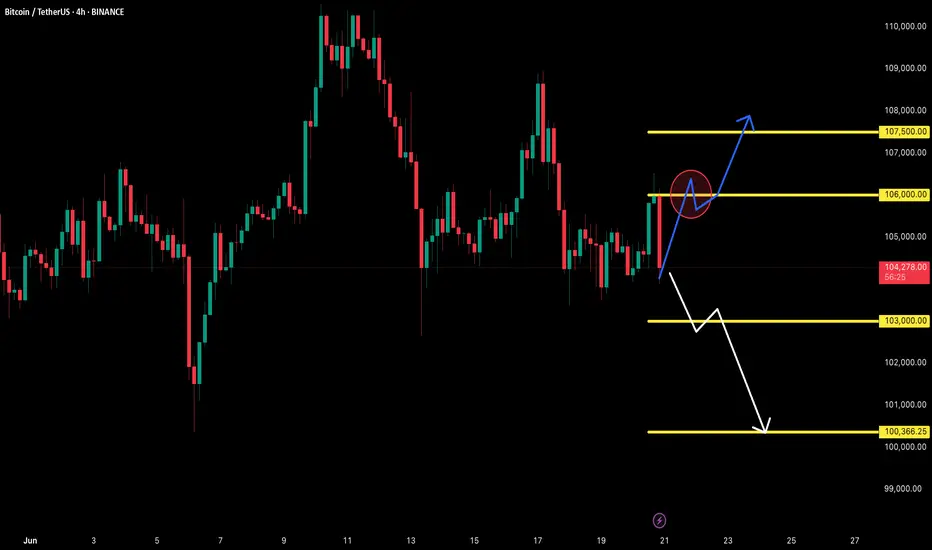
Upside view:
If Bitcoin maintains momentum above $106,000 and breaks out of $106,521 convincingly, short-term traders can take advantage of a bullish setup with a target of $108,000 to $109,000. The alignment of buy signals from most moving averages further supports the potential for continued upside provided that the breakout is confirmed by volume and $107,500 is re-reached on a daily close. However, a failure to break out of $107,500 or a fresh sell-off around $106,450 could trigger a pullback to the $103,000 to $100,426 support zone, especially if the volume decreases at this point and the MACD confirms the bearish momentum.
long trade
🟢 BTCUSDT – Buyside Trade
Date: Sunday, 15th June 2025
Session: NY Session PM
Time: 5:00 PM
Entry Timeframe: Precision Intraday Entry
Trade Parameters
Entry: 104,502.89
Take Profit: 105,567.08 (+1.02%)
Stop Loss: 104,377.60 (−0.12%)
Risk-Reward Ratio (RR): 8.49
🧠 Trade Reasoning
BTCUSDT showed a textbook liquidity sweep and recovery during the NY PM session, grabbing lows below 104,400 before swiftly reversing. The entry at 104,502.89 was taken on confirmation of short-term bullish structure reclaiming the range low.

BTC: Scalp Long 14/06/25Scalp Long
Risk is halved because weekend
Then additionally halved because counter HTF Trend =
0.25R Risk
Reason:
0.886 retrace
M5 EQL swept
M5 Ts
M15 Bull Div
H1 Bull Div
Still hoping we get a 106,700 retest. For HTF Higher probability shorts.

#BTCUSDTbearish side of the btc is slow, as the volume of sell is not that high...…any strategy doesn't fit the lower low, i am seeing btc to the 132k.
anyone overthere with a new different strategy regarding btc?

bitcoin btc shortshort entry :107.300 , STOP LOSS: 108.400 , PROFIT TARGET 101.000
RR 1:5 BINANCE:BTCUSDT.P

BTC is Bullish!Hello TradingView Family / Fellow Traders. This is Richard, also known as theSignalyst.
📈BTC has been overall bullish trading within the rising channel marked in blue.
Moreover, the red zone is a strong structure!
🏹 Thus, the highlighted blue circle is a strong area to look for buy setups as it is the intersection of structure and lower blue trendline acting as a non-horizontal support.
📚 As per my trading style:
As #BTC approaches the blue circle zone, I will be looking for bullish reversal setups (like a double bottom pattern, trendline break , and so on...)
📚 Always follow your trading plan regarding entry, risk management, and trade management.
Good luck!
All Strategies Are Good; If Managed Properly!
~Rich

BTC/USDT–Technical Analaysis Setup#Bitcoin is currently forming a bearish harmonic pattern indicating a potential correction toward key support zones.
📉 The price action suggests the development of a Gartley pattern with projected downside targets around $103,679, $101,931, and possibly extending to $97,419.
A critical resistance zone between $105,000 and $106,000 will be pivotal for either confirming bullish momentum or triggering a bearish reversal.
If BTC fails to break through this resistance and confirms the bearish reversal signal, a deeper decline toward the aforementioned support levels becomes highly probable.
🎯 Target 1: $103,679
🎯 Target 2: $101,931
🎯 Target 3: $97,419
