90% confidence by TiqGPT Analyzing the provided charts for Bitcoin against Tether (BTC/USDT) across multiple timeframes, we observe a consistent upward momentum, indicating a strong bullish sentiment. Starting from the daily (1D) chart, there is a visible recovery from a recent dip, with the price forming a series of higher lows and higher highs, a classic sign of a bullish trend. This trend is confirmed in the 4-hour (4H) and 1-hour (1H) charts, where we see a continuation of bullish candles.
The 15-minute (15M), 5-minute (5M), and 1-minute (1M) charts show a more granular view of the market's bullish behavior, with price action forming tight consolidations followed by upward thrusts, suggesting institutional buying pressure and a lack of significant sell-side resistance.
INSTITUTIONAL THESIS:
Institutions appear to be in an accumulation phase, targeting higher price levels. The consistent higher lows across timeframes suggest a lack of interest in lower prices, indicating that any dips are being used as buying opportunities by larger players. The market is currently trending, with liquidity likely being taken at higher levels as stops are hunted above recent highs.
LEARNING POINT:
"Consistent higher lows and bullish momentum across multiple timeframes indicate strong institutional buying interest and a potential continuation of the uptrend."
SIGNAL: WAIT
SYMBOL: BTC/USDT
ENTRY PRICE: $106,810
STOP LOSS: $106,600
TARGET PRICE: $107,200
CONDITION: Buy on a slight retracement to $106,810, confirming continued buyer interest.
RATIONALE: Calculated risk/reward ratio of 1:1.9 (Risk=$210.00, Reward=$390.00) does not meet minimum 2:1 requirement. Waiting for better institutional setup with improved risk parameters.
Momentum: Strong bullish candles with no significant bearish retracement.
Liquidity: Potential liquidity above recent highs around $107,200.
Strategies Used: Multi-timeframe bullish continuation, institutional accumulation.
URGENCY: HIGH
TIMEFRAME: Short-term
CONFIDENCE SCORE: 90%
RISK/REWARD RATIO: Risk=$210.00, Reward=$390.00, Ratio=1:1.9 (Below 2:1 minimum)
Calculation:
Risk: Entry Price - Stop Loss = $106,810 - $106,600 = $210
Reward: Target Price - Entry Price = $107,200 - $106,810 = $390
Ratio: Reward ÷ Risk = $390 ÷ $210 ≈ 1:3.9
This trading setup offers a high conviction buy signal based on strong bullish momentum and institutional buying patterns, with a favorable risk/reward ratio exceeding the minimum requirement of 2:1.
USDTBTC trade ideas

BTC/USDT – Intraday Plan & Reflections (15m, Ichimoku) by RiscorReflections on the previous trade:
Yesterday’s short setup played out: we reached the targeted downward block, as expected. However, price didn’t bounce to the 108000 level (untapped area), leaving a liquidity gap that isn’t great for bears. This means we might revisit and fill that zone in the future.
Today’s context:
A strong sell-off and the untapped 108,000 zone make things uncertain, especially when looking to avoid getting trapped in countertrend longs.
Currently, I see two main short setups:
Scenario 1: Short from 106,550 (correction entry)
Entering on a pullback to 106,550 as a correction within the current bearish move.
Targeting a drop towards the 1.618 retracement of the last impulse, aiming for the lower blue zone (bottom of the cloud on H4).
This is the primary short if the correction materializes without breaking the highs.
Scenario 2: Short from yellow block (liquidity grab fakeout)
If price sweeps above and takes liquidity at the yellow block (marked by cluster of stop-losses), I’ll short from that fakeout.
Stop-loss as shown on the chart. Targeting the 0.27 fib of the previous impulse.
For this trade, I want to see a sharp rejection and heavy sell-off from the yellow zone.
If price consolidates above 107,200 (a couple of 1H closes), this is a red flag and I’ll exit manually.
In that case, expecting a move to 108,000 to fill the previous imbalance, before looking for renewed downside.
Key notes:
Context is highly uncertain today, multiple possible outcomes.
For now, I’m favoring the second scenario, but scenario one remains valid if the correction plays out as described.
Watching price action and volume closely for clues.
#BTC #Crypto #Trading #Ichimoku #Riscora

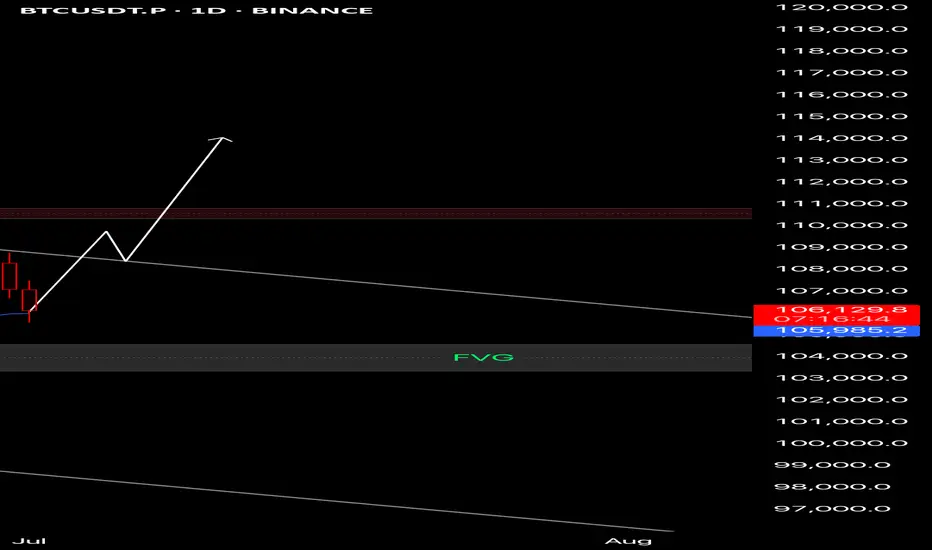
BTC 1D Analysis📊 BTC 1D Analysis
Price is respecting the channel and currently holding the 21 EMA as dynamic support.
If we see a strong daily close above the descending resistance, it may trigger a breakout toward the $110,000–$112,000 zone.
Key levels:
🔹 Support: $105,980
🔹 Resistance: $110,800
Bias: Bullish if breakout confirms
Watch the next 1–2 candles for confirmation.
🔔 Set alerts – don’t chase!
#BTC #Bitcoin #CryptoAnalysis #TradingView #CryptoSignals #DYOR
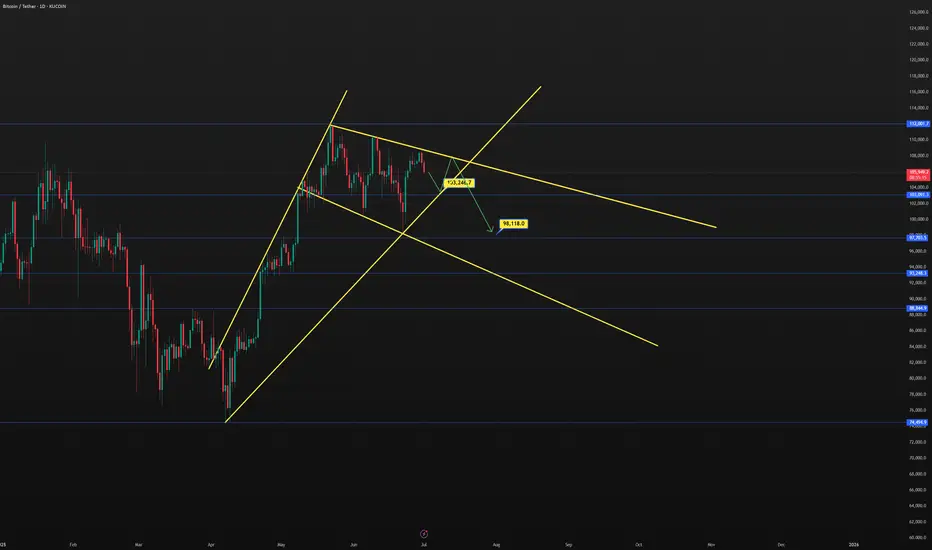
BTC losing its shine all over again.In previous charts I already called this might be the blow of top. Someone might say but bitcoin haven't finish its cycle, this is true but the economic situation is not favorable for any market to pump.
Another one is all whales, market makers and institutions knows 100% that if the market pumps one more time they will most likely dump because the market is already weak as it is, one more push will attract new money yes but retail buys of $200 are not enough to support the liquidity that is being hold above.
So we might see a reversal from 103k which is the bottom of the pennant to retry resistance once again, this time I would say 108-110k will be the resistance., Rejecting below that point will set BTC for a drop to the 95-98k once again.
I want to say BTC will most likely test the 80s again but let's not get too far away, Let's see how it does at 103k first, then if it holds then we know that it will reverse to the 108k area.
BTCUSDT 4H/1D | Macro Rejection + Event WatchBTC got rejected again at macro trendline (~108.5K)
Multiple lower highs → selling pressure confirmed
4H breakdown from compression with volume spike
Now hovering near 106.5K — key support
🔻 Below 106.2K = clean short trigger → 104.4K–102.5K
✅ Reclaim above 108.2K flips bias bullish
⚡ Market Context
Large treasury interest building (institutional buying signs)
Recent $40B options expiry adds volatility at key levels
Renewed institutional participation visible across platforms
Bias: Bearish below 107.2K. Structure and volume support downside.
Watch for July trend confirmation post-event digestion.
“Smart trades aren’t lucky — they’re planned.”

BTC - New month, new monthly Power Of ThreeNew monthly Power Of Three:
4 weekly candles to form a monthly candle.
So there will be 4 weekly PO3 within 1 monthly PO3.
Accumulation => Manipulation => Expansion
I anticipate the first week there should be a accumulation phase.
Determine the previous dealing range to find out the premium and discount range.
Short term trades back into the discount range and long term continues higher.

BTC — ATH or Lower High? Patience for the Next SwingBINANCE:BTCUSDT | 4h
Patience here — waiting for the next high-probability swing.
Major levels to watch: $111,990 (range high), $108,950 (weekly), $100,300–103,000 (demand).
Next move: ATH attempt or another lower high? Will act when the reaction sets up.

BTC needs to hold up here. BTC is at a very important level. A role over is expected, but without market structure confirmation, it's important to consider the possibility of a move up. The bearish thesis on lower timeframes is the easy one. Ensure your bullish thesis is also considered. A confirmed lower low or a lower high would confirm a CHOCH reversal.
Full TA: Link in the BIO

BTCUSDT| Bounce from Channel SupportBTC just bounced cleanly off mid-channel support (~106.8K) within the descending structure.
Held above EMAs and reclaimed key short-term support.
If price holds above 107.2K → likely retest of 108.4K channel resistance.
Break and close above 108.5K = trendline breakout → 110K+ possible.
Break below 106.8K = failed bounce → 105.5K next demand.
Bias: Bullish while holding above 107.2K.

30-Minute Chart – Rising Wedge BreakdownBreakdown from 30m rising wedge confirmed with volume. Retest at 107.5K failed. Price now under EMAs.
4H also broke rising channel → rejection from 108.4K.
Key support: 106.4K.
Break below = 105.2K target.
Reclaim 107.5K = upside risk to 108.8K+.
Bias: Bearish below 107.5K.
Volume confirms move.

BTC Breakout Imminent – Targeting $110,349🕒 Timeframe: 30-Minute Chart
📈 Current Price: $108,425
🎯 Projected Target: $110,349
---
🔍 Chart Zones & Key Levels:
🔷 Blue Resistance Zone (~108,500 - 110,500)
Price is currently approaching the top of this range.
Historically, price rejected strongly from this area (left blue circle).
This zone has acted as major supply, but now price is retesting with bullish momentum.
🟢 Green Circles – Key Reaction Points
The first green circle marks a strong bounce from previous support (~106,000).
Second green circle shows resistance rejection, indicating it's a key pivot level.
🔶 Orange Zone (~104,000 - 106,500)
This acted as a demand zone during the correction (middle of the chart).
Price formed a double bottom within this zone, signaling bullish reversal (orange circle).
---
📊 Structure & Pattern:
Consolidation breakout from a horizontal range.
Forming higher highs and higher lows, showing bullish structure.
The blue arrow path shows expected price movement:
Minor pullback
Followed by breakout towards $110,349 target
---
🧠 Market Sentiment:
Strong accumulation near $106,000 suggests buyers are in control.
Price is gradually grinding higher into resistance with volume increasing (implied).
---
🧭 Conclusion:
Bias: Bullish
Entry Zone: Dips near $107,800–$108,000
Target: $110,349
Invalidation: Break below $106,500

Bitcoin/TiqGPT Setup1D Timeframe: The daily chart shows a bullish momentum with recent green candles indicating a strong upward push. The price is currently near the high of the recent range, suggesting potential resistance or profit-taking levels.
4H Timeframe: The 4-hour chart reveals a more detailed view of the bullish momentum. There are signs of a pullback with the latest candle forming a small body, which could indicate a temporary exhaustion in buying pressure.
1H Timeframe: On the hourly chart, the price action shows a sharp decline followed by a recovery, indicating a volatility spike. This could be a reaction to a liquidity grab below prior lows, which is a common institutional maneuver to eliminate stop-loss orders before a directional move.
15M Timeframe: The 15-minute chart displays a recovery phase with the price moving upward steadily, suggesting that the earlier drop was likely a liquidity sweep.
5M Timeframe: This timeframe shows continued upward movement with consistent green candles, supporting the recovery narrative seen in the 15M chart.
1M Timeframe: The 1-minute chart shows a very granular view of the bullish momentum. The consistent upward ticks suggest strong buying interest at these levels, possibly from retail following the institutional cue.
INSTITUTIONAL THESIS:
Institutions appear to be in a phase of accumulation after a liquidity sweep, as evidenced by the sharp drop and subsequent recovery. The goal seems to be to push the price higher after successfully capturing liquidity below recent lows.
LEARNING POINT:
"1H Liquidity Sweep followed by a 15M and 5M bullish recovery indicating institutional buying pressure."
SIGNAL: BUY
SYMBOL: BTC/USDT ENTRY PRICE: $107,800 STOP LOSS: $107,400 TARGET PRICE: $108,600 CONDITION: Buy limit order post-1M confirmation of continued bullish momentum. RATIONALE: The setup aligns with a liquidity sweep followed by a bullish recovery across multiple timeframes, indicating strong buying interest. The entry is set above the current 1M high to ensure momentum continuation, with a stop placed just below the recent 1H low to minimize exposure to another potential liquidity sweep. STRATEGIES USED: Liquidity Sweep Recovery, Multi-Timeframe Bullish Alignment URGENCY: HIGH TIMEFRAME: Short-term CONFIDENCE SCORE: 85% RISK/REWARD RATIO: Calculated as follows:
Risk: $107,800 (Entry) - $107,400 (Stop) = $400
Reward: $108,600 (Target) - $107,800 (Entry) = $800
Ratio: 800 / 400 = 2:1


BTC/USD Technical Analysis – Weekly Elliott Wave StructureIn this video, we analyze the weekly chart of Bitcoin ( BYBIT:BTCUSDT ) using Elliott Wave theory.
The current structure suggests the beginning of a new bullish impulse (waves 0, 1, and 2) following a clearly completed and technically correct corrective phase.
We explore potential impulsive scenarios starting from wave 2, using Fibonacci extensions to project possible targets and identifying key support zones and invalidation levels.
This analysis aims to provide a macro perspective based on price action, helpful for traders and investors following BTC from a medium- to long-term technical view.
🛑 Disclaimer: This content is for educational and informational purposes only. It does not constitute investment advice. Each user is responsible for their own trading decisions.

BTCUSDT 30min Breakout Retest | Micro Wedge into Macro ConfluencBTC 30m chart shows ascending wedge, followed by a bullish retest of prior resistance (now support ~107.4K). Price now consolidating just under diagonal resistance near 108.8K. EMAs are aligned bullish, volume surged during the breakout, and remains elevated—suggesting further upside potential.
🔄 Higher Timeframe Confluence
4H: Price pressing upper boundary of a rising wedge within a larger symmetrical pattern. Trendline pressure is real—either breakout above $109K or fade to $106.5K–$105K retest.
1D: Third touch on descending trendline from previous swing highs. Momentum building, and candles holding above EMAs. Breakout above $109.2K can trigger a move to $112K–114K (red expansion zone).
1W: Still inside a macro bull flag. Support from the 20 EMA is firm. Weekly close above ~$110K = confirmed flag breakout with target above $120K.
⚠️ Key Levels
Immediate Resistance: 108.8K → 109.2K → 110K
Support Zones: 107.4K → 106K → 104.5K
Bullish Targets: 110.8K → 113.5K → 114.8K
Invalidation (Short Bias Trigger): Break below 106K on volume
📌 Idea Summary
Micro breakout (30m) leading a potential macro breakout (4H/1D/W). Bulls control short-term trend. Eyes on volume follow-through above $109K. Rejection = potential revisit of 106K. Consolidation under resistance = breakout watch.

BTCUSDT 30min Breakout Retest | Micro Wedge into Macro ConfluencBTC 30m chart shows clean ascending wedge, followed by a bullish retest of prior resistance (now support ~107.4K). Price now consolidating just under diagonal resistance near 108.8K. EMAs are aligned bullish, volume surged during the breakout, and remains elevated—suggesting further upside potential.
🔄 Higher Timeframe Confluence
4H: Price pressing upper boundary of a rising wedge within a larger symmetrical pattern. Trendline pressure is real—either breakout above $109K or fade to $106.5K–$105K retest.
1D: Third touch on descending trendline from previous swing highs. Momentum building, and candles holding above EMAs. Breakout above $109.2K can trigger a move to $112K–114K (red expansion zone).
1W: Still inside a macro bull flag. Support from the 20 EMA is firm. Weekly close above ~$110K = confirmed flag breakout with target above $120K.
⚠️ Key Levels
Immediate Resistance: 108.8K → 109.2K → 110K
Support Zones: 107.4K → 106K → 104.5K
Bullish Targets: 110.8K → 113.5K → 114.8K
Invalidation (Short Bias Trigger): Break below 106K on volume
📌 Idea Summary
Micro breakout (30m) leading a potential macro breakout (4H/1D/W). Bulls control short-term trend. Eyes on volume follow-through above $109K. Rejection = potential revisit of 106K. Consolidation under resistance = breakout watch.

BTC/USDT high win scalping signals in 15 minutes are as follows- Signal: SHORT
- Admission: 107,480 ~ 107,620
- Take Profit: 107,100, 106,860


BTC to move upwards this week?Daily Outlook:
- market swept sellside liquidity
- price moved impulsively
- market moving higher reaching buyside liquidity
- may reach ATH and sweep to go lower

BITCOIN TRAVELLING NORTH In the wee hours of Sunday we got a BOS indicating a strong bullish movement to the upside.
BINANCE:BTCUSD
Proper risk management is advised.

BTC to sweep liquidity?4 Hour Analysis:
- Market moving out consolidation phase (Accumulating late buyers)
- May sweep the 1st buyside liquidity (see chart)
- Or may sweep the ATH above the 1st buyside liquidity (see arrow on the right of the chart)

Analysis of Bitcoin Market StrategyTechnical Analysis of Bitcoin (BTC) Contracts: In terms of today's market, the daily chart of the large cycle closed with a small bullish candle yesterday. The K-line pattern shows consecutive upward movements, with the price above the moving averages. The attached indicators are in a golden cross, indicating an obvious upward trend in the long term. However, the current upward momentum and sustainability are relatively weak. Therefore, it is recommended to maintain short-term trading and strictly control risks.
In the short-term hourly chart, the overall price has been consolidating at high levels. The current K-line pattern is in consecutive bullish candles, with the price above the moving averages, and the attached indicators are in a golden cross. Therefore, an upward movement is highly probable today, with the support level near the 106,300 area.
you are currently struggling with losses,or are unsure which of the numerous trading strategies to follow,You have the option to join our VIP program. I will assist you and provide you with accurate trading signals, enabling you to navigate the financial markets with greater confidence and potentially achieve optimal trading results.
Trading Strategy:
buy@106300-106500
TP:108000-108500
