BTC 4HWe are in a week where volatility is expected to increase in BTC. A movement like the one on the screen may occur. Definitely use stops during this period. We are in a period when it is very difficult to analyze the market. We have become a market that moves with a lot of news. The market will surprise investors before the bull comes. Therefore, pay more attention to your stops than ever.
USDTBTC trade ideas

BTC in DistributionHi everyone. I am going to be moving my trading commentary back to Ideas rather than Minds so I can stay focused during the day, as well as having the added benefit of retrospective analysis. I do not trade BTC but have been tracking the price recently and believe it is gearing up for a big move. The current structure supports a bearish bias based on the Wyckoff Distribution pattern, which the price has been following in a textbook fashion. If this pattern continues, I believe Bitcoin will enter a bearish trend.
For the indexes I will try to post ideas for a bullish and bearish bias but for this quick post on Bitcoin, I am going to stick to the bear side.
Using Renko (Traditional, $500 window size) as my main chart, you can see the price broke out of a strong uptrend after the peak on May 22 (Buying Climax) and entered a potential distribution pattern. The secondary test (ST) set the lower band of the resistance zone, which the price has been testing and rejecting up until this point.
The labels are subjective but what we can confirm is that the price has broken through the bottom range (Sign of Weakness or Spring) but has been unable to break through the top of the range. An upthrust/false breakout above the top of the range would be a key level to go short, as this would take out the last remaining buyers, however the price continuing to stay below the resistance could be a sign of persistent weakness.
A rejection here would suggest that we are in Phase C, which is where momentum will build up on the sell side, eventually pushing the price through the bottom of the range and into a bearish trend.
Since Renko is the smoothest chart, I am also using range bars (less smooth) and standard candle sticks (most noise) to analyze closer setups.
On the range chart (20000R or $200), the price looks to be in an inverse cup and handle pattern, which if it holds would support the idea that we are in Phase C of the distribution pattern and the price will fail to break above the range again. Volume indicates that there is low interest at the upper levels, which resulted in the price moving down in Friday. We could see another push down after another period of low interest at the upper level.
Lastly, the 1h candle chart shows that the price has been relatively flat since June 25th and is being supported by a large volume node on the Volume Profile. There was large buying volume at the lower level, so if the price can stay above this node (~$106,700) there is a good chance that it will get pushed above the range, however if sellers are able to push it through this level of high volume, further downside could follow. This is why I would suggest waiting to see if this level holds before entering a trade. A false upside breakout (above $112,000) would be a safe area to go short, as it would be a quality setup with good risk/reward.
If the price is in Phase C and cannot break above the range, it would be a less ideal short setup, as the market could make a push to the top of the range at any time to clear out buyers. If this were to happen, I would prefer to wait for more confirmation.
To conclude, my idea here is:
Short (Solid Line): False breakout above $112,000 (preferred) or below $107,000 (higher risk)
Long (Dotted Lines): True breakout above $112,000 (preferred) or reversal $103,000-$98,000 (higher risk)
Thank you for reading and let me know what you think. More ideas to come.

BTCUSDT short-term analysishi traders
Let's have a look at BTC on 4h time frame.
RSI (14): Currently at 60.40, suggesting mild bullish momentum but not overbought.
RSI Moving Average: Around 50.92, confirming recent upward momentum.
MACD bullish cross suggest more upside in a short term.
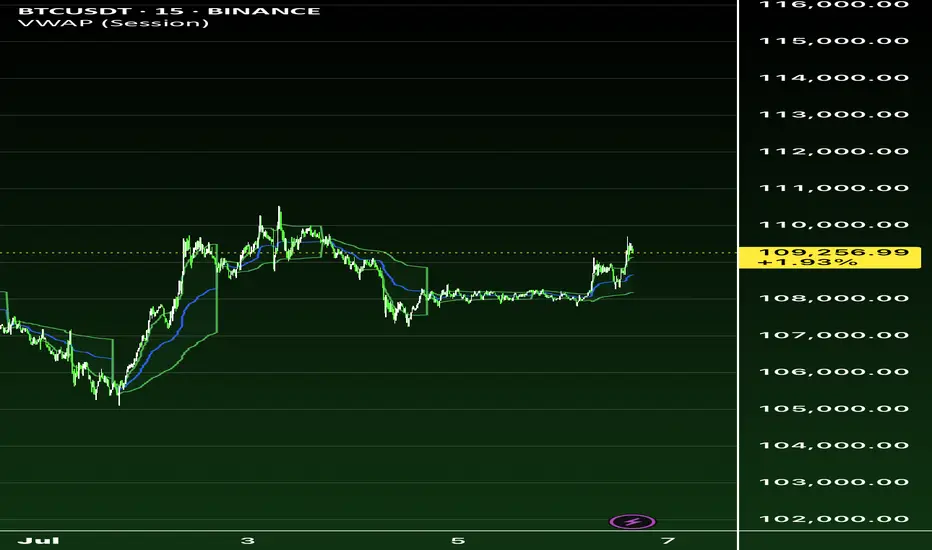
Breakout Confirmation: Price has broken above a recent horizontal resistance (near $109,236), now acting as support.
Bullish Continuation Expected
Support & Resistance:
New Support: $109,236
Resistance to Break: Around $111,742
✅ Conclusion:
This is a bullish breakout trade based on horizontal support/resistance, favorable RSI, and a clear RR setup. The trader anticipates a pullback and continuation toward $111.7K, using a tight stop just below the breakout zone to minimize risk.

BTC Smart money Bullish don’t be fooled !**BITCOIN MICROSTRUCTURE ANALYSIS: Institutional Accumulation Through Order Flow Divergence**
The current BTCUSD market structure presents a compelling case study in institutional accumulation mechanics, utilizing sophisticated order flow analysis to identify smart money positioning ahead of retail market participants.
**Technical Infrastructure Analysis**
The convergence of multiple analytical frameworks reveals a coordinated accumulation pattern across various timeframes and exchanges. Volume Profile Analysis on the primary chart indicates substantial institutional interest between $108,000-$110,000, with the Point of Control (POC) establishing a robust foundation for directional bias determination.
**Order Flow Microstructure Dynamics**
The Bitfinex footprint data reveals critical microstructural imbalances that traditional technical analysis often overlooks. The current candle displays a **-4.52 delta** with price resilience at $109,480, indicating aggressive institutional absorption of retail selling pressure. This negative delta combined with price strength represents a classic **Wyckoff accumulation signature** - large participants are utilizing iceberg orders and hidden liquidity pools to build positions without triggering algorithmic momentum systems.
**Smart Money Positioning Mechanics**
Three key indicators confirm institutional accumulation:
1. **Cumulative Volume Delta (CVD) Divergence**: Both spot and perpetual markets showing negative CVD (-95.77K spot, -50.05K perp) while price maintains elevation, indicating off-exchange accumulation through dark pools and cross-trading networks.
1. **Open Interest Expansion**: The increase from 77.89K to 78.75K contracts with minimal funding rate pressure suggests fresh institutional capital rather than retail speculation.
1. **Volume Profile Concentration**: The heatmap reveals 105.85M in trading volume concentrated within the $108K-$110K range, representing systematic accumulation rather than random market activity.
**Institutional Arbitrage Mechanics**
The funding rate dynamics (0.001783 with periodic negative spikes to -0.000753) indicate sophisticated carry trade positioning. Institutions are likely utilizing the negative funding periods to establish leveraged long positions while simultaneously hedging through spot accumulation, creating a self-reinforcing feedback loop.
**Market Microstructure Implications**
This accumulation pattern typically precedes **Phase C markup** in Wyckoff methodology, where institutional players transition from absorption to active price discovery. The thin volume profile above $112,000 suggests minimal resistance once the breakout occurs, creating conditions for rapid price expansion toward the $113,600 target.
**Risk-Adjusted Positioning Strategy**
The confluence of volume profile analysis, order flow dynamics, and institutional positioning indicators supports a high-probability long bias with the following parameters:
- **Entry Zone**: $109,000-$109,200 (current accumulation range)
- **Risk Management**: Stop loss at $108,200 (below institutional POC)
- **Target Sequence**: $110,653 → $112,000 → $113,600
- **Confidence Level**: 90% (upgraded from initial 75% based on footprint confirmation)
**Forward-Looking Market Structure**
The sophisticated nature of this accumulation pattern suggests institutional preparation for a significant directional move. The combination of hidden liquidity absorption, funding rate arbitrage, and volume profile concentration creates optimal conditions for sustained upward momentum once the $110,000 psychological resistance is cleared.
This analysis exemplifies how advanced order flow techniques can provide substantial informational advantages over traditional technical analysis, particularly in identifying institutional positioning ahead of retail market recognition.
*Position sizing should remain within 3-5% of total portfolio allocation, with dynamic risk management protocols adjusted based on evolving market microstructure conditions.*

Possible buy for BTCUSDT Price is approaching our demand zone
Let's keep an eye 👀
If price will respect our zone.
BINANCE:BTCUSD
Sunday blessings


BTCUSDT Possible Move IntradayHello Traders,
BTCUSD we are likely to sweep 30m high then come back to consilidated area before further move, we shall wait and take the decision after proper confirmation.
Thanks, BINANCE:BTCUSDT.P BINANCE:BTCUSDT.P
minters.

BTCUSDT LongsHello Traders,
Though we are at weekend but as far BINANCE:BTCUSDT.P intraday look, 30M charts showing some bullish momentum to 109600 today.
Thanks,
Minters

BTC/USDT – Breakout Brewing? Eyes on 110K+ Timeframe: 4H | Exchange: Binance | Date: July 🧠 What’s Happening?
Bitcoin just fired out of a bullish wedge with strong volume and is marching inside a clean rising channel.
All eyes now on the golden Fibonacci zone — and beyond!
🎯 Key Levels
📍 Immediate Resistance:
→ $109,940 – Holding at the 0.5 Fib
→ $110,580 – $111,491: Golden Pocket (0.618–0.786 Fib)
→ $112,652: Full Fib Extension + Channel Top
📍 Support Zone:
→ $108,200 – $107,800: Must hold for bulls
→ Below $107.5K = momentum shift ⚠️
🔍 Technical Signals Lighting Up
✅ Bullish breakout from descending wedge
✅ Strong volume confirms breakout intent
✅ RSI at 57+, trending upward
✅ MACD crossing bullish
✅ Stochastic RSI curling from oversold
✅ ADX increasing – trend gaining strength
🚀 Trade Setup (Idea Only!)
Above $110K = bullish continuation
Next stops: $111.5K – $112.6K
Hold $108K = bullish structure intact
Below $107.5K = reevaluate bias
🧨 Summary:
Bulls have the momentum — but can they punch through the golden zone?
$110K+ is the battleground. Break it, and we’re off to $112K+.
💬 What’s your bias? Bulls or bears? Drop a chart or comment below 👇
🔔 Follow for daily setups & sharp market commentary!

BTC Roadmap to 220KApril 9, 2025 marked a historic shift in the Bitcoin market structure. On that day, institutional giants and sovereign funds aggressively stepped in, buying back BTC in large volumes as price retraced to its previous all-time high (ATH) zone around $69K. This wasn't just a typical dip buy — it was a coordinated accumulation event that triggered the fastest 30-day rally in Bitcoin history, pushing the price above $90K, then $100K, and now consolidating just under $110K.
BTC is currently hovering near $110K — testing it for the fourth time over the past two months. This level has evolved into a major macro flip zone, where previous all-time resistance is attempting to become new long-term support.As of now nee just one ignite candle to break major resistance above 110K then will enter to price discovery zone.
HINT:
The current Bitcoin production cost (mining break-even) sits around $100K due to:
Post-halving mining difficulty
Higher energy costs
Institutional-scale mining operations
This implies miners and institutions need BTC > $100K to remain profitable, aligning them on the same side: supporting price, not dumping.
#BTC #Bitcoin #BTCUSDT #CryptoAnalysis #BitcoinBreakout #PriceDiscovery #InstitutionalBuy #CryptoTradeSetup #BTCMacro #BTCBullRun #CryptoTA #BitcoinHalving #CryptoSupercycle #TradingView

"Bitcoin to $110,000? Here's What the Charts Are Saying!"📈 Is Bitcoin Going to $110,000?
In this video, we analyze Bitcoin’s current price action and key resistance levels to understand whether BTC is gearing up for a breakout to $110K. Using technical indicators, market sentiment, and on-chain data, we break it down in simple terms so anyone can follow.

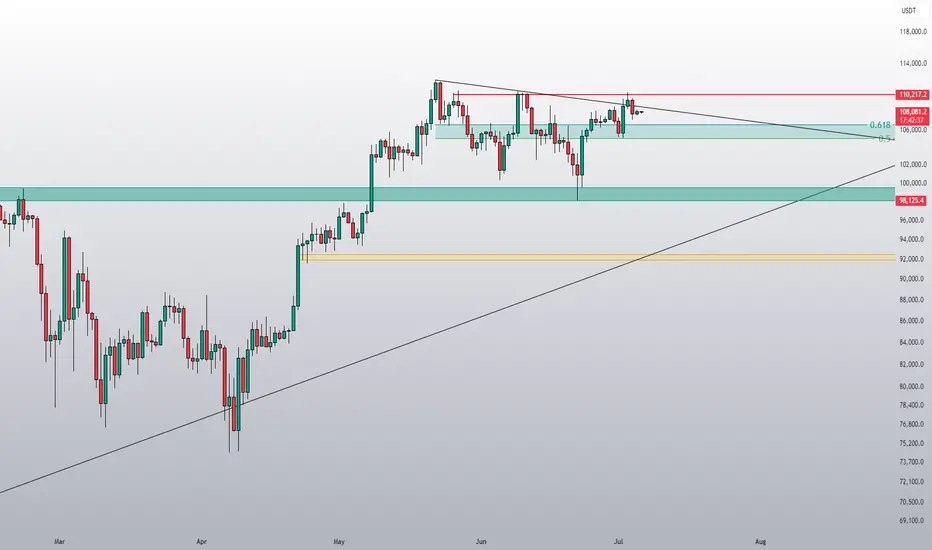
The calm before the stormBTC has been rejected at resistance for now, which was to be expected. More importantly, the price is currently trading above the golden pocket of the overall correction. This suggests the correction might be over and that we could eventually break to new ATHs.
#BTC Update #3 – July 5, 2025🟠 #BTC Update #3 – July 5, 2025
Bitcoin is currently in a corrective phase following its latest impulsive move. To confirm that the correction is complete, I’d need to see a fresh impulsive leg. Until then, price may continue to pull back .
Looking at the liquidation heatmap, I’m seeing stacked liquidity between $107,100 and $106,500 . Based on that, I wouldn’t be surprised to see BTC wick down toward $106,000, sweep that zone, and potentially initiate a long-biased impulsive bounce.
If that bounce materializes, my first target is the $110,000 region . It’s also worth noting that Bitcoin is currently sitting inside a supply zone, which could add short-term resistance before any breakout.

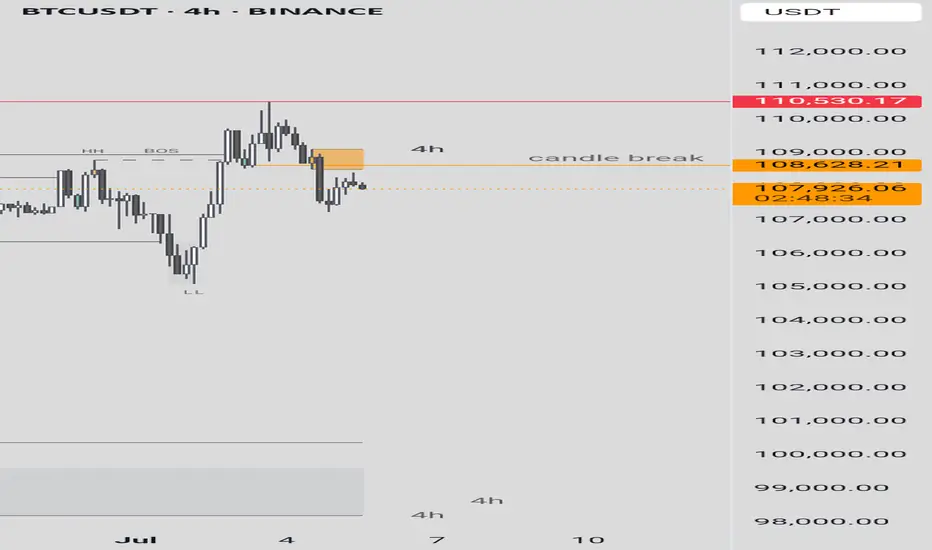
BTCUSDT This is a 4-hour candlestick chart for BTCUSDT on Binance, covering the period from June 4 to July 4, 2025. The chart includes technical analysis annotations such as:Higher Highs (HH) and Higher Lows (LH) indicating an uptrend.Lower Highs (LH) and Lower Lows (LL) suggesting a potential downtrend or consolidation.CHOCH (Change of Character) marking a shift in market structure.BOS (Break of Structure) indicating a break in the previous trend.A red horizontal line at 110,530.17, possibly a resistance level.An orange dashed line around 108,259.99, possibly a key support or pivot level.Price levels on the right (e.g., 110,530.17, 108,628.21) showing recent highs and the current price at 01:01:45.The chart shows a recent upward movement followed by a sharp drop, with the price currently near 105,000. This could indicate a rejection at resistance or a breakout attempt.
Overall, the market is currently trending down in the short term, but there is a chance for a comeback if support holds. Monitor the key levels of 105,000 and 102,500 for further confirmation.

BTC SCALP Tradeas long as BTC doesn't closes below the mentioned area on 1hr tf, it will bounce and hit the fresh sellers SL. Once we have a closing below the area it can take correction upto 98-97K area.

BTC Scalp Long / Buy SetupWait for the entry first, BTC must sweep the liquidation levels below side first then it should start pumping towards the tp, if it takes 2nd tp first then trade is not valid, if it takes first tp and then come back at entry level trade is still valid. if 4hr candle closing below the Bullish OB then close the position otherwise wick doesn't matter.

BTC Analysisfor here no trade zone, short from mentioned zone and keep the sl tight, I would prefer long from the 100k zone, if we get daily closing below the mentioned zone then will long from 92-90k area, target still remains the same 112k-120k

BTC short setup As previous weekly went good on BTC, a nice bounce from the area on swing setup. Now wait for the liquidity grab from 107.8k then take short, that whiteline is important to break and sustain for btc to continue it's Bullish trend. Longer sl is just to avoid wick damage closing matter here. Good luck, book at least 50% on 105.2k rest hold the position, and take long from mentioned zone.

Bearish Bias
Bitcoin is currently trading around 107,849, showing signs of downward pressure:
🔻 MACD: Bearish crossover — MACD line is below the signal line, momentum is weakening.
🔻 Stochastic RSI: Rejected from mid-levels and turning down — indicating potential continuation of the bearish trend.
🔻 Moving Averages: Price is hovering below MA30 and struggling to reclaim key levels like 108,250.
📉 Key Levels
Resistance: 108,250 – 108,600
Support: 107,590 → 107,222
If BTC breaks below 107,590, expect further downside toward 107,222 or even 106,900.
🧠 Outlook: Bearish bias remains in the short term unless BTC reclaims and holds above 108,250 with volume.

BTCUSDT PRICE PREDICTION If Bitcoin closes two consecutive candles below the 50 Moving Average with full body confirmation, then nothing can stop the price from dropping further — unless it eventually touches the 112,000 level.

BTC Trade SetupBTC will not take any major correction until it sweeps upside liquidation and close with big red candle, So take the long only on BTC. Wick possible below the SL. I will hold the trade without sl if it comes to entry, if tp achieved first then ignore the trade. Also July breakout possible for BTC, July always positive for BTC, let's see.
