BTC gonna surprise us its not the end for btc
looks very juicy
last bull flag gave huge pump
will this bullflag will be the same ?
place ur bets
USDTBTC trade ideas
Breakout on multiple levelsWe're having a breakout on price, RSI and MACD - unless we dump into the daily close.

Premium zone tagged — now we watch how the Smart Money reactsBitcoin just tapped into the 108,151 level — the top of a measured premium range and a likely area where profit-taking begins and fresh distribution footprints form.
This run-up wasn’t random. Price surged from inefficiency, cleanly filled the fair value gap (FVG), and is now flirting with a key liquidity pocket.
Here's what the structure says:
Premium reached: 108,151 (0% fib)
If rejection holds, Smart Money looks to discount entries:
0.236: 106,136
0.382: 104,889
0.5: 103,882
Deep retracement zone: 0.618 at 102,874
Final defense for bulls? The unmitigated FVG block between 101,440 → 99,613
Possible Playbook Scenarios:
Quick retrace → higher high:
Bounce off 104,889 or 103,882 before attacking 108,967+
Deeper sweep:
Into 102,874 (0.618) before Smart Money steps in again
Invalidation:
Break below 99,613 closes this bullish narrative and confirms a structural break
TL;DR Execution Logic:
Wait for retracement into 0.5–0.618 fibs
Look for bullish reaction (engulfing or SFP)
Upside targets:
108,151 (retest)
108,967 (liquidity sweep)
Further upside if momentum sustains

BTCUSDT: Bounce Incoming?BTCUSDT Technical analysis update
-March 2024 resistance is now expected to act as a strong support level.
-The price has touched the 0.618 Fibonacci retracement level, suggesting a potential reversal from this zone.
-The 200 EMA on the 2-day chart is positioned as a strong dynamic support, reinforcing the bullish case.
We can expect a bounce from the $72-75k level.

Long trade
🟢 Trade Journal Entry – Buyside Trade
📍 Pair: BTCUSDT
📅 Date: Monday, June 23, 2025
🕒 Time: 10:00 AM (NY Session AM)
⏱ Time Frame: Not specified (assumed 4Hr or intraday swing)
📈 Direction: Buyside
📊 Trade Breakdown:
Metric Value
Entry Price 101,705.24
Profit Level 108,783.85 (+6.96% %)
Stop Loss 99,579.47 (−2.09%)
Risk-Reward
Ratio 3.33 1
🧠 Context / Trade Notes:
High-Conviction Buyside Play:
Entry aligns with the broader BTCUSD bullish structure, supported by consistent higher-timeframe momentum.
Liquidity Grab Below Key Low:
Market swept downside liquidity near $99,600 before reversing sharply, indicating smart money accumulation.
Stop level moved (2.86%)

Here is an analysis of the latest Bitcoin market trendBitcoin has surged to around $106,700 at its peak and hovered around $104,800 at its low. Overall, the trend remains relatively stable, continuing to stay at a relatively high level. What is driving the market?
First, institutional funds have flowed in again. Recently, many investors have bought Bitcoin through ETFs, with substantial capital inflows, which has formed support for this price level.
Second, the technical outlook is promising. Various technical indicators suggest that it is still a bullish market, meaning the price may continue to rise.
Third, regarding support and resistance levels: if the price declines, it may first find support near $104,000. If it breaks upward, the next target is roughly between $108,000 and $110,000.
What about the short-term trend? If it can break through $107,000, it may then surge toward $109,000 or even the high of $112,000. If it fails to break through, it may fluctuate repeatedly within the range of $104,000 to $106,000 for a period.
you are currently struggling with losses,or are unsure which of the numerous trading strategies to follow,You have the option to join our VIP program. I will assist you and provide you with accurate trading signals, enabling you to navigate the financial markets with greater confidence and potentially achieve optimal trading results.
Trading Strategy:
buy@104300-104800
TP:107000-107500

BITCOIN BULL TRAP!!!? IS THIS YOUR SHORT ENTRY TO $44k?I am explaining a potential Bitcoin’s leading diagonal formation, that is forming an UHTF wave 1, that if successfully formed can be a start of the crash towards 44k!

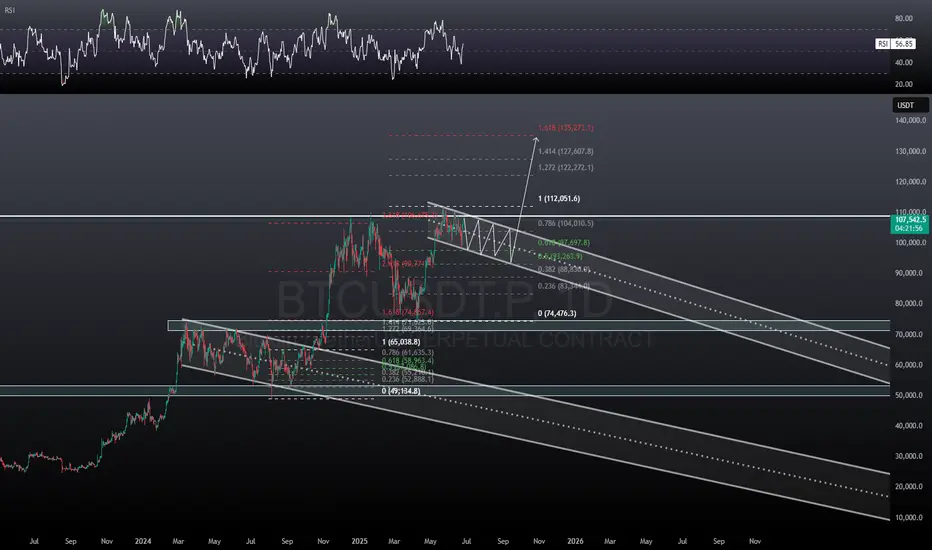
BTC trade plan🚨 BITCOIN – Eyeing $135K Before the Real Drop? 🚨
📆 Timeframe: 1D | Exchange: BINANCE
🧠 Elliott Wave Breakdown:
After completing Wave 3 near the $109K level, BTC entered a classic A-B-C correction.
We're currently breaking out of a bullish flag, hinting at the final leg Wave B rally still to come!
📈 Wave B Target Zone:
🎯 1.0 Extension: $135,920
🔴 1.236 Extension (Max Spike): $145,000
This zone is our “Red Box of Rejection”, where a strong reversal is likely as Wave C kicks in.
A sharp Wave C dump could target the 1.618 Fib extension at $74,576 — a textbook retracement level for deeper Wave 4 corrections.
That area would offer a generational buying opportunity heading into Wave 5, targeting above $220K+!
🚀 Final Wave 5 Target:
💥 1.618 Extension: $221,993+

BTC: H4 Plan 25/06/25Trade Plan – H4 BTC
Market Context:
- Total market cap has retraced into a 4H order block
- BTC is holding stronger relative to total
- Market has been range-bound for 43 days – HTF is sideways
Key Levels:
- 3.18T on total = clean long trigger, aligns with BTC monthly close + daily FVG + 0.5 fib retrace
- 110k = equal highs, 0.886 fib level, clear derisk point for intraday and key supply zone
Trade Strategy:
- Wait for 3.18T retest on total market cap before entering
- Look to long BTC on any dip into monthly close + daily FVG + 0.5 retrace region
- Flip short at 110k – until breakout is confirmed, treat this as a range-bound environment

Do you think it supports this model?After two weeks away from you, I am back.
Hello friends, as some of you dear ones know, I live in Iran, and due to the two-week war in Iran, I was not in the mood for analysis, nor was the internet helpful.
But I came back to you so that we can identify the profits together.
.
The chart you see has formed an old pattern (flag pattern), and if it breaks out of this pattern from above, we can expect an increase as large as the previous lag.
The target of this increase is the area that we had mentioned in previous Bitcoin analyses. (You can enter the page and look at the analyses)
.
I hope you have used this analysis well.
I wish you complete peace wherever you are.
You can follow the page to see more analyses, hoping for good days.

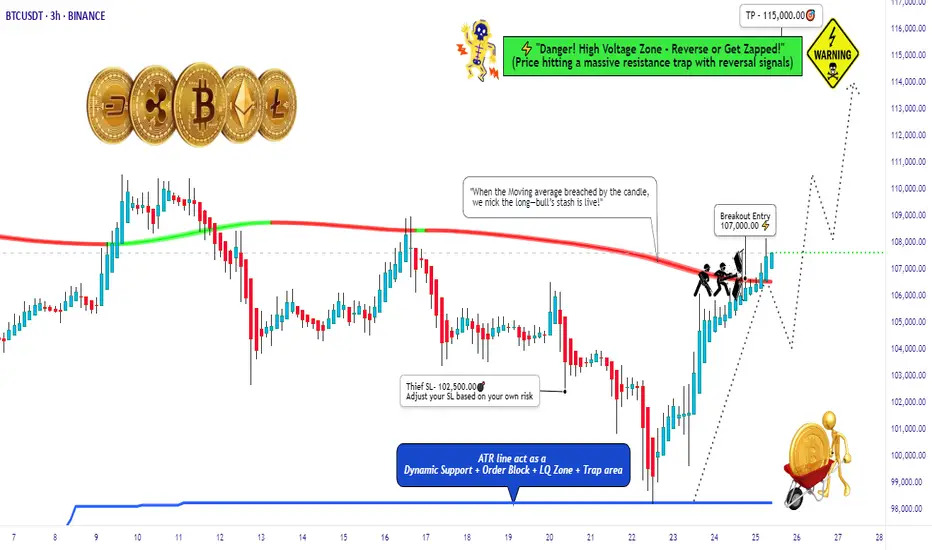
BTC/USD Thief Breakout at $107K – Eyeing $115K!🚨 Thief Entry Setup: BTC/USD Breakout Play 🚨
Overview:
Jump in after the $107 000 breakout—aiming for $115 000 with a tight “Thief SL” at $102 500. Adjust the stop‑loss to match your personal risk tolerance.
🧠 Setup Summary
Pair: BTC/USD
Entry trigger: Breakout above $107 000
Stop‑Loss: “Thief SL” at $102 500 (use your own risk‑based SL)
Target: $115 000
🎯 Why This Setup?
Clear breakout level at $107 000 = fresh momentum
Tight SL cushion (≈‑4.3%) = defined risk
Target ≈ +7.5% potential = strong reward-to-risk (~1.75:1)
📏 Risk Management Tips:
Only risk a small % of your capital—never exceed your comfort zone.
Move your SL to breakeven once mid‑target is hit to lock in profits.
Trailing your stop‑loss could secure bigger gains if BTC surges toward $115 000.
UNEXPECTED RISK CRASH FREE FALL AFTER TREND DATA FOR TH NEXT 48HDepending on our study, BTC has a high chance of a new crash below 100K.
The next 48 hours are important for the trend change of BTC, which can allow the trend to free-fall below 100K
BTC is at a top, and it did recovery always recovered on the M volume top., We are now again on the same trend.
BTC can return below 100K as this update shows, with the possibility of targeting the main target 85K - This is the trend zone for new interest.
The reason for this crash is that BTC has not confirmed the cycle, which means the end of the cycle. There is always possibility that the market can act green, but we expect it can show an unexpected breakdown.

BTC recovers, price range sideways trend line💎 Update Plan BTC (June 25)
Notable news about BTC:
🌐 Growth stimulus factor
Reducing geopolitical tensions: The ceasefire agreement between Iran and Israel has helped improve investor psychology, promote capital inflows into risky assets like Bitcoin.
The dollar weakened: The USD index dropped to the lowest level in a year due to concerns about the economic impact from President Trump's tax policies, making Bitcoin a more attractive choice for investors to search for replacement assets.
Expectations for monetary policy: The decision of the US Federal Reserve (Fed) on keeping interest rates stable and interest rate cutting capacity in July has motivated the cryptocurrency market.
Technical analysis angle
Bitcoin may increase to the highest level of all time
Bitcoin price reached the lowest level of $ 98,200 on Sunday but has recovered strongly 5% in the next two days, closed on the dynamic average line according to the 50 -day exponential jaw at $ 103,352. At the time of writing on Monday, the price continued to trade higher at about $ 106,500.
If BTC continues to increase, the price can expand the momentum to the highest level of all time is $ 111,980 on May 22.
The relative power index (RSI) on the daily chart is 54, higher than the neutral level of 50, showing the motivation for price increase. The average divergent divergence (MACD) is referring to the price intersection (the MACD is about to cut on the signal line), if completed, the purchase signal will be made.
==> Comments for trend reference. Wishing investors successfully trading

Bitcoin (BTC): Going For Another Breakout | New ATH?Bitcoin is showing strong signs of buyside movement, where we are pressuring the local resistance zone, which upon breaking should lead us to a new ATH area.
We have had multiple attempts to break out from that area, so being back here does not mean anything. yeet, we have to ave clean breakout in order to see the $120K area tested.
Swallow Academy

Bitcoin Update 25.06.2025 —Altcoins, Top Altcoins Choice & MoreGood morning my fellow Cryptocurrency trader, I hope you are having a nice week and a wonderful day.
We have good news to start today and it is all based on Bitcoin's price action. This is going a bit deep on the daily noise, price swings.
Price action analysis
Bitcoin went deep on its sideways range and tested below 100K. This is normal for a sideways market. The positive news comes from the fact that Bitcoin is once more trading above $106,000 and already hit above $107,000. This type of action reveals a bullish bias.
If the market was mainly bearish with a major drop on the deck, say going below 90K or 80K even, then Bitcoin would not be allowed to go beyond $105,000. In fact, any bounce or small recovery would be quickly sold as bear would be active, waiting and selling each time prices move up.
The fact that Bitcoin can grow day after day and consume all selling pressure while doing so, reveals a strong presence from buyers. We know this to be true because Bitcoin is now in a new phase in its evolution and growth cycle. It is truly a young technology that only now is being fully accepted with plenty of room available for growth.
We have three instances where Bitcoin moved above 110K. The selling that happened afterward is not filled with pressure, instead you can see some standard candles as prices continue to consolidate.
On the other hand, notice the last session from 21-June (21-24 June —3D candles). You can see a long lower shadow, a bullish hammer; there was definitely strong buying pressure as soon as Bitcoin reached below support.
Altcoins market action
Some altcoins continue to produce multi-months high. The highest price since January 2025. These altcoins recovered, started to rise and continue rising in clear, standard bull market fashion. Literally straight up.
Some altcoins did even better and grew as high as December or November 2021. The highest price in almost four years. This is very important when we go deep into the chart and price action because it is the main revealing signal. The altcoins simply do not go on a major bull market before a market crash. If the altcoins are recovering or rallying, it is because the market is set to "buy." The Cryptocurrency market is in bullish mode.
If the market was set to drop long-term then we would be experiencing a rise that is running out of momentum. This rise would later peak and a surprise sudden flash crash would signal the start of a major downturn. This is not what we see.
Inversely, if prices are going to rise strongly we start by seeing some form of retrace or correction, this event losing momentum and volume and then finally a strong bullish jump as soon as support is confirmed. This bullish jump would signal the start of a major market move. This is what we are experiencing today.
Bitcoin & Altcoins
Bitcoin and the altcoins move together. Bitcoin leads the altcoins, the altcoins reveal what Bitcoin will do when the action is sideways.
We can always say that Bitcoin is leading the altcoins of course because Bitcoin has been growing non-stop since November 2022. The major trend being bullish the altcoins are set to follow at some point.
Now, when Bitcoin goes sideways, by definition, anything goes. The market can break-down just as it can break-up. This is where the altcoins become useful.
If smaller Cryptocurrency projects are moving ahead, strongly and even producing 3-4 multi-year highs, it reveals what Bitcoin will do once its consolidation period ends.
Buying Bitcoin
In short, Bitcoin is going up. The next major market move is a rise and we have proof coming from the signals, the altcoins and the charts.
Never again in its history Bitcoin will trade below 80K. 90K soon to be gone... Once the action starts, you will look like a genius for buying below $110,000.
What to choose: Bitcoin or altcoins?
Now, my personal suggestion is different. If you are not a whale, the way to go are the altcoins. Why? Because there is more room for these to grow. We can say that the altcoins are riskier, but risk is almost non-existent with spot. We can simply focus on the pairs that have been filtered by the major exchanges. Reputable pairs with a long track record and plenty of room available for growth. You can't go wrong with those.
If you are ready for the 2025 bull market, leave a comment below.
Altcoins analysis by request
I think it is time for a new Your Top Altcoins Choice, session. It is always wise to do these when the market hits bottom or before a major bullish wave, that's exactly where we are now. If you agree and would like to see a new session, leave a comment saying "Yes! Top Altcoins Choice." If there is enough interest we can work together and find many hidden gems. It can be done with your support.
Namaste.

Bitcoin: Trading Scenarios and Multi-Time Frame Analysis Bitcoin: Trading Scenarios and Multi-Time Frame Analysis
In this video, I break down all the key scenarios currently unfolding for Bitcoin.
The price is approaching a critical zone and is likely to make a decisive move soon.
While I believe a downside move remains the more probable outcome, all possibilities are still on the table.
You may watch the analysis for further details!
Thank you and Good Luck!
❤️PS: Please support with a like or comment if you find this analysis useful for your trading day❤️

Bitcoin sell short inter:115000Bitcoin needs to reach the 114,000-115,000 range and a daily time frame divergence and drop to the 84,000-50,000 range.

BITCOIN I Daily CLS I KL - OB I Target ATHHey, Market Warriors, here is another outlook on this instrument
If you’ve been following me, you already know every setup you see is built around a CLS range, a Key Level, Liquidity and a specific execution model.
If you haven't followed me yet, start now.
My trading system is completely mechanical — designed to remove emotions, opinions, and impulsive decisions. No messy diagonal lines. No random drawings. Just clarity, structure, and execution.
🧩 What is CLS?
CLS is real smart money — the combined power of major investment banks and central banks moving over 6.5 trillion dollars a day. Understanding their operations is key to markets.
✅ Understanding the behaviour of CLS allows you to position yourself with the giants during the market manipulations — leading to buying lows and selling highs - cleaner entries, clearer exits, and consistent profits.
🛡️ Models 1 and 2:
From my posts, you can learn two core execution models.
They are the backbone of how I trade and how my students are trained.
📍 Model 1
is right after the manipulation of the CLS candle when CIOD occurs, and we are targeting 50% of the CLS range. H4 CLS ranges supported by HTF go straight to the opposing range.
📍 Model 2
occurs in the specific market sequence when CLS smart money needs to re-accumulate more positions, and we are looking to find a key level around 61.8 fib retracement and target the opposing side of the range.
👍 Hit like if you find this analysis helpful, and don't hesitate to comment with your opinions, charts or any questions.
⚔️ Listen Carefully:
Analysis is not trading. Right now, this platform is full of gurus" trying to sell you dreams based on analysis with arrows while they don't even have the skill to trade themselves.
If you’re ever thinking about buying a Trading Course or Signals from anyone. Always demand a verified track record. It takes less than five minutes to connect 3rd third-party verification tool and link to the widget to his signature.
"Adapt what is useful, reject what is useless, and add what is specifically your own."
— David Perk aka Dave FX Hunter ⚔️

What now BTC?#bitcoin price has been moving in an ascending wedge for a few days. Although ascending wedges may end up bearish, there' s another chance for #btc price to break out this wedge and catch upper liquidities above 108K. But, also there' s a bearish divergence has been forming in this lower time frame chart of #btcusdt .
Maker may ignore this divergence and allow bots to print another HH but it' s now wise to be careful and watch out. The reverse is acceptable for #usdt dominance chart.
Breaking out 110K is the temporary invalidation of bull trap and above 120K is the complete invalidation.

BTC: One More Leg Down?
I believe the impulse BINANCE:BTCUSDT BITSTAMP:BTCUSD BINANCE:BTCUSDT.P from April to May has been completed, and we are currently in a correction phase, which is likely to continue for some time.
In the base case, I’m considering a simple zigzag pattern:
Wave A – impulsive move down
Wave B – forming a symmetrical triangle
Wave C – expected next
🎯 Target zone: 97,500, where we have a confluence of weekly FVG, 20-week MA, and vWAP.

Bitcoin Roadmap: Key Levels to WatchBitcoin( BINANCE:BTCUSDT ) managed to pump as I expected yesterday , of course, the main catalyst could have been the ceasefire announcement between Iran and Israel , which had a major impact on high and medium risk assets in the financial markets .
Bitcoin is once again moving near the Heavy Resistance zone($110,720-$105,820) and the Resistance zone($107,520-$106,100) after breaking the Resistance lines .
In terms of Elliott Wave theory , it seems that given Bitcoin’s bullish momentum , Bitcoin has completed the main wave 3 and is currently completing the main wave 4 on the 1-hour time frame . The corrective wave structure of wave 4 could be a Double Three Correction(WXY) .
I expect Bitcoin to start rising again near the Support zone($104,380-$103,060) , 50_SMA(Daily) , Support lines , and Cumulative Long Liquidation Leverage($104,412-$103,812) to rise at least to the Potential Reversal Zone(PRZ) and Resistance lines .
Note: Stop Loss(SL)= $102,600 = We can expect more dumps.
Please respect each other's ideas and express them politely if you agree or disagree.
Bitcoin Analyze (BTCUSDT), 1-hour time frame.
Be sure to follow the updated ideas.
Do not forget to put a Stop loss for your positions (For every position you want to open).
Please follow your strategy and updates; this is just my Idea, and I will gladly see your ideas in this post.
Please do not forget the ✅' like '✅ button 🙏😊 & Share it with your friends; thanks, and Trade safe.

Red Alert For Intrday Selling #bitcoinHello trader's
This is your Red Alert level only for today intrday selling...

BTC/USDT Smart Money Roadmap | Daily FVG + ATH TargetSeenForex | ICT-Based Smart Money Analysis
Bitcoin is currently reacting within a Daily Weak Fair Value Gap (WFVG) after a series of liquidity sweeps ($$$). Price structure suggests two possible scenarios:
✅ Bullish Continuation Setup:
Daily WFVG acting as potential mitigation zone
Targeting ATH liquidity above $112,000
Confirmation required: bullish BOS or entry model near FVG
🔄 Bearish Liquidity Sweep Scenario:
Deeper liquidity draw possible below WFVG
Next potential demand zone around $85,000–$87,000
Clean inefficiency (FVG) below waiting to be filled
🧠 Wait for price reaction inside WFVG or deeper zone before taking action.
📊 Strategy Used:
ICT | Smart Money | Liquidity Sweep | Order Block | BOS | FVG
📅 Date: June 19, 2025
🔍 Analyst: SeenForex
#BTC #Bitcoin #BTCUSDT #SmartMoney #ICT #FVG #Liquidity #TechnicalAnalysis #CryptoTrading #SeenForex #OrderBlock #TradingViewIdeas
