Evening BTC Market Analysis and Trading RecommendationsToday, U.S. markets are closed, leading to light trading activity and relatively limited overall market volatility. From a technical analysis perspective, the 4-hour K-line chart currently shows prices trading below the middle band of the Bollinger Bands, exhibiting a classic range-bound consolidation pattern. Bulls and bears are locked in a tug-of-war between key support and resistance levels, with K-line formations alternating between bullish and bearish patterns.
In terms of chart structure, the lower support zone has demonstrated strong buying conviction, while the upper resistance level has exerted clear restrictive force. Multiple failed upward breakouts have formed a short-term top. This box consolidation—characterized by resistance above and support below—is expected to sustain sideways trading through Friday.
Against the backdrop of no major positive catalysts, bearish momentum may gradually dominate if no substantial bullish triggers emerge. Maintain a trading strategy of selling into strength.
BTCUSDT
105000-105500
tp:104000-103000
Investment itself is not the source of risk; it is only when investment behavior escapes rational control that risks lie in wait. In the trading process, always bear in mind that restraining impulsiveness is the primary criterion for success. I share trading signals daily, and all signals have been accurate without error for a full month. Regardless of your past profits or losses, with my assistance, you have the hope to achieve a breakthrough in your investment.
USDTBTC trade ideas

Bitcoin Breaks Out: Bullish Momentum Builds Above Key LevelsHello guys!
The chart of Bitcoin reveals a significant bullish breakout, characterized by two key technical developments:
Broken Ascending Channel:
Bitcoin was trading within an ascending parallel channel, gradually making higher highs and higher lows. This channel was recently breached to the downside, suggesting a temporary weakening in momentum.
False Breakdown and Strong Reversal:
Despite the initial breakdown from the channel, Bitcoin swiftly reversed and surged upwards, reclaiming previous support levels with strong bullish candles. This “fake-out” move often traps bears and reinforces bullish sentiment.
Trendline Breakout:
More notably, BTC has broken above a descending trendline, which had acted as a resistance zone. This breakout, backed by strong volume and momentum, indicates a shift in market structure from consolidation to potential expansion.
Projected Upside Target:
Based on the breakout projection drawn on the chart, the next major resistance appears near the $109,600 level. This aligns with the upper purple dashed line, which may represent a historical resistance zone or a Fibonacci extension.

btc short setupSL 10500
tp 102500
with ongoing world events and liquidations available at that range, its very much possible that bitcoin will and must tap 102 or lower for a creating fear and wiping retailers out. But short with caution might give fake outs to trap longs.
thanks
BTCUSDT: Sharing of the Latest Trading StrategyAll the trading signals today have resulted in profits!!! Check it!!!👉👉👉
Fundamental Analysis:
The Federal Reserve's potential rate cut is expected to increase market liquidity, driving up prices of risk assets like Bitcoin.
Positive developments in China-U.S. trade talks have boosted market risk appetite, benefiting Bitcoin's price.
Technical Analysis:
Bitcoin rebounded strongly from the June 5 low of $100,377, with the RSI quickly recovering from oversold territory to around 55, indicating robust rebound momentum.
The lower Bollinger Band near $101,000 provided strong support, and price has now returned above the middle band.
Overhead resistance: $107,000 and $108,000
Support levels: $103,000, $101,500, and $100,000
Trading Recommendation for Aggressive Traders
Consider initiating light long positions if price pulls back to the $103,000–$103,500 zone.
Trading Strategy:
buy@ 103000–103500
TP:106000-108000
Share accurate trading signals daily—transform your life starting now!
👇 👇 👇 Obtain signals👉👉👉

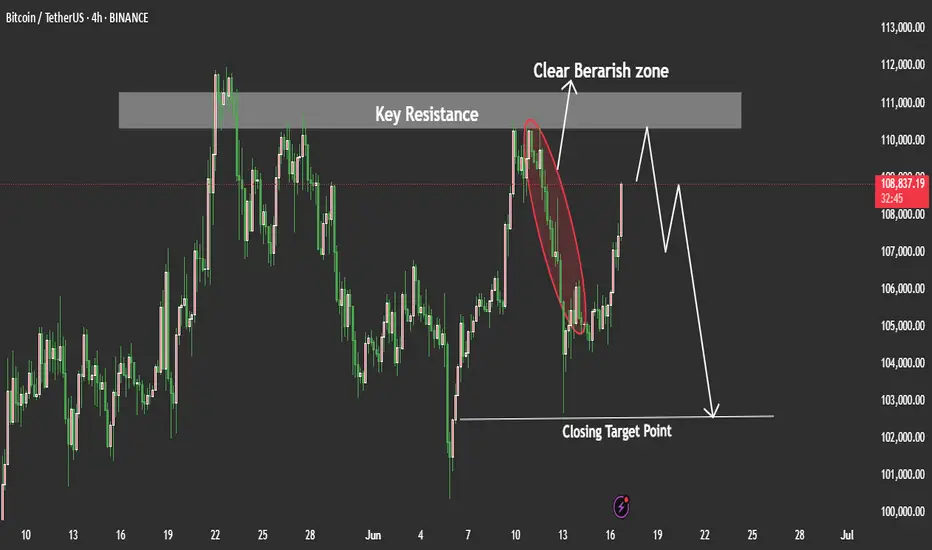
BTCUSDT Price may Test as Short TermBTC/USDT Price Analysis (Interpretation):
BTC/USDT recently tapped into a well-defined rejection zone on the 4H and Daily timeframes. This zone has previously acted as strong resistance.
Given this, we could expect a potential move to the downside unless the price breaks above that rejection zone with strong momentum. However, before the downside move fully plays out, there is a chance the price may retest the 102,500 level again — possibly as a liquidity grab or a false breakout — before resuming a bearish push. My Goal is 102,500 lets we see how how the price will plays out.
if you like tis idea and if you find good thing in this analysis share in comments we need support from you Guys.
Bitcoin hits new uptime milestone!
Bitcoin has traded above $100,000 for more than 40 consecutive days since May 7, a major milestone for the top cryptocurrency, which has also surpassed 6,000 consecutive days of uptime this month.
BTC unaffected by global events
On June 19, Bitcoin recorded more than 40 consecutive days of trading above $100,000, despite uncertainty and heightened geopolitical tensions in the Middle East. According to Coingecko data, May 8 was the last trading day for BTC below $100,000, meaning that as of June 19, it had been above this level for 42 days.
Meanwhile, Blockchair data shows that BTC has been above $100,000 for 43 days, forming a new resistance level, which some technical analysts believe. During this period, BTC hit a new all-time high on May 23, surpassing the milestone previously reached on January 20. As of this writing, the top cryptocurrency is trading just above $104,000, which is familiar territory for BTC in June.
Prior to BTC’s return to six figures in U.S. dollar terms in early May, BTC spent more than 60 days trading below $100,000 amid global market turmoil caused by the trade war sparked by U.S. President Donald Trump’s “reciprocal tariffs.” At the time, BTC’s significant correlation with traditional assets and markets seemed to weaken its claim as a safe haven asset.
However, since dropping below $75,000 on April 7, BTC has trended upward, rising by about 50% to near $112,000 about 45 days later. Since then, BTC has fluctuated between $110,000 and $100,000, with major global events, including Israel’s launch of its attack on Iranian nuclear facilities, seemingly failing to push it below $100,000, according to Coingecko data.
Not only has the flagship cryptocurrency remained above $100,000 for more than 40 consecutive days, it also celebrated a significant operational achievement in June: more than 6,000 days of continuous uptime.
According to Bitbo, the Bitcoin network has been operating uninterruptedly since its inception at 02:54:25 GMT on January 3, 2009. Aside from two isolated incidents in its early history (one in 2010 and one in 2013), this uptime record has remained unimpaired, highlighting the network’s unparalleled resilience and robustness. These recent achievements further solidify BTC’s place as a stable and enduring digital asset and an increasingly established player in the global financial landscape.

Sidelined Due to Geopolitical Tensions in the Middle East🛑 Sidelined Due to Geopolitical Tensions in the Middle East
Due to the rising geopolitical tensions and the ongoing conflict in the Middle East, I’ve decided to stay out of the market for now. War-related news often triggers short-term volatility, driven more by fear and uncertainty than technical or fundamental analysis. I prefer to wait until the market stabilizes and the emotional reactions fade, allowing for more reliable trade setups.

BTC dump time , fake breakout, watch US news todayAny US strike on Iran will lead to a big dump in price

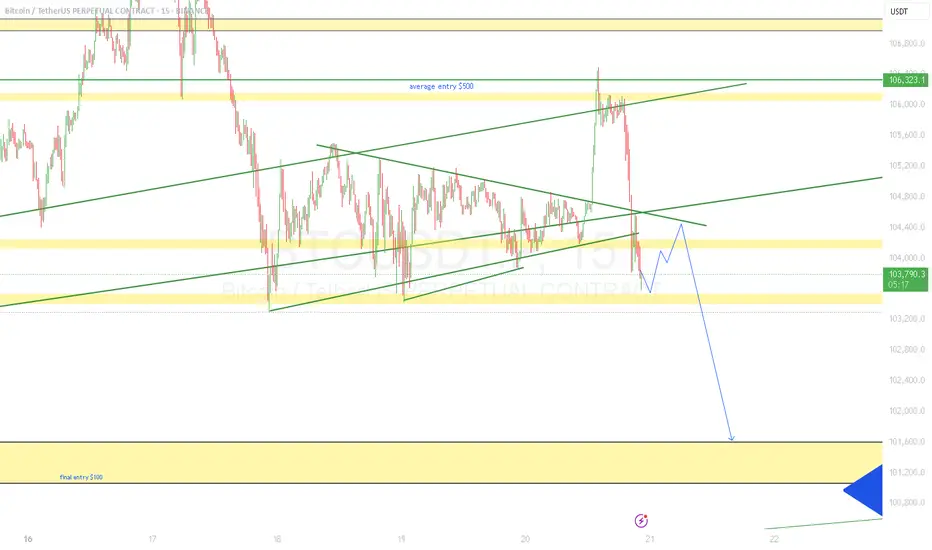
BITCOIN → Possibility of retesting 100K. Buyer weakeningBINANCE:BTCUSDT.P is in consolidation after the rally stalled due to the exhaustion of the bullish driver. The price updates local lows and starts looking at 100K
Bitcoin is under pressure after the escalation of conflict in the middle east and after the FOMC speech. There is also another observation: large companies, politicians, funds and investors have long and aggressively motivate the crowd to buy, verbally confirming that they bought dozens and hundreds of bitcoins at a time for the balance, but bitcoin is standing still and updating lows. At the same time, various services such as "cryptorank" fix bullish sentiment at the lows. The market either lacks liquidity or something more unpredictable is happening (chart drawing????)
Technically, bitcoin is following the behavior of the SP500 quite strongly, which closes Friday's session quite weak and close to key support, which could trigger a continuation of the decline. Bitcoin won't stay on the sidelines and could also follow the index....
Resistance levels: 104K, 105K, 106K
Support levels: 102K, 100.6K, 97.5K
The price is coming out of the “symmetrical triangle” consolidation breaking the support, thus confirming the bearish mood. After a small correction after a false breakdown of 102500 the price may again return to storm (retest) the level under market pressure, which will only strengthen expectations of further decline. The target is liquidity 100600 - 100K. From 100K rebound and growth is possible.
Regards R. Linda!

Most likely scenario for BitcoinI am tired of all analysts just saying that we are going down to 70k or up to 200k in one go.
So let me add a small informative chart for all people new or lost.
Don't get me wrong, i am bullish mid and long term but right now we are in the middle of a strong correction but shouln't last long.
We could have been super bullish above 106k but the price broke down with strength.
Now we see a super clear 5 wave movement down.
Currently we are in the 4 wave, trying to bounce back to the 106k area and doing a classic 4 wave ABC correction.
The bounce lacks volume so the most likely scenario is completing the 5 wave. We might get to the 101k area and ONLY THEN we can see what could happen.
If you are a futures trader, do it with caution and small leverage.
If you are a long term investor, these are perfect areas to buy more.
Good day to everyone.

BTC channels chart Here I provide you what I believe to be BTC channels down trend channels in terms of being bullish each dotted channel is median and all darken red are tops and bottoms currently we are at median level and as long as we hold this level we can get a bounce to top channel if not then targets of bottom channel it may not be clear the first time but trying channels can provide extra clarity and here’s my chart to witness the BTC breakouts since 2022

BTC 4H Analysis📈 BTC 4H Analysis – Symmetrical Triangle Breakout Loading
Bitcoin is currently consolidating inside a Symmetrical Triangle, forming higher lows and lower highs – a classic sign of volatility compression.
🔹 Structure: Symmetrical Triangle
🔹 Support Holding Strong – bulls defending the zone
🔹 Breakout Expected Soon
🔹 Major Resistance: $110,200
🔹 Breakout Target: $112,000+
Price is coiling up. Break above the triangle = strong bullish continuation likely.
🚀 Eyes on breakout — next move could be explosive!
NFA | DYOR

$BTCUSD Predictions support line
Bitcoin traders, get ready for an epic ride! This chart shows BTC still has to hit the price target from the Cup & Handle breakout, pushing it toward a major channel resistance! Once it peaks, a bear market could kick in, driving prices down to the support line. Buckle up for the volatility ahead!

btc chipping down de road This is de rasshole fractal—the fractal from the future, the one whispered through the blockchain by quantum echoes of bull runs past, the one that knows, that sees, that is. It bends time, folds sentiment, loops liquidity through dimensions you haven’t even leveraged yet. It doesn’t care about your indicators, your trendlines, your cousin’s TA on Reddit—it just exists, pulsing with the inevitable. You can squint at it, laugh at it, ignore it—but it’s already printed, already fulfilled, already written in the candlesticks of destiny. Don’t try to understand it. Just feel it. Because the fractal knows: the price is going up. Did you buy the dip, or are you still refreshing?

BTCUSDT-– Symmetrical Triangle Breakout LoadingBitcoin is currently consolidating inside a Symmetrical Triangle, forming higher lows and lower highs – a classic sign of volatility compression.
🔹 Structure: Symmetrical Triangle
🔹 Support Holding Strong – bulls defending the zone
🔹 Breakout Expected Soon
🔹 Major Resistance: $110,200
🔹 Breakout Target: $112,000+
Price is coiling up. Break above the triangle = strong bullish continuation likely.

BTC Drops again ?
**Mastering Zones: Your Quick Trading Guide!**
Remember the core logic:
* **🔵 Blue Zone:**
* **PUMPS FROM BLUE** (Look for buys!)
* **DUMPS IF BREAKS BLUE** (Consider sells/exit longs!)
* **🔴 Red Zone:**
* **DUMPS FROM RED** (Look for sells!)
* **PUMPS IF BREAKS RED** (Consider buys/enter longs!)
Apply this to your charts for clear signals. Stay sharp!

BTC Short | FVG Setup + RSI Filter | 18.06
Smart Money Concept | Intraday Trade | 1:2 RR
🔍 The setup:
Today I was watching for a short opportunity.
Price reached a key level and formed a bearish FVG — looked clean at first.
But I held off entering because I noticed RSI divergence — a red flag I always consider when expecting a potential level break.
💡 Why it matters:
RSI divergence often signals weakness in momentum.
For me, it's a key filter that helps avoid fake breaks — this was a good example of how I apply it.
📈 What happened next:
Price moved up to test the 1H FVG (zone #2) and formed another FVG slightly lower.
That second one was my entry point for the short.
🎯 Target:
I exited at a 1:2 risk-reward, which is my minimum.
The day was ending, and I didn’t want to hold the position longer — I’m not convinced the down move would continue cleanly (possible wicks or traps).
🤔 Question to the community:
How do you filter FVG entries?
Do you also use RSI or wait for structure shifts?
And what’s your outlook on BTC from here?


Will History repeat itself for BTC?Why Bitcoin Could Fall
Historical pattern?
-Bitcoin seems to be replicating the old crash from 60k.
Regulatory or policy uncertainties
-Future regulation remains uncertain; unexpected rulings or crackdowns could reduce institutional appetite and lead to pullbacks.
Dependence on economic sentiment
-If global liquidity tightens or equities falter, Bitcoin could behave like a high-risk asset and decline sharply
Current War situation
-The effecs of the Iran-Israel war will affect BTC as USD is seen as a risk-off asset (so if USD goes up, then BTC goes down)
-Disclaimer: This analysis is for informational and educational purposes only and does not constitute financial advice, investment recommendation, or an offer to buy or sell any securities. Stock prices, valuations, and performance metrics are subject to change and may be outdated. Always conduct your own due diligence and consult with a licensed financial advisor before making investment decisions. The information presented may contain inaccuracies and should not be solely relied upon for financial decisions. I am not personally liable for your own losses, this is not financial advise.


What is what I think BTC is bearish short to full the FVGs if you look very closely to the chart. Full the gaps and back up for a long

$BTC has seen neither wars nor crises nor antics.CRYPTOCAP:BTC has seen neither wars nor crises nor antics. But it is still here and still rising. What do you see in this chart? I do not recommend investing in the rise. I may be wrong about buying with what I wrote, but I am bullish flag technology in this chart. 100k 99k needles can be thrown but it will go up after closing the day under it.

