Market Overview
WHAT HAPPENED?
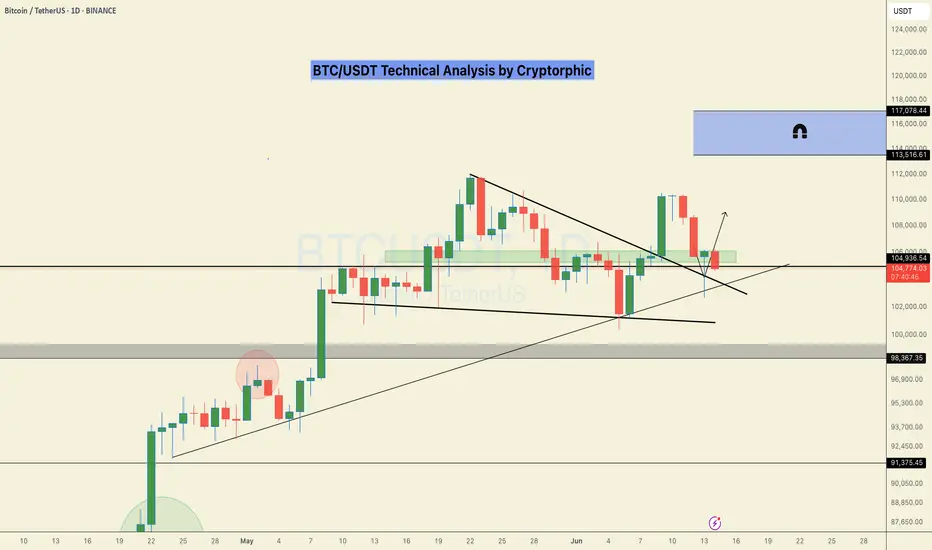
Strong sales resumed last week after a short period of growth. This was provoked by the escalation of the conflict in the Middle East.
After testing and fixing the $105,800-$104,500 zone (accumulated volumes), strong volume deviations appeared, which should be perceived as protection on the part of the buyer.
WHAT WILL HAPPEN: OR NOT?
At the moment, an attempt is being made to position the volumes accumulated in the range of $105,600-$104,700 in the direction of growth. Strong support has already been formed in the area of $104,000-$102,900 (abnormal volumes).
When the four-hour candle closes above the $106,400 mark, it’ll be possible to additionally consider the zone of accumulated volumes for buys (if there is a reaction from it).
The main scenario is a long position with targets up to the nearest resistance. In case of easing of geopolitical tensions, there remains the possibility of updating the ATH.
Alternative scenario: correction to the support zone of $101,600-$100,000 (volume anomalies). With this development, a prolonged rebound is possible.
Sell Zones:
$109,000–$110,000 (accumulated volume)
Buy Zones:
$105,600–$104,700 (accumulated volume)
$104,000–$102,900 (volume anomalies)
$101,600–$100,000 (significant volume anomalies)
$98,000–$97,200 (local support)
Level at $93,000
$91,500–$90,000 (strong buying imbalance)
IMPORTANT DATES
Macroeconomic developments this week:
• Tuesday, June 17, 03:00 (UTC) — publication of the Japanese interest rate decision;
• Tuesday, June 17, 12:30 (UTC) — publication of the core retail sales index for May in the United States, the volume of retail sales for May in the United States;
• Wednesday, June 18, 06:00 (UTC) — publication of the UK consumer price index compared to May last year;
• Wednesday, June 18, 9:00 (UTC) — publication of the consumer price index in the Eurozone compared to May last year;
• Wednesday, June 18, 12:30 (UTC) — publication of the number of initial applications for US unemployment benefits;
• Wednesday, June 18, 18:00 (UTC) — publication of FOMC economic forecasts, FOMC statement, US Federal Reserve interest rate decision;
• Wednesday, June 18, 18:30 (UTC) — US FOMC Press Conference;
• Thursday, June 19, 7:30 (UTC) — publication of the Q2 interest rate decision in Switzerland;
• Thursday, June 19, 8:00 (UTC) — press conference of the National Bank of Switzerland;
• Thursday, June 19, 11:00 (UTC) — publication of the June interest rate decision in the UK;
• Thursday, June 19, 12:30 (UTC) — publication of the number of initial applications for unemployment benefits in the United States;
• Friday, June 20, 12:30 (UTC) — publication of the Philadelphia Federal Reserve's index of manufacturing activity for June in the United States.
*This post is not a financial recommendation. Make decisions based on your own experience.
#analytics
USDTBTC trade ideas

Kingbtc 3 4hWelcome to KIN BTC 3. It is expected that Bitcoin can form an upward step, initially reaching 108,200. After that, with a lower probability, a higher peak may also be formed. However, ultimately, the level of 88,700 is expected to be seen.


This isn’t a breakout. It’s a return to senderPrice didn’t rally from randomness — it tapped directly into a daily OB, respected it, and is now marching toward unfulfilled inefficiency above. What looks like recovery is really just Smart Money closing the loop.
The logic:
Price swept sell-side liquidity into a deep daily OB and rebounded sharply — not passively. The response wasn’t a bounce. It was intention.
Above? Two clean destinations:
TP1: 110,950 — inefficiency fill and EQ of prior supply
TP2: 112,033 — full delivery into unmitigated structure
No overlapping zones, no chaos — just precise levels that haven’t yet been claimed.
Execution:
Entry: 104,200–105,000 range
SL: Below 103,800
TP1: 110,950
TP2: 112,033
The risk is defined. The reward is prewritten.
Final thought:
“This move wasn’t built to excite you. It was built to deliver.”

Accumulate, BTC back above 110K💎 BTC PLAN UPDATE (June 16)
NOTABLE BITCOIN (BTC) NEWS:
Bitcoin (BTC), Ethereum (ETH), and Ripple (XRP) are showing signs of stabilization around key support levels following last week’s correction. BTC is attempting to regain momentum after closing below a critical support zone, while ETH and XRP are hovering near technical thresholds that could determine their next directional move.
TECHNICAL ANALYSIS OUTLOOK:
Bitcoin could decline further if it closes below the 50-day EMA
Bitcoin closed below its daily support at $106,406 on Thursday, then bounced back after retesting the 50-day Exponential Moving Average (EMA) at $102,893 on Friday. BTC has since stabilized around the $105,000 level over the weekend. As of Monday, it continues to consolidate, trading near $105,788.
If BTC fails to close above the $106,406 resistance level and heads lower, it may extend its decline toward the psychologically significant $100,000 level.
The Relative Strength Index (RSI) on the daily chart is hovering around the neutral 50 mark, signaling indecision among traders. Meanwhile, the Moving Average Convergence Divergence (MACD) indicator shows a bearish crossover on the daily chart, indicating selling pressure and a possible downtrend continuation.
At this stage, whether you're new or experienced, it's wise to spend more time practicing, deepening your technical analysis knowledge, and exploring educational content shared on the channel. Strengthening your foundation will help you protect your capital in this volatile environment.
==> This analysis is for trend reference only. Wishing all investors successful trades!

#BTC URGENT UPDATECRYPTOCAP:BTC Update:
Keeping it simple, yesterday’s daily candle printed a nice hammer, but today’s candle looks rough.
That said, things can flip fast in this market.
🔹 Close above previous day’s high: Trend remains intact
🔹 Close above $103,500K: Bullish structure holds
🔹 Break below $102,600: Bearish, could open the door to low $90Ks in the coming weeks
We’re stuck in a tight zone. It's best to stay patient until we get a breakout in either direction.
DYOR, NFA
Let me know what you think, and hit the like button if you like it.
Thank you
#PEACE
$BTC Breakout Targets $125KCRYPTOCAP:BTC has broken out of a falling wedge and is holding strong above the $103K support zone.
Price is pushing upward toward the key resistance at $110K– $112K.
A breakout above this zone could trigger a move toward $125K.
DYRO, NFA

Monday trades of the day🔥 These are the scalps I’ve got my eye on today. 🔥
Mostly looking at continuation longs — unless structure tells a different story.
💡 Key Plan:
For each long setup, I’ll wait for an internal market structure (MS) flip before pulling the trigger. No confirmation, no entry. Precision is the priority.
📅 Class Schedule:
Monddaday | After 6 PM

MARKET TECHNICAL BREAK DOWN FOR 16TH TO 20TH JUNE📊 Market Technical Breakdown – EURUSD, AUDUSD, XAUUSD & BTCUSDT 🔍
Traders,
Get ready for this week’s precision-driven analysis across four major markets:
✅ EURUSD – Is the euro gaining strength or facing more downside?
✅ AUDUSD – Key zones to watch as the Aussie reacts to USD data.
✅ XAUUSD (Gold) – Will gold hold strong or give in to bearish pressure?
✅ BTCUSDT – Bitcoin’s momentum shift: Are bulls still in control?
This breakdown covers:
🔹 Clean chart analysis
🔹 Key levels (support & resistance)
🔹 Trade ideas with potential entries & exits
🔹 My personal trading insight for each pair
🎯 Whether you're a beginner or a seasoned trader, this breakdown will help sharpen your bias and build confidence in your trades.
👉 Watch the video till the end to catch all setups, confirmations, and bonus tips for the week.
Drop a comment if you found it helpful or want to see a pair included in the next breakdown!

My BTC Play With a Macro BoostThis isn't about guessing.
This isn’t hype.
This is what happens when structure, liquidity, and macro fundamentals align.
Let me break it down:
Technical Perspective
BTC just pulled a classic trap.
✅ Liquidity Sweep: Price dipped below the 4PDL (Previous Day's Low), sweeping out late longs and triggering emotional shorts.
✅ Break of Structure (BOS): Price broke cleanly broke strucutre, confirming bullish intent.
✅ Fair Value Re-entry Zone: We now have a clean FVG zone if price pulls back.
But that’s not all...
🔼 Retail Pattern Detected :
Look closely, there's a textbook ascending triangle in there. Retail traders often use it to predict bullish breakouts. What they see as a triangle, we see as smart money coiling pressure before the move.
Fundamentals Supporting the Structure
This move isn’t just technical, it’s backed by real market weight:
Public companies are buying Bitcoin by the billions: MicroStrategy, Trump Media, Metaplanet they’re not “speculating,” they’re storing BTC as a treasury asset.
Institutional inflows are accelerating: ETFs, sovereign interest, and large-cap investors are building long positions — and it’s beginning to reflect in the chart.
The U.S. is formalizing a Bitcoin reserve policy.: Call it political, strategic, or monetary — either way, it reinforces that dips like this are being bought by giants.
The candle doesn’t lie but neither does the macro narrative when they both point in the same direction.
Mindset Tip: Ride Logic, Not Emotion
This setup teaches us something important:
You don’t have to catch every move. You just need to understand why it moved — and position accordingly.
If it pulls back, don’t panic. Let the market invite you, not rush you.

BTC BITCOIN ,we are watching every step and price action,the next clear directional bias on long will be on the break and close of daily supply roof at 111k, while the sell confirmation will be on the break and possible retest of the daily ascending trending line holding buyers for today 16th.
Israel and Iran war could be seeing liquidity into crypto especially bitcoin


BTCUSDT - UniverseMetta - Signal#BTCUSDT - UniverseMetta - Signal
D1 - Retest of the trend line + formation of a potential 3rd wave in continuation of the uptrend. Stop behind the minimum of the 2nd wave.
Entry: 106342.27
TP: 112508.54 - 116913.01 - 123639.84 - 130847.16
Stop: 102578.45

BTC accumulates, back to 108,500Plan BTC today: 16 June 2025
Related Information:
The price of gold is nearing its all-time high as tensions in the Middle East escalate, but analysts say they’re doubtful Bitcoin will do the same as investors prioritize other safe-haven assets.
The price of gold rose to $3,450 per ounce on Monday, just $50 shy of its all-time high of just below $3,500 in April, according to TradingView.
The usually slow-to-move asset has gained a whopping 30% since the beginning of the year, catalyzed by US President Donald Trump’s trade tariffs and, more recently, an escalation of military action in the Middle East following an Israeli missile strike on Iran on June 13, which caused Bitcoin prices to fall.
Gold prices have also been linked with inflationary pressures, as it is considered a safe haven and an inflation hedge by investors.
personal opinion:
The crypto market recovered at the beginning of the week after being affected by war news. It will almost certainly continue to maintain the 4.5% interest rate, so it will be difficult to break ATH this week.
Important price zone to consider :
Sell point: zone 108.400 - 108.600 SL : 109.100
Take profit : 107.900 - 107.000 - 106.000
Sustainable trading to beat the market
16/06/25 Weekly OutlookLast weeks high: $110,507.76
Last weeks low: $102,655.69
Midpoint: $106,581.52
With all eyes on the ever escalating geo-political landscape, how did BTC react and what can we see for this week?
The initial move higher broke through the previous weeks high with strength before a triple top just under ATH, then falling back down towards the lows of $102,650 which was the previous weeks midpoint, both levels were key battlegrounds as pointed out in the last weekly outlook.
Now the midweek fall off could be blamed by the escalating conflict in the middle-east, that is an argument that has merit as risk-on assets naturally take a hit when uncertainty enters the market. From a TA standpoint BTC had three separate attempts at $110,500 and failed it, the bulls therefore have to retreat as the battle is lost and have expended their resources. So I see it as a both FA and TA are responsible for the move.
As the week starts with a positive early move the orderblock at 0.75 line looks like the next key battleground, rejection at that level would see BTC enter a more rangebound environment within the weekly range. Flipping $108,500 makes a weekly high retest probable IMO.
I do believe that the geo-political aspect will play a role this week so volatility is expected.
Good luck this week everybody!

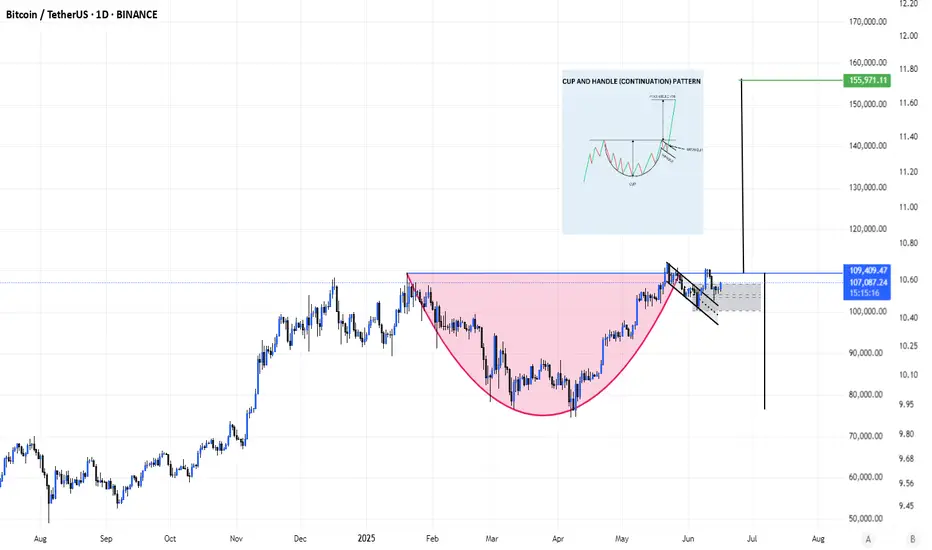
BTC/USDT.dBtc forming a beautiful Cup and Handle chart pattern. Target is $150k roughly. Price should really move hard once BTC goes above the neckline into price discovery. This is a good risk to reward setup. Enjoy!
Bitcoin Attepmpts a Comeback with the Break of 106350Bitcoin is break above the key 106350 resistance and continues to rise. As long as BTC stays above this level, short-term bullish outlook remains intact.
The biggest risk for crypto right now is its correlation with the stock market. With the July 9 tariff deadline approaching and the Israel–Iran conflict raising broader market and oil price risks, a potential selloff in equities could weigh on crypto as well.
The good news for crypto is Ethereum's strength. In the last bull cycle, when BTC neared the cycle top, ETH began to lead, pulling altcoins up with it. While the market doesn’t appear to be at that stage just yet, recent inflows into Ether ETFs suggest that BTC could be nearing its final leg higher.
In the short term, 108350 is the first level to watch.

BITCOIN BITCOIN weekly candle closed respecting the demand ascending trendline and we have seen buyers return against speculation from elite traders,
the retest of daily roof will be watched for potential rejection at 111-117k, and i will be watching 125k-136k ascending trendline roof should we have a daily break of structure above the current ALTH.
keep eyes on break of the current floor break out on daily, close below will be a a new week rejection ,where we will likely hold sell into 98-97k zone .

BtcBtc direction is turned over in to huge sell and bear whale is active now the trading price will go to ward 99k lets keep on eye

Bitcoin (BTC): Gameplan Remains Same | Bullish Start of WeekBitcoin is showing signs of recovery, where buyers are taking over the Monday lows and pushing prices to upper zones. Now that we see the recovery, we are back in play, expecting the price to reach the ATH area once again, where we will be looking then for $120K.
Swallow Academy

BTCUSDT Daily: Analyzing Key Support & ResistanceChart Overview:
BTCUSDT Chart indicates the price action from a bearish phase into a significant bullish reversal and subsequent consolidation. Key price levels, market structure shifts, and Fibonacci retracement zones are highlighted, offering potential areas of interest for traders.
1. The Bearish Phase & Breakdown (February - April):
• Initial Downtrend: The price initially depicts a downtrend characterized by a series of lower highs and lower lows, indicating strong bearish control.
• "Break Down": In late February/early March, price decisively broke below a significant support level (indicated by the "Break Down" label). This confirmed the continuation and strength of the bearish momentum, pushing BTCUSDT to lower lows around the $76,000 region.
2. The Market Structure Change (Late April - Early May):
• Trend Reversal: Following the lows in April, we observe a strong bullish impulse. This rally culminated in price breaking above a critical resistance zone (highlighted by the upper grey box labeled "Market Structure Change").
• Significance: This "Market Structure Change" is a pivotal event. It signifies a shift from bearish control (lower highs/lows) to bullish dominance (higher highs/lows), as previous resistance becomes potential support (a "flip" level). This is often the first major sign of a trend reversal.
3. The Bullish Impulse & All-Time High (May - Early June):
• Strong Uptrend: After the market structure change, BTCUSDT experienced a powerful bullish move, establishing new higher highs.
• "All Time High at $112,000": The price reached a new all-time high around $112,000 (specifically labeled as 111,999.0). This peak marks the top of the measured bullish impulse, which serves as the anchor point for the subsequent Fibonacci retracement.
4. Current Consolidation & Fibonacci Retracement (June - Present):
• Pullback from ATH: Following the new all-time high, BTCUSDT has pulled back and entered a period of consolidation, exhibiting a ranging behavior.
• Fibonacci Retracement: A Fibonacci retracement tool has been applied from the significant swing low (around $93,389.7, which is the 1.0 Fib level relative to the ATH) to the "All Time High." This tool helps identify potential support levels where price might find buyers during a pullback.
o "Daily Immediate Support": This area, approximately between $102,694.4 (0.5 Fib) and $100,498.5 (0.618 Fib), has acted as strong immediate support. Price has bounced from this zone multiple times, confirming its significance. The 0.618 Fibonacci level is often referred to as the "Golden Ratio" and is a highly watched retracement level for potential reversals or strong support.
o "Daily Key Support": This deeper support zone, around $93,389.7 (which aligns with the 1.0 Fib of the previous swing and the prior "Market Structure Change" area), represents a critical level. If the "Daily Immediate Support" fails, this zone would be the next major test for bullish continuation. Its alignment with the previous market structure change adds to its importance as a "flip" level (former resistance turned support).
• "Daily Target": The label "Daily Target" is positioned near the previous highs/resistance. In the current context of consolidation and pullback, this area now acts as a key resistance zone that bulls would need to overcome to resume the uptrend towards new all-time highs. It represents the immediate bullish objective.
Potential Scenarios:
• Bullish Continuation: If BTCUSDT continues to hold above the "Daily Immediate Support" (green zone) and then breaks above the "Daily Target" resistance with conviction, it would signal a likely continuation of the uptrend towards new all-time highs above $112,000.
• Deeper Retracement: A breakdown below the "Daily Immediate Support" would likely lead to a test of the "Daily Key Support" (lower grey zone). A strong bounce from this level would still keep the bullish structure intact for the larger timeframe.
• Trend Invalidaton/Reversal: A decisive break below the "Daily Key Support" (lower grey zone / 1.0 Fib of the prior swing) would be a significant bearish development, potentially invalidating the recent bullish market structure and indicating a deeper correction or even a reversal of the current uptrend.
Conclusion:
BTCUSDT is currently in a consolidation phase after a strong rally to new all-time highs. The immediate focus is on whether the "Daily Immediate Support" holds. Traders should closely monitor price action around both the immediate and key support zones, as well as the "Daily Target" resistance, for clues on the next directional move. Volume confirmation for any breakouts or breakdowns will be crucial.
Disclaimer:
The information provided in this chart is for educational and informational purposes only and should not be considered as investment advice. Trading and investing involve substantial risk and are not suitable for every investor. You should carefully consider your financial situation and consult with a financial advisor before making any investment decisions. The creator of this chart does not guarantee any specific outcome or profit and is not responsible for any losses incurred as a result of using this information. Past performance is not indicative of future results. Use this information at your own risk. This chart has been created for my own improvement in Trading and Investment Analysis. Please do your own analysis before any investments.

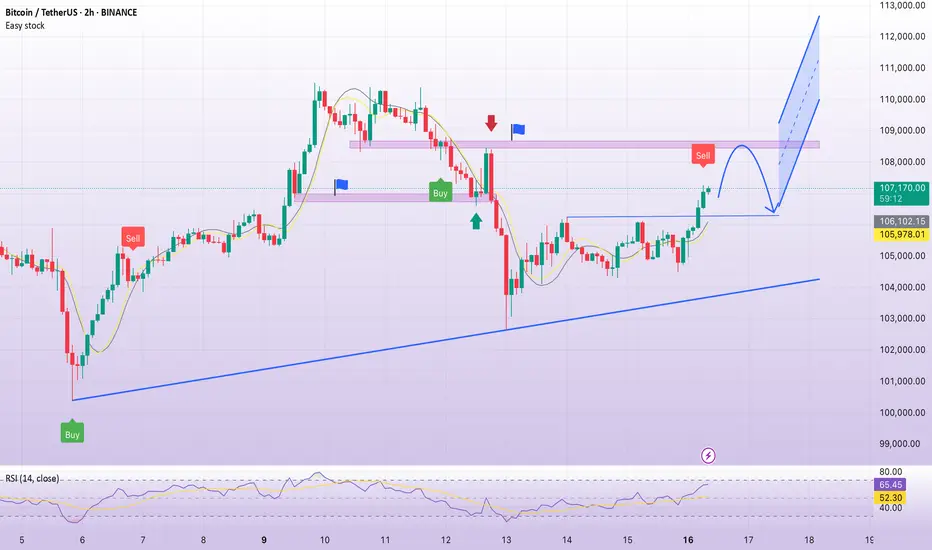
Lingrid | BTCUSDT potential Bullish Continuation After PullbackThe price perfectly fulfilled my last idea . BINANCE:BTCUSDT has formed a higher low after rebounding from the trendline near $104K and is attempting to stabilize within a minor range just above $105.5K. The broader structure shows a clean breakout from the downward trendline, followed by consolidation, suggesting accumulation. A bounce from the $105K–$105.5K support area would favor a continuation toward the $109K resistance level.
📈 Key Levels
Buy zone: 105,000–105,500
Sell trigger: break below 104,800
Target: 109,000
Buy trigger: close above 106,800 with strong volume
💡 Risks
Breakdown of support could retest the $100K region
False breakout may trap bulls above $106K
External macro news could trigger short-term volatility
Traders, if you liked this idea or if you have your own opinion about it, write in the comments. I will be glad 👩💻

Bitcoin bullish It broke resistance 106,124.30 same will happen with Nas and Us30 as they follow Bitcoin movements
