BTC dump time , fake breakout, watch US news todayAny US strike on Iran will lead to a big dump in price
USDTBTC trade ideas

BTC has made the perfect market conditions for a trade. BTC setup is very clear. Why? Because the structure is clear. The current price is an inflection point; both bears and bulls are watching to make their next move. May the strongest of the two prevail. 95k or 110k?
Full TA: Link in the BIO
Bitcoin Crash Predicted! Here are the next targets! Bitcoin is crashing as predicted, and here I am showing you the next targets, and the changes in market structure that would make me take profits earlier!
Enjoy and feel free to smash the rocket button if you feel the bearish vibe!

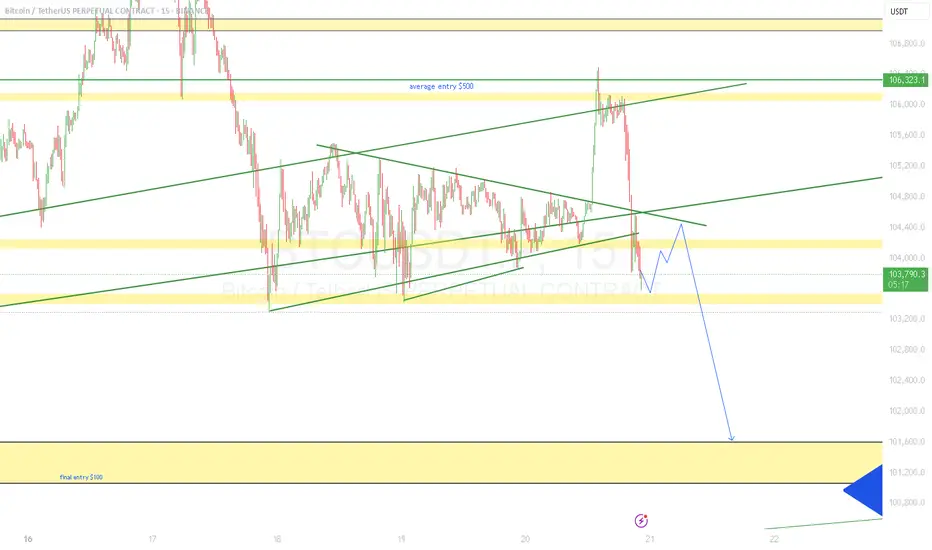
Btc seizes the opportunity to trade with the trendTechnical analysis of BTC contract on June 20:
Today, the large-cycle daily level closed with a small negative line yesterday, and the K-line pattern was a single positive line with a continuous negative line. The price was below the moving average, and the attached indicator was dead cross and running downward, but we should note that the overall volatility this week was not large, and the fluctuation was in a small range. So we should pay attention to keeping short-term trading and closing profits in time. Don't hesitate, drag, and don't think about a big rise or fall. After a large drop on Tuesday this week, the short-term hourly chart has entered a small range of fluctuations. There is no continuation or breakout, so we should just follow the trend. We have sold at the high point of 105,500 as a defense, and bought at 103,000 as a defense, for short-term trading.

$BTC Probable scenarios.I think the chart speaks for itself. Technical targets for both RSI and Price Actions are noted in the chart.

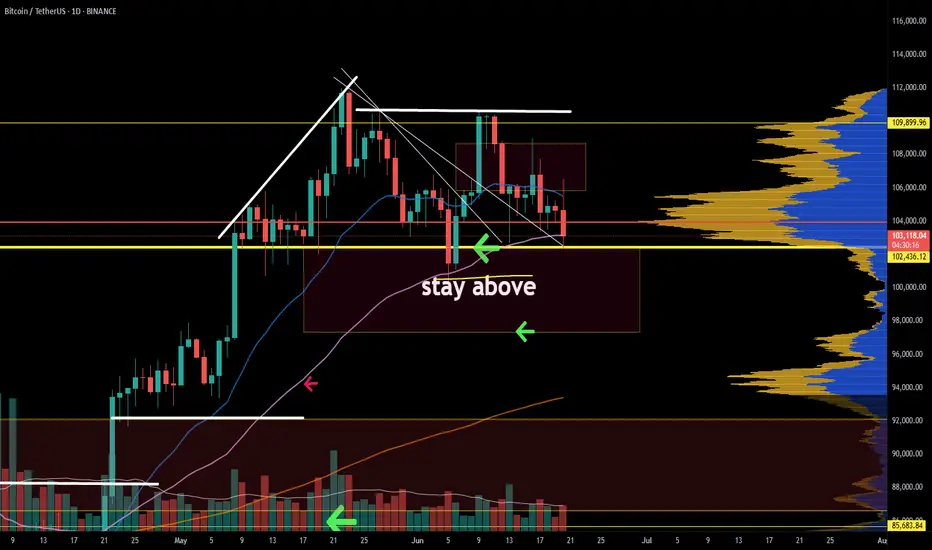
Evening BTC Market Analysis and Trading RecommendationsToday, U.S. markets are closed, leading to light trading activity and relatively limited overall market volatility. From a technical analysis perspective, the 4-hour K-line chart currently shows prices trading below the middle band of the Bollinger Bands, exhibiting a classic range-bound consolidation pattern. Bulls and bears are locked in a tug-of-war between key support and resistance levels, with K-line formations alternating between bullish and bearish patterns.
In terms of chart structure, the lower support zone has demonstrated strong buying conviction, while the upper resistance level has exerted clear restrictive force. Multiple failed upward breakouts have formed a short-term top. This box consolidation—characterized by resistance above and support below—is expected to sustain sideways trading through Friday.
Against the backdrop of no major positive catalysts, bearish momentum may gradually dominate if no substantial bullish triggers emerge. Maintain a trading strategy of selling into strength.
BTCUSDT
105000-105500
tp:104000-103000
Investment itself is not the source of risk; it is only when investment behavior escapes rational control that risks lie in wait. In the trading process, always bear in mind that restraining impulsiveness is the primary criterion for success. I share trading signals daily, and all signals have been accurate without error for a full month. Regardless of your past profits or losses, with my assistance, you have the hope to achieve a breakthrough in your investment.

CHECKL BTCUSDT SIGNAL READ CAPTAINEntry: around(102893.55)102653.66 ✅
Take Profit 101732.58✅
Take Profit 2: 101231.00✅
Last Target:100412.00 ✅
Stop Loss: 103304.27❌

BTCUSDT - 4H Supply-Demand + Order Flow ViewBINANCE:BTCUSDT is struggling to hold above the 103K zone, which has now flipped into resistance. Price recently tapped into the 104K–105K supply zone and faced rejection, confirming bearish pressure. The most recent short entry aligns with overhead liquidity absorption and weakness near the high-volume node (~105K) on the volume profile.
We're now revisiting the previous demand zone (101K–102K), which has held multiple times but is weakening. A breakdown below this level opens up the next major demand zone around 98.5K–99K and possibly 94K if momentum accelerates.
🔻 Bias: Bearish unless 104K is reclaimed.
🔍 Watching: Reaction at current support and volume cluster near 100K.
📊 Tools Used: S/D Zones, VWAP, Volume Profile, Confirmation Indicators.
📌 Trade safe. Set alerts and don’t chase.

BTC Testing Crucial Support – Breakdown or Bounce ?Bitcoin is currently testing a critical support zone around $103,573 – a break below could trigger a sharper move toward $101,400.
Price rejected from ~$105.8K
Support holding... for now
RSI dropping fast – now near 34 (1H TF)
Weakening momentum visible
This level is the last line of defense for bulls. If it cracks, expect volatility.
Watch closely. Break = panic or buying opportunity?
DYOR. Not Financial Advice.

#BTC URGENT UDPATE Plus ALTCOINS Strategy.CRYPTOCAP:BTC UPDATE:
Bitcoin looks critical at the moment. The 50 EMA supports nearly $103K if this level breaks, we could see a drop toward $98.5K.
The current structure doesn’t look promising, and it’s wise to stay on the sidelines for now.
Altcoins may offer better opportunities once those lower levels are reached.
The strategy is to ladder in slowly when there are signs of reversal, until then we stay put!
Remember: nothing goes up forever, and nothing goes down forever.
Geopolitical tensions might be fueling this move, but I believe better days are ahead.
Stay patient.
Avoid high-leverage trades during this choppy, sideways price action.
Stay tuned, I’ll keep you updated the moment signs of a reversal appear.
Let me know what you think in the comment section and hit that like button if this post helped you in any way.
Thank you
#PEACE

btc short setupSL 10500
tp 102500
with ongoing world events and liquidations available at that range, its very much possible that bitcoin will and must tap 102 or lower for a creating fear and wiping retailers out. But short with caution might give fake outs to trap longs.
thanks
BTC- Bounce here or 93K incomingWhatever WTI does.. will determine what the Stock Market does.... which will determine what BTC does.. which will determine what all of Crypto does..

RangesReturning to range low form here is normal price action. Breakout to one side, breakout to the other, before the real breakout happens — most likely in the direction of the bigger trend, which is up.

Everyone Talks Charts — But the Order Book Knows FirstHello, Traders! 🤓
Everyone watches the chart. But not everyone watches the market itself. If you’ve ever wondered why the price suddenly jumps or stalls just below resistance, you’re likely looking at the surface, not the structure underneath. And that’s precisely what DOM in trading helps to reveal.
What Is DOM Trading?
Let’s start with the basics. DOM stands for Depth of Market, which shows real-time limit buy and sell orders at different price levels. Some traders call this the trading DOM. Unlike a candlestick, which tells you what already happened, the DOM trading view shows what participants intend to do. This makes it useful for those trying to understand short-term moves, liquidity pressure, or even the psychology behind a specific level.
So if you’re asking, “What is DOM in trading?” or “How does DOM work in crypto?” – it’s essentially a live x-ray of the market’s limit order book.
Order Book Trading in Crypto
The order book, the live list of buy and sell orders, acts like a constantly updating roadmap of trader intentions. In order book trading, it’s not just the numbers that matter but how they shift. For example, traders often notice thick sell walls near round numbers (e.g., $70,000 BTC), sudden order pulls, which can fake out breakout traders, and absorption, where big buy/sell orders are filled silently, without noticeable price change… When analyzed properly, this behavior gives context to price action, something traditional indicators can’t always offer.
How to Use Crypto Trendlines… and Then Watch DOM
Drawing trendlines in crypto is common. Everyone has their version of a breakout setup.
But what happens when the price reaches that line? That’s where DOM trading shines.
It doesn’t predict whether the line will hold or break, but it shows whether liquidity is building or backing away right at the critical moment. The combination of crypto trendlines and DOM behavior often exposes subtle market dynamics, a large bid appearing just as price touches support, for instance, or offers vanishing before a breakout.
That’s not about strategy. It’s about market structure awareness, watching both the levels and the surrounding behavior.
Chart vs DOM: Two Sides of the Same Story
The crypto psychology chart tells you what’s happened — highs, lows, closes. The DOM, on the other hand, shows live trader psychology. And that’s where the psychology of crypto trading gets interesting.
When everyone’s waiting for BTC to hit $100K, for example, you might already see: Buyers are stacking bids at $95K, hoping for a retrace. Sellers layering offers at $99.9K, defending the level. And the sudden orders near $100K, a possible trap. In this way, round numbers in trading aren’t just emotional, they’re structurally significant. Especially in crypto, where the market cap is still heavily influenced by sentiment.
Final Thought
Some traders find it useful to spend a few sessions just observing the DOM. Psychological numbers in trading, like $10K, $20K, or even the famous 100K BTC milestone, are often surrounded by unusual order book behavior. So, the next time price seems to move “out of nowhere,” ask yourself: Was it really out of nowhere… or did the DOM in trading already whisper it?
You don’t need to trade based on it. But knowing how to draw trendlines in crypto and then pairing that with DOM behavior can offer a sharper view of where the market might hesitate, reverse, or run. Sometimes, seeing how others are placing their bets matters more than where. What do you think?

Bullish Divergence on Daily TimeframeBullish posible ! Strong confirmation for BTCUSDT.
Good luck and DYOR

BTC - Key Battle Between Bulls and Bears – Symmetrical TriangleBitcoin ( BINANCE:BTCUSDT ) is currently consolidating within a Symmetrical Triangle , showing indecision among Bulls and Bears around the Support zone($104,380-$103,060) and just above the 50_SMA (Daily) .
From an Elliott Wave perspective, the current range may represent a WXY corrective structure . The market seems to be waiting for a breakout direction , potentially aiming to complete wave 5 after this correction.
The Monthly Pivot Point($103,300) and the presence of significant Cumulative Liquidation Leverage Zones (both Long and Short ) are key liquidity magnets to watch in the short term .
I expect Bitcoin to re-attack the Support zone($104,380-$103,060) AFTER breaking the lower line of the Symmetrical Triangle Pattern and decline to the targets I have outlined on the chart.
Note: Stop Loss: $106,703 = Worst Stop Loss(SL)
Please respect each other's ideas and express them politely if you agree or disagree.
Bitcoin Analyze (BTCUSDT), 1-hour time frame.
Be sure to follow the updated ideas.
Do not forget to put a Stop loss for your positions (For every position you want to open).
Please follow your strategy and updates; this is just my Idea, and I will gladly see your ideas in this post.
Please do not forget the ✅' like '✅ button 🙏😊 & Share it with your friends; thanks, and Trade safe.

Good moment for try to Buy BTCGood moment for try to Buy BTC. Very good down movement and now we make small step of the up. This point can be point for start to move new up trend with update local highest high. Stop to previous local low bar. Will see...

$BTCUSDT Eyes $120K After Key Support BounceBTCUSDT is holding strong above the ascending trendline and key support near $104K.
A fresh bounce suggests bullish momentum, with potential to break the $110K resistance.
If that happens, the next target could be around $120K. Trend remains bullish above support.
DYRO, NFA

continue to move accumulation: below 109,000💎 Update Plan BTC (June 20)
Notable news about BTC:
Semler Scientific (SMLR) unveiled an ambitious three-year strategy on Thursday aimed at significantly expanding its Bitcoin holdings to 105,000 BTC by the end of 2027. The announcement coincided with the appointment of a new executive to lead the firm’s digital asset initiative.
The Nasdaq-listed healthcare firm has named Joe Burnett as its Director of Bitcoin Strategy, a move it believes will strengthen its long-term treasury vision and enhance shareholder value. As part of this strategic shift, Semler Scientific plans to accumulate Bitcoin through a mix of equity and debt financing, alongside reinvested cash flows from its core business operations.
Technical analysis angle
BTC as well as XauUSD are trapped in the channel price 104k to 110k these are also two important milestones of BTC. Also congratulations to investors when detecting the bottom of 104k. The next expectation within the price channel is still maintained at 110k landmark
But with the recent moves of investors, the community is afraid that BTC will continue to adjust in the future.
==> Comments for trend reference. Wishing investors successfully trading

Squeeze Building in BTC – Targeting 100,500 ShortPrice is coiling between interest zones above and a heap of liquidity below. Expecting an impulsive break—looking to short down to ~100,500.

BTC/USDT Technical Analysis, 2025-06-18 09:45 UTC📘 BTC/USDT Scalping Setup – Whale-Assisted Dip Buy
This strategy is designed for high-precision, short-term long trades on BTC/USDT using the 15-minute chart. It targets oversold conditions with signs of reversal, confirmed by whale activity, volume spikes, and key support levels.
The edge comes from combining retail technicals (RSI, Stoch, MACD, candlestick patterns) with institutional confirmation (order flow, OBV, and large bids from whales).
✅ Key Strategy Components:
Oversold Technicals: RSI and Stochastic suggest price exhaustion.
Support Zone Alignment: Price is dipping near major support (pivot S1 or local low).
Reversal Candlestick: Clean bullish signals like Hammer or Engulfing show shift in sentiment.
Smart Money Confirmation:
Whale buyers (>5 BTC bids)
Bid dominance (>3%)
OBV rising = silent accumulation
Timing is Critical: Trades are only taken in the first 2 minutes of the 5-min candle with a volume burst.
🎯 Trade Management
Entry: On close of confirming candle (when all criteria align)
Take Profit: +1.2% (or ~1200 pts)
Stop Loss: -0.6% (or ~600 pts)
Risk/Reward: 1:2
📈 Why This Works
This is not just a basic RSI/Stochastic play — it’s a multi-confirmation strategy tuned for whale detection, volume acceleration, and institutional footprints. It’s ideal for high-volatility sessions and works best in range or retracement phases of a broader uptrend.
⚠️ Pro Tips
Avoid entries during extreme news volatility
Be disciplined – all filters must align (this is a precision setup)

Bitcoin– bearish momentum builds after rejection at $109KIntroduction
Bitcoin (BTC) is currently showing weakness after forming a lower high at $109,000. This level acted as a significant point of rejection, and since then, BTC has been moving lower. The price has broken through key support areas, indicating a possible shift in market structure. In this analysis, we’ll break down the recent price action, explain the technical signals behind the move, and discuss what could be expected in the short term.
Rejection from the 0.786 Fibonacci Level
The rejection at the $109,000 level aligns perfectly with the 0.786 Fibonacci retracement on the 4-hour timeframe. This level is often seen as a strong resistance point during corrective moves, and in this case, it held firmly. The precision of this rejection gives it more weight, and since hitting that point, BTC has been steadily declining. This move down suggests that buyers were unable to push through the resistance, leading to increased selling pressure.
Break of the 4H Bullish FVG
As BTC started its decline from $109,000, it broke through the bullish Fair Value Gap (FVG) that had formed earlier on the 4-hour chart. This gap previously served as a support zone but has now been decisively broken with strong volume. The loss of this level is significant, as it marks a breakdown of the bullish structure and opens the door for further downside movement. In the process of this move lower, BTC has created a new bearish FVG on the 4-hour timeframe. This gap remains open and could potentially act as a magnet for price to revisit, offering a possible short entry if price retraces into that zone. However, the clear break below the previous bullish FVG indicates a shift in momentum and supports a more bearish bias for now.
Downside Target at $102.7K
Given the recent breakdown, the next key level to watch is around $102,700. This area marks the wick low on the 4-hour timeframe and stands out due to the size and sharpness of the wick. Such large wicks often leave behind unfilled orders, which markets tend to revisit over time. The presence of these resting orders makes this level a likely target for the ongoing move down. It also acts as a strong area of potential support, where buyers might step back in if the price reaches that point.
Conclusion
With the rejection from the 0.786 Fibonacci level and the failure to hold the bullish 4H FVG, BTC has shown clear signs of weakness. The breakdown in structure suggests a continuation to the downside is likely, with $102.7k being the most immediate target. This level could serve as a strong support zone due to the unfilled orders left behind by the previous wick. Until BTC reclaims key support levels or shows a shift in momentum, the bias remains bearish in the short term, and traders should remain cautious while expecting further downside.
Thanks for your support.
- Make sure to follow me so you don't miss out on the next analysis!
- Drop a like and leave a comment!

Bitcoin (BTC): Buyers Are Accumulating | Breakout Incoming?Buyers have finally shown dominance near the 200EMA, where now we are heading for for the resistance zone, which will be tested.
As we are entering the friday with that kind of buyside volume we might be seeing strong pump during the weekends so that's what we are looking for now.
Swallow Academy
