23/06/25 Weekly OutlookLast weeks high: $108,948.76
Last weeks low: $103,569.91
Midpoint: $98,191.05
Last weeks chart is a clear reflection of what happens when there is a constant stream of bad news... Geo-political escalations, America becoming more involved in the Middle-east and the FED refusing to cut interest rates.
It's well known markets do not like uncertainty, and throughout the week more and more questions have been asked with very few answers. Risk-on assets have taken a hit generally and BTC is no different, especially over the weekend. This price action should be taken with a pinch of salt as the volume is never as high as it is during the week and often it paints a false picture of how the market really feels. The market makers ultimately are just, over the weekend they often aren't involved and so I think we will know more accurately how much of this geo-political escalation is priced in by the end of the trading day. How the SPX reacts will be important too.
The FED once again refused to cut interest rates, it's clear president Trump is not happy with this. The market could have done with a cut but that will have to wait.
So for Bitcoin it's been a tough week and I can't see this getting better immediately. Bearish price targets for me would be $97,000, the short term trend is clearly biased short until some solid support comes in or something drastic happens in the political world for good. This week is about survival and caution while looking for opportunities to present themselves without knife catching.
Good luck this week everybody!
USDTBTC trade ideas

BTC Bitcoin: Where I'm buying this war crash. Buy in strategyBTC Bitcoin: Where I'm buying this war crash. Buy in strategy
We're in a buy zone right now but I'm looking for bullish divergences for entry. I'll add more if we start getting higher highs.
If we lose this zone, then I'm looking again around the 90k area.
I think this is a wonderful opportunity to get BTC under 100k.

BTC black swan event is over, war fud ending, 220k-240k+ nextbuy spot , im betting more on Solana since i think SOL will outperform

Bitcoin Under PressureBitcoin remains mired in a bearish trend as price action struggles below key moving averages—the 50-day, 100-day, and 200-day—all of which point to sustained downside pressure. On the higher timeframes, a clear descending trendline from the April–May highs remains firmly intact, reinforcing the macro downtrend.
The Relative Strength Index (RSI) continues to hover in the neutral-to-lower zones, with recent bounces still failing to cross bullish thresholds. A short-term relief rally emerged post-news volatility, with price attempting to retest the supply zone between $103.9K and $104K—a region of confluence with bearish Fibonacci levels and previous order blocks.
However, rejection at this level could set the stage for a further breakdown, targeting the $96.3K–$95.5K range. In the 1-hour and 4-hour timeframes, Fibonacci retracements and a climbing RSI suggest short-term relief is plausible, but a lower high formation would confirm continued bearish control.
BTC remains technically vulnerable despite short-term bounces, while geopolitical events and U.S. policy narratives shape market sentiment. Yet behind the volatility, continued ETF inflows, stablecoin stability, and altcoin resilience signal a market that, while cautious, remains fundamentally engaged.
Traders and investors alike should stay focused on key resistance levels for BTC, monitor developments in Middle Eastern tensions and U.S. crypto policy, and watch ETF and stablecoin flows as barometers of broader market conviction.

Today's BTC trading strategy, I hope it will be helpful to youBitcoin Trading Strategy: Navigating $101,000 Volatility with a Three-Dimensional Model
Current Bitcoin prices oscillating near $101,000 reflect more than just technical support battles—they embody an expectation gap between policy implementation timelines and institutional fund flows. This strategy constructs a "Policy-Funds-Technology" three-dimensional analysis model, using the U.S. *Genius Act* House voting process and Hong Kong's *Stablecoin Ordinance* countdown as policy anchors, institutional behavior differences (e.g., MicroStrategy增持 vs. Grayscale fund flows) as funding validation, and key technical breakouts as entry signals for a dynamically adjusted trading system.
I. Policy Landscape: Dual Catalysts on the Horizon
- **U.S. *Genius Act* Legislative Progress**: The Senate passed the *Genius Act* with a 68:30 supermajority, and Trump has publicly pressed the House to expedite voting, with markets expecting final legislation by mid-late July. The bill requires stablecoin issuers to maintain 100% dollar/T-bill reserves, effectively integrating stablecoins into the "digital dollar" system. This is expected to attract ~$20 billion in institutional capital via compliant channels.
- **Hong Kong *Stablecoin Ordinance* Launch**: Scheduled to take effect on August 1, the ordinance has prompted institutions like Standard Chartered and JD.com to prepare license applications. The introduction of offshore RMB stablecoins will create new liquidity entry points for Bitcoin.
II. Funding Dynamics: Institutional Long-Term Conviction vs. Short-Term Positioning
- **MicroStrategy's Bold Accumulation**: The firm's holdings surpassed 330,000 BTC after a June 22 purchase, with an average cost of $88,627—current prices yield a 14% unrealized gain, demonstrating corporate investors' long-term confidence.
- **Grayscale GBTC Contrast**: $46.3 million flowed out of GBTC in the week ending June 20, reflecting institutional portfolio optimization ahead of policy milestones.
- **Tron USDT Liquidity Base**: With circulation exceeding $70 billion (50% of global USDT) and $80 billion daily transaction volume, Tron's stablecoin provides robust liquidity support for Bitcoin.
III. Technical Confirmation Mechanisms for $101,000
1. Short-Term Support Validation:
- Price forms a "Morning Star" candlestick pattern within $100,000-$101,000, accompanied by 20% higher trading volume than the prior day.
2. Trend Breakout Confirmation:
- RSI rebounds from below 40 to above 50, coinciding with a decisive price突破 (breakout) of the intraday resistance at $102,000.
**Trading Tactics**:
- **Aggressive Entry**: Long positions on confirmed Morning Star patterns, with stop-loss below $100,000 (2% below support).
- **Breakout Follow-through**: Add to positions above $102,000, targeting $105,000 resistance.
- **Risk Control**: Maintain position sizes below 15% of portfolio, with profit-taking triggers set at 3%–5% intervals.
This framework balances policy-driven structural shifts with tactical technical signals, enabling traders to navigate the volatility gap between institutional long-termism and short-term market noise.
Today's BTC trading strategy, I hope it will be helpful to you
BTCUSDT BUY@101000~102000
SL:98000
TP:103000~104000

We PREDICTED correction, and here is the NEXT step⚡️ Hello, everyone! As I said in my previous ideas, the correction is just beginning. Some people link this to the hostilities in the Middle East.
But, in reality, this is just a way to find a reason. In fact, the charts have long predicted a correction, which I have been actively talking about for the last month.
📊 Let's take a look at what lies ahead:
Having gathered liquidity below 100k, we are now seeing a short-term rebound. For me, the maximum target for this rebound is 106,000-107,000.
We have started to close the GAP at levels of 102,760 - 97,400. I expect it to close completely, after which we can move into a range. The next GAP is at levels of 93,280 - 85,230. So the further direction of movement is also obvious. After all, in 99% of cases, gaps close sooner or later.
⚙️ Metrics and indicators:
Money Flow - liquidity has been declining for more than half a year. This updated ATH was accompanied by a significantly smaller inflow of capital and formed a divergence. This means that there is still no new liquidity in Bitcoin, and for it to move higher, a new catalyst and cheaper prices are needed.
Liquidity Depth - as we know, the price tends to move from one liquidity zone to another. And now, there is significantly more liquidity at the bottom than at the top.
Dynamic Support/Resistance - Currently, 99,890 is a strong support level. However, each time we move lower below it. So I am confident that this level will be broken in the near future. The next major support level is 91,460.
Volume - is another indicator of the lack of new liquidity in Bitcoin. Since November 2024, purchase volumes have continued to decline!
📌 Conclusion:
I don't expect us to see Bitcoin at 60,000 before the fall. But 80,000 by September is quite possible. The fact that we will probably test the 90,000 level is not even up for discussion. Unless, of course, a new bullish catalyst appears. Altcoin ETFs are not even close to being one.
So, for now, I advise everyone to be patient and not try to predict the bottom. Prepare your bags for spot purchases, sit back in your chair, and enjoy the show!
🔥 Have a great week, everyone! 🔥

$BTC - Short-term OutlookCRYPTOCAP:BTC | 4h
We got a solid bounce off 98k
Next key level is 103.5k–104k. A clean reclaim flips short-term bias bullish.
If price gets rejected again, this likely confirms a bearish retest, and likely leading back down to the 94k–92k value area
Price could range for awhile at this level as we challenge the 104k — prior value acting as resistance.

Checking the trend change after the volatility period
Hello, traders.
If you "Follow", you can always get the latest information quickly.
Have a nice day today.
-------------------------------------
(BTCUSDT 1D chart)
This volatility period is expected to last from June 21st to 23rd.
Therefore, it is necessary to check the trend formed after the volatility period.
The 99705.62 point is the HA-High indicator point of the 1W chart, so it is important to see if there is support near this point.
If it falls without support, it may fall to around 89294.25.
The 89294.25 point is the HA-Low indicator point of the 1D chart.
Since the M-Signal indicator of the 1W chart is rising to around 99705.62, the area around 99705.62 is likely to play an important role as support and resistance.
Even if it turns upward, it must rise above the HA-High indicator point of 108316.90 of the 1D chart to maintain the price.
If not, it is likely to fall again.
-
The fact that the HA-High indicator was created means that it fell from the high point range.
In other words, if it falls below the HA-HIgh indicator point, it is likely to start a downtrend.
However, since the HA-High indicator is an intermediate value, if it is supported near the HA-High indicator, it is possible to show a stepwise upward trend.
The end point of the high point is the DOM (60) indicator.
Therefore, it should be interpreted that it has risen above the high point section only if it rises above the 111696.21 point.
Therefore, depending on how the 108316.90-111696.21 section is broken upward, an upward trend can be predicted.
----------------------------------------------------------------------
There are auxiliary indicators OBV indicators made of Low Line ~ High Line channels and PVT-MACD oscillator indicators.
The OBV indicator made of Low Line ~ High Line channels is an indicator that can see how the channel is structured, and whether OBV falls below the Low Line of the channel or rises above the High Line.
Therefore, you can predict the future trend based on the channel pattern.
-
The PVT-MACD oscillator indicator is an indicator created by adding the Close value dash PVT value to the MACD formula.
Therefore, it shows a similar appearance to the MACD oscillator indicator.
The reason for looking at the PVT-MACD oscillator indicator is to find out how the trading volume flows.
There are many trading volume indicators, but I think this PVT-MACD oscillator indicator reflects the trading volume flow well.
-
However, you should look at the support and resistance points where the changes in the movement of the PVT-MACD oscillator indicator, the OBV indicator created by the Low Line ~ High Line channel, and the StochRSI indicator occur.
If the changes in these indicators occur near the DOM(-60), HA-Low, HA-High, and DOM(60) indicator points, it can be of great help in creating a trading strategy.
The DOM(-60) indicator indicates the end point of the low point.
That is, falling below the DOM(-60) indicator means that it has entered the low point range, and there is a high possibility that it will show a full-scale downtrend.
The fact that the HA-Low indicator was created means that it has left the low point range.
That is, if it rises above the HA-Low indicator, it means that there is a high possibility that an uptrend will begin.
However, since the HA-Low indicator is an intermediate value, if it encounters resistance and falls, it is possible that it will show a stepwise downtrend.
Therefore, whether there is support in the DOM(-60) ~ HA-Low range is important.
-
Currently, the OBV indicator created as the Low Line ~ High Line channel has fallen below the Low Line.
Therefore, we need to look at whether the Low Line ~ High Line channel will change to a downtrend channel in the future.
We need to look at whether an 'M'-shaped pattern indicating a trend change occurs.
Since the PVT-MACD oscillator indicator is still below the 0 point, it can be seen that the selling force is dominant.
However, since the oscillator is maintaining an upward trend, you can see that the overall selling pressure is decreasing.
Even so, since it is located near the HA-High indicator, the resistance in the HA-High ~ DOM(60) section is expected to be considerable.
-
Support and resistance points should be drawn on the 1M, 1W, and 1D charts.
This will increase accuracy.
However, since the standard time frame chart for all indicators is a 1D chart, it is most important to check the flow of the 1D chart.
-
You may think it is difficult because you have to look at multiple indicators at once.
The most important thing is to look at the movement when approaching the HA-Low or HA-High indicator.
The reason is that the basic trading strategy is to buy near the HA-Low indicator and sell near the HA-High indicator.
-
Thank you for reading to the end.
I hope you have a successful transaction.
--------------------------------------------------
- Here is a description of the big picture.
(3-year bull market, 1-year bear market pattern)
I will explain more details when the bear market starts.
------------------------------------------------------

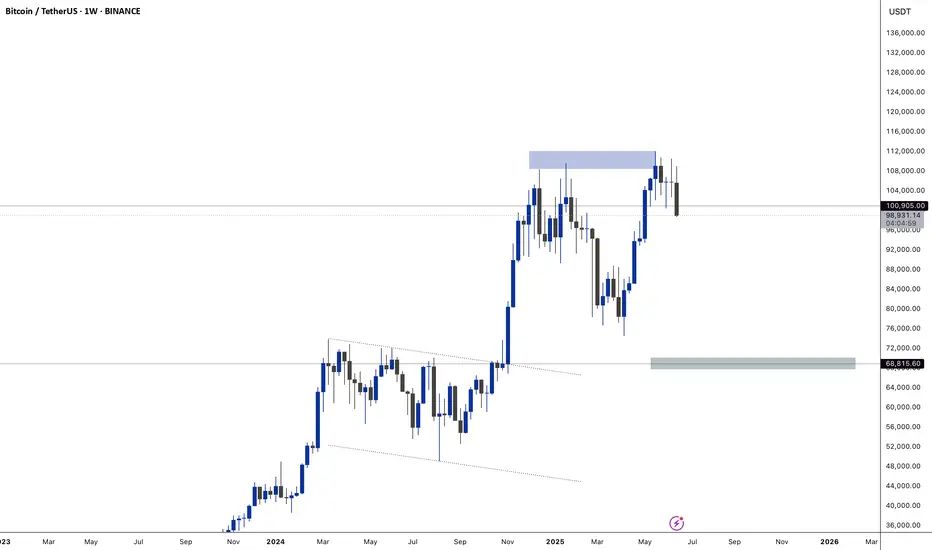
Bitcoin Weekly, Not Good But... Opportunities AboundI cannot say about the weekly timeframe the same I said for the daily, the situation here is different. The chart looks bad. The weekly close changes nothing.
If Bitcoin moves and closes weekly above $106,000, this can be good news, but any trading below this level has bearish potential. It can be a period of bullish consolidation but the bearish potential cannot be ignored. So, I will keep it short. Bitcoin remains in doubt on the weekly timeframe.
Bullish above $100,000. Bearish below $100,000.
It has been six weeks with Bitcoin moving with basically no change.
Last week's action did produce some loses for some traders, but for us the market remains the same. We focus on the altcoins, ignore Bitcoin for now, there is no growth and the action is still happening near resistance; at short-term support but overall, closer to a top than a bottom. It is risky to say the least. Many altcoins are trading at bottom prices and growing strong. We go for the low risk vs high potential for reward chart setups. We don't mind the market shaking, evolving or reacting to some geopolitical event, we do care about making the right choices... Focus on the altcoins for now, and for long...
Hold on. I shall give you more information.
Bearish action is indeed present but still weak.
Bearish volume is very low.
The fact that more than 1B worth of leveraged positions were liquidated calls for a pause. Each and every time this amount of money is taken out of peoples hands and transferred to the exchanges, the market changes direction. Regardless of the signals, the bigger picture or the long-term. This is a huge transfer, the whales are getting richer, retail is getting rekt.
So, the market is likely to shake some more. This is only because Bitcoin is trading way too high and hasn't produced any significant retrace after considerable growth. Again, we buy those trading low near support. We sell those trading high near resistance. As long as this is the MO, we are sure to win in the long-run.
I wouldn't want to buy-long a project that is crashing when there are others growing, yet to grow and with huge potential for growth.
Remember, the market is big now, Bitcoin is very strong above 100K. It can happen that Bitcoin goes on a retrace while the altcoins move ahead. Money flowing out of the big projects reaches the smaller projects, classic bull market dynamic. Nothing surprising; opportunities are endless.
Thanks a lot for your continued support.
Namaste.

Bitcoin Daily Bearish: If 100K Breaks, 80KBitcoin being bearish is only true if the $100,000 support level breaks. If it breaks expect the market to dive down, deep and fast and reach around $82,500 or $88,888. But this is only if the support breaks. If support holds, as it is doing so far, then you can expect higher prices in the coming weeks. If support breaks, the flush is likely to be super fast and strong which means that you will still get higher prices in the coming weeks, so the conditions remain the same mid- to long-term, only the short-term is now in question. The bears are putting pressure on the market and many LONGs have been liquidated already.
It will be nice to see how it all develops, but it shouldn't take more than two weeks. We are likely in the clear in a matter of days (2-3 days). Do not be afraid if the market shakes, Bitcoin is going up; Crypto will grow, regardless of the short-term.
Namaste.

Your Edge Isn’t Just Technical, It’s PersonalMost traders obsess over their strategy: Which indicator? What session? What entry signal?
But very few stop to ask the question that could change everything: “Does this style actually fit who I am?”
The Truth Most Don’t Talk About
Trading success is not about copying someone else’s edge. It’s about discovering your own edge, and that begins with self-awareness .
And it hit deep because this is the part of trading psychology we often skip.
Some Real Talk
If you’re naturally calm and risk-averse, trying to scalp news spikes will drain you.
If you’re fast-thinking, decisive, and love volatility, swing trading might feel like watching paint dry.
If you thrive on rules and structure, discretionary trading might feel chaotic.
If you're intuitive and adaptive, being forced into mechanical rules may kill your edge.
You’re not underperforming because you lack discipline, you’re likely just misaligned.
What Changed for Me
I stopped trying to “be the trader” everyone said I should be. And I started trading like me.
I built a system that fits my mental rhythm.
I gave myself permission to simplify.
I became consistent not because of a new setup, but because I removed internal friction.
Final Thought:
Your best trades don’t just come from the chart. They come from a place of alignment, when your mindset, risk tolerance, and system flow together. So before chasing another strategy, ask yourself: “Is my trading style in tune with my personality?”

BTCTHE BTC 99k is a strong demand floor as shared across all platform weeks ago, my ema+sma strategy is giving me another lower buy floor on the daily ascending trendline in the zone of 94k.
that zone will be watched as it will represent a break of a strong demand floor 100k floor .

BTC Accumulation modelI would love to see some more ranging, followed by another deviation into this 4h demand to then turn this range into a model 1 accumulation. I would expect the overall range low to hold a little bit longer, since it's a confirmed daily cycle low. I will update this idea if it looks like it could play out.

The end of Triangle?If yes, trend is over.
But, not sure where is the end of triangle.
06/17 or 06/20?
We should check this through analyzing afterward movements.
Low probability that it was not triangle.
If it wasn't, big ending diagonal will be made.
It means there will be more dip but high potential to make new ath(historical top/reversal point).
Let's check trend line/channel of these posts.
Checking retest is the key.
Still, short position has attractive price points.

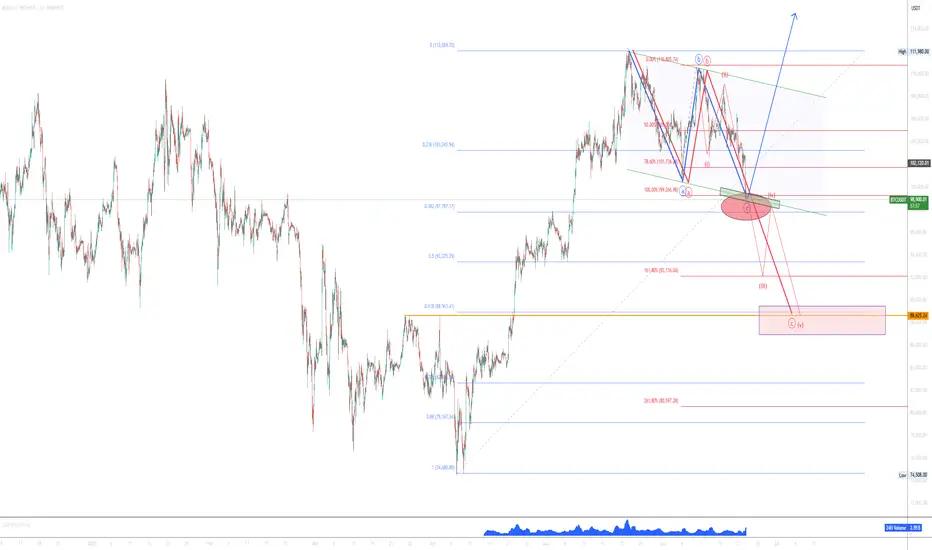
Red or Blue?Hi there!
Price is at crucial level, and we have two high probability scenarios.
We have parallel channel and Fibonacci extension 100% now and Clear Blue ABC. Some rejection can happen from here to the upside or this is it and trend continuation can start!
Red scenario is deeper ABC to the cluster level of previous HH and Fibonacci 61.8 level little under Fibonnaci extension 161.8!
Good luck traders
Perspective -- all basic indicators point DOWNI feel it's easy to get lost in what is happening NOW and forget what has happened OVERALL.
Zooming out to a weekly chart and using basic trading indicators, we can see where this is going.
Trading Volume: Low
Double Top: Confirmed
Elliot Pattern: Concluded
SMA50 & SMA100: Same setup as Dec 2021
Stochastic RSI: Turning bearish
First target: 92 - 93k range
Second target: 77 - 78k range
Third target: 33 - 34k range
I suspect a slight uptick at 93k, but not surprised if it breezes past this onto 78k.
Strange that anyone views this as a bulllish movement. This is a clear signal of a bearish market, and if altcoins follow then it'll be a full on crypto winter.

Bitcoin Short-Term Recovery Confirmed Bulls Win!Ranging markets/sideways markets is when traders lose the most money. Always keep this in mind.
» Short-term signals are pointing to a recovery right away.
» Bitcoin's drop wicked below the 13-June low but the RSI produced a higher low and thus we have a bullish divergence.
» Bitcoin's current drop went lower yet the chart reveals lower volume now compared to 13-June. This reveals weakness on the bear camp. This means a recovery will happen next, right away.
These are just a few signals but taken together with the altcoins analysis that I showed you and the bigger picture; Ha ha! The bulls win again.
Namaste.

#BTCUSDT: Major Bearish Correction?Bitcoin is currently undergoing a correction following its recent peak. While the initial price decline appeared insignificant, it has since experienced a substantial drop, suggesting a substantial volume of selling activity in the market.
We anticipate two potential areas where the price could reverse and resume its upward trajectory. These areas could lead to a price of 110,000, followed by 120,000, and ultimately reaching 150,000.
We strongly recommend that you implement rigorous risk management measures and conduct your own analysis before making any investment decisions.
Best regards,
Team Setupsfx_

Dollar's Decline: Global Economic ShiftsYou're probably wondering why I'm talking about the dollar on the Bitcoin chart. It's because I want you to look a few steps ahead.
That's why this post is for people like that.
1. Global Economic Transformations: Collapse of the Jamaican Monetary System
Insights and Logic:
We are witnessing the end of the Jamaican monetary system, established in 1976 following the collapse of the Bretton Woods system.
The Jamaican system's key feature is free (yet conditionally market-driven) exchange rates and the global dominance of the U.S. dollar.
For decades, the U.S. utilized the dollar's reserve currency status to finance budget and trade deficits without equivalent value returns—a beneficial "global tax."
Facts:
Currently, over 60% of global reserves are denominated in dollars (IMF data), but diversification is accelerating.
The U.S. is facing a "liquidity trap": to sustain markets, the Fed must print money, exacerbating inflation and weakening the dollar's global effectiveness.
Analogy:
Just as Nixon abolished the gold standard in 1971, we are now witnessing the abolition of the dollar's global standard—not abandoning the dollar as a reserve currency, but its monopoly.
2. Political Environment in the U.S.: Trump, Tariffs, and Managed Uncertainty
Insights:
Court decisions against Trump's tariffs are political tools, especially prior to congressional elections.
Democrats aren't just fighting for power—they systematically undermine Trump's economic policies in voters' eyes.
Systematic Explanation:
Virtually any presidential decree in the U.S. can be challenged legally. Lower-court decisions rarely withstand appeals, yet they create temporary buffers allowing policy adjustments.
This enables Trump to recalibrate his trade model systematically without losing face.
Conclusion:
The U.S. operates under "managed uncertainty," where seemingly chaotic political behaviors are structured adaptation mechanisms to global changes.
3. Mass Market and Sixth Technological Paradigm: NBIC as Foundation for Future Growth
Insights:
The future mass market will be built around NBIC technologies:
* Nano—new materials and sensors;
* Bio—biotech, genetic engineering, life extension;
* Info—digital platforms, neural networks, blockchain;
* Cogno—cognitive interfaces, AI, neural interfaces.
Historical Analogy:
Just as cars and mobile phones defined the mass market of the 20th century, longevity treatments, AI services, and neural devices will define the 21st century.
Facts:
Examples of current "false starts": Nvidia, Palantir, OpenAI—stock price volatility relates not to technology failures but premature valuation.
Forecast:
The next 20 years will see growth in new sectors, dominated by those capturing mass consumers, not just investors.
4. Digitalization and Geo-economics: Telegram, AI, and Control
Facts:
Telegram plans to integrate Grok neural network—a signal of the digital merger of communication, payment platforms, and behavioral analytics.
Insight:
Telegram as a future super-app: messaging, finance, AI assistance—all-in-one.
This is a media reset: traditional platforms like Bloomberg and CNBC lose influence to those controlling data flows directly.
Conclusion:
Information landscapes become automated—algorithms, not journalists, manage narratives.
5. **Europe: From "Progress Locomotive" to Stagnation and Subcontracting**
Facts:
Germany has been in recession for three consecutive years. The average age is 46.
Pension burdens and social standards make the economic model (Rhineland capitalism) unsustainable.
Ideological Crisis:
Europe is split into "transhumanist" (West) and "neoconservative" (East) factions.
The neoconservative revolution is gaining ground in Hungary, Poland, Slovakia, Romania, and even eastern Germany.
Conclusion:
Europe is skipping the sixth technological paradigm, becoming a "comfortable but uncompetitive" zone. Europe's "Japanification"—a path without acute crises but also without growth.
6. Future Growth Centers: Asia and the Global South with Risks
Facts and Locations:
Indonesia, Vietnam, Thailand—dynamic economies with high ROI and moderate political risks.
Philippines, Taiwan—potential proxy-conflict zones between the U.S. and China.
Logic:
Global capital moves towards higher returns rather than better living standards.
Asia becomes a new economic and geopolitical battleground similar to 20th-century Europe.
7. Role of Cryptocurrencies and USDT, USDC: Transition to Digital Dollar
Facts:
U.S. authorities view cryptocurrencies, especially USDT, as tools to reboot the dollar model.
USDT effectively integrates the dollar into the crypto economy, maintaining Treasury demand and allowing dollar exports outside the U.S.
Insights:
Unlike CBDCs, the U.S. digital dollar (via stablecoins) enables global expansion rather than local control.
The U.S. aims to lead the new monetary evolution—digital dominance instead of fiat.
8. Prospects in Latin America: Argentina, Mexico, and Risks
Argentina Analysis:
President Milei implements neoliberal reforms akin to Ukraine's: reduced state role and deregulation.
Possible outcomes: deindustrialization, increased poverty, export dependency.
Positives:
No war risks, resource-rich (oil, wine, food), good medicine and education standards (legacy).
Mexico:
High growth yet severe crime levels—excellent for business, risky for life.
9. Global Hybrid War Instead of a Third World War
Concept:
Not a "world war" but a global hybrid war: multiple power centers, proxy conflicts, shifting alliances.
Theaters of conflict: Asia (especially the South China Sea), potentially the Middle East and Africa.
Strategic Conclusion:
Avoid proxy countries; prefer "neutral dynamic" regions like Indonesia, Vietnam.
About DXY
I have been talking about the fall of the dollar index for a very long time.
September is coming soon
Best regards EXCAVO

Bitcoin Still Bullish Above $93K — Don’t Trade with Emotion🟢 Bitcoin Still Bullish Above $93K — Don’t Trade with Emotion
I still believe Bitcoin is in a bullish trend as long as it holds above $93,000. The recent drop seems mostly driven by external factors and geopolitical uncertainty. If Iran responds to the U.S. or closes the Strait of Hormuz, there’s a strong chance this short-term downtrend could continue.
But here’s the key: don’t trade emotionally. If you’ve bought spot positions and your stop-loss was hit, it’s okay to exit. You can always re-enter later when conditions improve. The most important part is to trust your analysis and the stop you originally set.
As for futures, I’m personally not trading right now — the market is too reactive to headlines. However, I’ve noticed BTC outflows from exchanges have increased, which is often a bullish long-term sign. This means the price can recover just as fast once fear subsides.
📉 In uncertain times, patience is a strategy too — sometimes watching is better than chasing trades.
---
💬 What’s your take on Bitcoin during this geopolitical mess? Let me know in the comments — I’d love to hear your thoughts. 👇

BTC outlook Just as analysed , Bitcoin delivered nicely , and still delivering, now we expect to see a full drop to 74k

USA bombs IRAN - Bitcoin Falling!Operation Midnight Hammer was a major U.S. military strike carried out on June 21, 2025, targeting three of Iran’s key nuclear facilities: Fordow, Natanz, and Isfahan.
The operation involved seven B-2 Spirit bombers, each flying an 18-hour mission from Missouri, supported by over 125 aircraft, including refueling planes, fighter escorts, and surveillance assets.
To maintain the element of surprise, the U.S. used deception tactics, such as sending decoy aircraft westward over the Pacific while the actual strike force flew east toward Iran with minimal communications.
The bombers dropped Massive Ordnance Penetrators (MOPs)—30,000-pound bunker-busting bombs—on the fortified nuclear sites. Cruise missiles launched from a U.S. submarine struck additional infrastructure targets.
The Pentagon described the mission as the largest B-2 operational strike in U.S. history and the first known combat use of the MOP. Officials emphasized that the operation was aimed solely at nuclear infrastructure and not at Iranian civilians or military personnel
