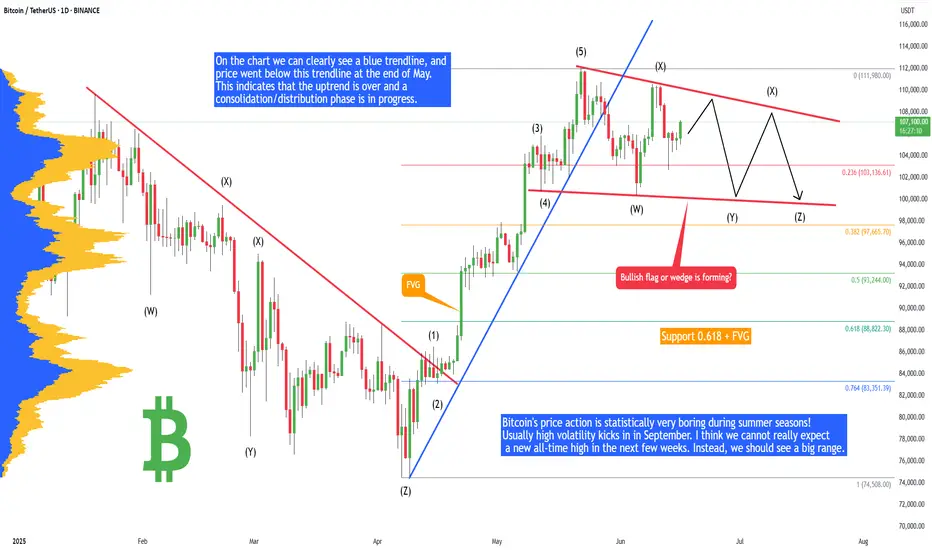
Bitcoin - Plan for summer 2025 (no new ATH, big range!)Bitcoin's price action is statistically very boring during summer seasons! Usually high volatility kicks in in September. I think we cannot really expect a new all-time high in the next few weeks. Instead, we should see a big range. Why? Let's take a look at technical analysis.
On the chart we can clearly see a blue trendline, and price went below this trendline at the end of May. This indicates that the uptrend is over and a consolidation/distribution phase is in progress. This phase is usually represented as a bull flag, triangle, rectangle, or wedge. When we look at the current price action, it looks like a bullish flag consolidation pattern. In this case we will probably see multiple liquidity sweeps below the previous swing lows to kick out early longs.
There are 2 types of traders. The first one they love to trade ranges, and the second they love to trade breakouts and higher volatility environments. Currently I think Bitcoin is creating a range, so do not expect any crazy movements until this range is valid.
Bullish flags are usually bullish patterns, but often they break down and act like bearish patterns. So what would happen if this bullish flag breaks down? That would send the price of Bitcoin to the 0.618 FIB, which is at 88,882 USDT. What is this bullish flag breaks out? That would send the price of Bitcoin to 116,000 to 125,000, but to establish this price we first need to see low of the bull flag, which is not confirmed yet. I will definitely inform you in one of my next analyses, so write a comment with your altcoin + hit the like button, and I will make an analysis for you in response.
At the end of each post, I share my professional trading tips: "If you realize you’ve made a poor trading decision, exit before the stop loss forces you out." Trading is not hard if you have a good coach! This is not a trade setup, as there is no stop-loss or profit target. I share my trades privately. Thank you, and I wish you successful trades!
USDTBTC trade ideas
BTC POC, Golden Pocket, S1, FVG confluence @ 105kBTC POC, Golden Pocket, S1, FVG confluence @105k
Nice confluence here for a bounce. I would take profit quickly though with bearish momentum still strong.

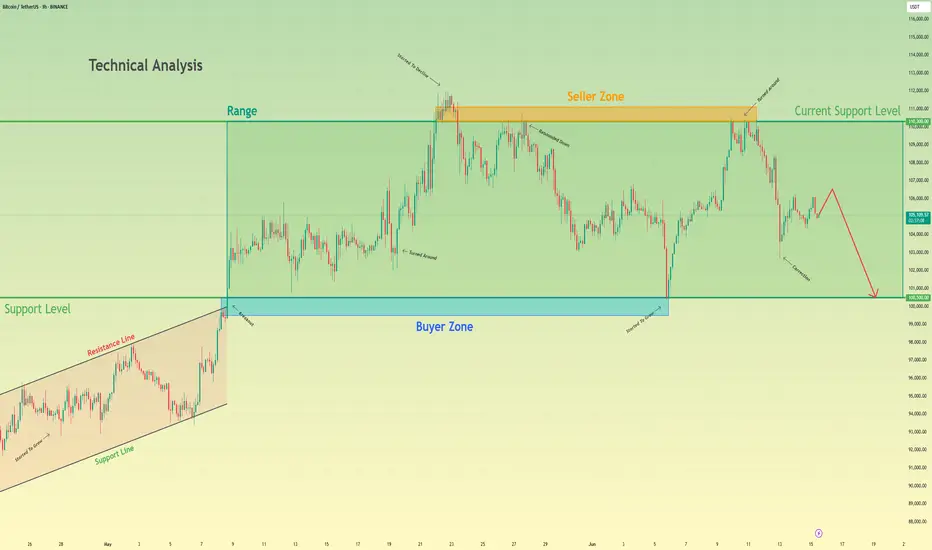
Bitcoin will make a small upward move and then continue to fallHello traders, I want share with you my opinion about Bitcoin. Earlier, the price was confidently growing inside an Upward Wedge, showing a series of higher highs and higher lows. This rising structure was supported by consistent momentum until BTC reached the seller zone between 110300 and 111100, where the growth slowed down and started to fade. From there, the price rejected this resistance and shifted into a Range, bounded by 100500 and 110300. BTC has been fluctuating inside this horizontal structure for some time, unable to break above the seller zone or below the buyer support. Now BTC is showing signs of weakness, forming a minor correction and struggling to reclaim previous highs. Given this structure and rejection from the seller zone, I expect BTC to make a small upward move and then start a decline toward the support level at 100500, which also coincides with the bottom of the range and acts as a strong psychological level. For this reason, I set my TP at 100500 points. Please share this idea with your friends and click Boost 🚀
BTC - AnalysisWe’re currently back at the short-term trend reversal zone,
which has been reactivated after price moved 3% away from it.
The zone itself spans 1.6%, so a new reaction from this level is likely.
If the bottom at $102,500 holds,
we’ve activated a valid bullish structure that could take us up to the $119,000 target zone —
which also overlaps with a weekly target region.
We’ll see what the next few days bring...
Key events to watch right now:
1️⃣ Israel & Iran – Will the conflict escalate or calm down?
2️⃣ Tomorrow’s FOMC meeting – Will QT be addressed?
Feel free to drop any questions or feedback —
I’ll read and respond to everything.
LFG 🚀

BTC Bias Map: 17/06/25Daily Bias Map:
- Bitcoin lost key support at 106,500
- I am leaning more bearish now that this key support is lost.
- Market is heavily driven by news and uncertainty.
- Key levels like Monday low and monthly low cluster in the same region — likely last bastions of support.
- Expecting a possible larger shakeout toward weak lows nearby, which don’t look appealing for entries.
- Will watch for potential long scalp triggers around monthly open or Monday low but will likely stay side-lined. Unless I see a potential good short setup form.
- With FOMC news tomorrow I’m avoiding heavy involvement the risk is not worth it in this volatile environment.
Discipline means knowing when to step back. In all likelihood I'll let the market develop today unless a extremely clean trade develops.

HolderStat┆BTCUSD forming a triangleBINANCE:BTCUSDT is bouncing from the 104 k pennant foot on trend support, turning squeeze into bullish advance. Holding the rising line preserves upside bias; clearing 111 k unlocks 121 k and ATH chase 🏆

BTC Dips After ATH – $100K Support in Focus Amid TensionsBy analyzing the #Bitcoin chart on the weekly timeframe, we can see that after rallying to $111,980 and printing a new all-time high, price faced a correction down to $100,000.
Currently, Bitcoin is trading around $105,700, and with geopolitical tensions escalating, particularly the risk of war, we could see further downside — potentially taking price as low as $90,000.
However, if BTC manages to hold above the $100,000 level, there’s a strong chance we’ll see a short-term rally toward $120,000.
This analysis will be updated as the situation evolves. Stay tuned!
Please support me with your likes and comments to motivate me to share more analysis with you and share your opinion about the possible trend of this chart with me !
Best Regards , Arman Shaban

BTC bullish rally before the fall?I am expecting a bullish Rally to the previous high since it's a third wave of current impulse I'm expecting BUY from here to the target mentioned. Will be exciting if any reversal signs occur. (BTC should touch 140,000+ in 2 months.)
entering buy from 107400
*A fall still pending* BITSTAMP:BTCUSD

Bitcoin Retests Broken Channel | Bounce to $110k?Bitcoin is currently retesting the broken downward channel. This selloff was a market shock reaction due to Israel's airstrikes on Iran. Price found support around $103k, at the daily timeframe 50SMA. The daily 50SMA also served as support in the previous drop to $100k last week.
In the chart's red circle is likely where many long leveraged positions had their stop losses or liquidation levels. We can safely assume this event was a liquidity hunt as Bitcoin remains strong above $100k. A healthy pullback to retest.
Historically, we have seen similar market shock selloffs like this. One example is the 1st of October 2024 Iran strikes on Israel. Bitcoin crashed 5% from $63k to $60k. What followed after was a recovery to over $100k, never seeing $60k again.
Will Bitcoin recover?
We still have multiple bullish developments. Institutions are becoming increasingly interested in Bitcoin, the US Bitcoin reserve, SEC x Ripple case settlement, SOL ETF approval, Fed rate cuts, among others.
Provided that the conflict does not escalate, once the market panic reaction is over, we can expect a healthy bullish continuation, as long as Bitcoin remains above $100k.
We also have a massive pool of short liquidity above $111k. Once we break above this level it will be a short-squeeze to $120k.

I had a nightmare this morning.Recently, I published my analysis about BTC and found that BTC is following a rising channel and is being supported by fib retracement.
But unfortunately, BTC hasn't shown any remarkable movement so far, and came back again the the support area.
I feel this is not a good sign for BTC.
ON a weekly view, It May repeat its previous movement.
I am publishing my reservation about BTC, be careful about BTC.

$BTC 4hr - The Calm Before Bitcoin’s Next Move💡 In bull markets, triangles break UP more often than down.
But volume + macro + ETF flows > patterns.
Set alerts, manage risk, stay nimble.
#BTC #CryptoAlpha #RiskManagement
🎯 Key Levels Analysis:
✅ Resistance: 106.3K
→ This level matches the upper bound of the symmetrical triangle and is reinforced by multiple recent rejections. Also aligns with previous highs.
✅ Support: 103.7K
→ Mid-range horizontal support. Price reacted here multiple times. It's also near the triangle base.
✅ Support: 99.6K
→ Clean psychological + technical level. A previous consolidation zone. Would likely trigger a strong reaction.
✅ Last Line of Bull Defense: 95.2K
→ Major horizontal support from the April/May breakout structure. Losing this would likely invalidate the bullish structure.

Excellent Trade yesterday! Today's PlayHere are the scalp plays I am watching today. A few continuation plays in to demand and a reaction off supply. Lets see what the NY brings.

$BTCUSD Predictions support line
Bitcoin traders, get ready for an epic ride! This chart shows BTC still has to hit the price target from the Cup & Handle breakout, pushing it toward a major channel resistance! Once it peaks, a bear market could kick in, driving prices down to the support line. Buckle up for the volatility ahead!

BTC accumulates above 104,300 zonePlan BTC today: 17 June 2025
Related Information:!!!
Bitcoin (BTC) price falls to around $106,000 at the time of writing on Tuesday following a mild recovery the previous day. The decline comes as investors continue to digest the escalation of the Iran-Israel conflict and after US President Donald Trump highlighted concerns and asked his security advisors to meet in the Situation Room. While institutional interest in Bitcoin remains robust, any further escalation in the Middle East could impact global risk assets.
The US steps in to resolve the Iran-Israel war
Bitcoin price action remained broadly resilient on Monday despite escalating tensions in the Middle East. The four-day-old war between Israel and Iran, which began on Friday, has so far failed to trigger a sharp correction. The largest cryptocurrency by market capitalization held above its key psychological threshold of 100,000 despite the initial shock — a contrast to April last year, when BTC fell more than 8% amid similar Iran-Israel turmoil.
The New York Times reported on Monday that US President Donald Trump has encouraged Vice President JD Vance and his Middle East envoy, Steve Witkoff, to offer to meet with the Iranians this week.
personal opinion:!!!
Gold price continues sideways and accumulates in 2 trend lines, support 104,300
Important price zone to consider :!!!
support zone : 104.300 - 104.100
Sustainable trading to beat the market

What is Dollar Cost Averaging (DCA)?🔵 What is Dollar Cost Averaging (DCA)?
Dollar Cost Averaging (DCA) is a timeless investment strategy that involves investing a fixed amount of money at regular intervals, regardless of the asset's price. It’s one of the most effective ways to build a position over time while minimizing the impact of market volatility.
The term "Dollar Cost Averaging" was popularized in the early 20th century by Benjamin Graham — the father of value investing and mentor to Warren Buffett. Graham advocated DCA as a way to remove emotions and guesswork from investing. By spreading out purchases, investors could avoid mistiming the market and reduce risk exposure.
Today, DCA remains a core strategy for retail investors, especially in volatile markets like cryptocurrencies and growth stocks.
🔵 How Does DCA Work?
The concept is simple: instead of investing a lump sum all at once, you break your total investment into smaller, equal parts and invest them over time — for example, weekly or monthly.
Invest $100 every week into Bitcoin.
Keep buying consistently — regardless of whether price goes up or down.
Over time, this smooths out your average entry price.
You buy more when price is low, and less when price is high.
Example:
If BTC is at $30,000 one month, you buy a small amount.
If BTC drops to $25,000 the next month, you buy more units with the same $100.
Over time, your entry price averages out — reducing the risk of buying at a peak.
🔵 Why Use DCA?
DCA offers both psychological and mathematical advantages:
Reduces timing risk: You don’t need to predict market tops or bottoms.
Builds discipline: Encourages consistent investing habits.
Prevents emotional mistakes: Avoids FOMO buying and panic selling.
Smooths volatility: Especially useful in crypto or fast-moving assets.
🔵 Smart DCA: Buying Into Market Bottoms
While classic DCA is powerful on its own, it becomes even more effective when combined with market structure. A popular approach is to only DCA when the asset is trading below its long-term average — such as the 200-day Simple Moving Average (SMA) or using RSI (Relative Strength Index).
What is the 200-day SMA?
It’s the average closing price over the last 200 days — a key indicator of long-term trend direction.
Why DCA Below the 200 SMA?
Historically, many market bottoms occur below the 200 SMA. Using this as a filter helps you avoid accumulating during overvalued or overheated conditions.
SDCA with RSI
The Relative Strength Index (RSI) helps identify momentum exhaustion. When RSI drops below 30, it often marks deeply oversold conditions — especially on the daily chart for BTC.
How to use it:
Only DCA when price is below the 200-day SMA.
You accumulate during crashes, fear, and corrections.
Avoid buying when price is extended far above long-term value.
🔵 Scaling DCA Based on Undervaluation
To further optimize the strategy, you can scale your DCA amounts depending on how far below the 200 SMA the price is.
Example:
Price is 5% below 200 SMA → invest normal amount.
Price is 15% below → double your investment.
Price is 25% below → triple your investment.
This creates a dynamic DCA system that responds to market conditions — helping you build larger positions when prices are truly discounted.
🔵 When DCA Doesn’t Work
Like any strategy, DCA has limitations. It’s not magic — just a system to reduce timing errors.
In strong uptrends, a lump sum investment can outperform DCA.
In declining assets with no recovery (bad fundamentals), DCA becomes risky.
DCA works best on quality assets with long-term growth potential.
Always combine DCA with research and risk management — don’t blindly accumulate assets just because they’re down.
🔵 Final Thoughts
Dollar Cost Averaging isn’t about buying the exact bottom — it’s about consistency , discipline , and risk control . Whether you’re investing in Bitcoin, stocks, or ETFs, DCA offers a stress-free approach to enter the market and smooth out volatility over time.
Smart traders take it one step further: using moving averages and structure to focus their DCA efforts where value is highest.
DCA won’t make you rich overnight — but it will help you sleep at night.
This article is for educational purposes only and is not financial advice. Always do your own research and invest responsibly.

Bitcoin Multiframe: Key clusters to watch before FOMC__________________________________________________________________________________
Technical Overview – Summary Points
__________________________________________________________________________________
Momentum: Dominant bullish structure across all major timeframes (MTFTI = Up).
Supports/Resistances: No HTF pivot engaged; key on-chain support at $97.6k, resistance at $115.4k.
Volume: Central oscillation within range; no major surges observed, consolidation on micro-TF.
Multi-timeframe behaviors: Bullish structure dominates, technical pullback on 4H-1H-15min without major breaks.
__________________________________________________________________________________
Strategic Summary
__________________________________________________________________________________
Overall Bias: Structurally bullish as long as key supports hold (97.6k–104.5k zone).
Opportunities: Buy confirmed dips on on-chain cluster/H4-H2 area, target 110–115k extension post-FOMC positive catalyst.
Risk zones: Extreme volatility expected around FOMC (June 17–18); strict risk management, avoid overexposure.
Macro catalysts: FOMC (rate decision, dot plot), Fed leadership stability, Israel-Iran geopolitical tensions.
Action plan: Patience until FOMC; favor setups on clear price reaction, tight stops below 97.5k (on-chain support).
__________________________________________________________________________________
Multi-Timeframe Analysis
__________________________________________________________________________________
1D: Bullish momentum, price at range center ($106k). Watch for pivot break.
12H: Persistent bullish bias, confluence with 1D.
6H: Expected consolidation, bullish structure.
4H: Technical pullback, bullish structure remains. Key anticipated support 105k–104.5k.
2H: Likely move towards lower range. Up bias confirmed.
1H: Technical correction within overall Up trend.
30min/15min: Seller sequence, trend intact, no major break.
Risk On / Risk Off Indicator remains “Up” across all frames, boosting the positive view despite short-term correction.
Executive summary:
Strong bullish convergence from Daily → 15min timeframes.
Ongoing short-term pullback, no HTF pivot breaks.
Any break below $97.6k would invalidate the swing bullish scenario.
__________________________________________________________________________________
Macro, Economic Calendar, On-chain & Risk Management
__________________________________________________________________________________
Macro:
FOMC imminent (June 17–18): waiting – volatility on rate/dot plot.
Geopolitical risk (Iran-Israel): sustained global risk-off may escalate.
BTC shows strong resilience at 106k.
Economic calendar (key points):
June 17–18: FOMC — maximum impact (stocks, FX, crypto)
June 17: Fed leadership rumors — potential volatility, BTC stable
June 17, 08:30 UTC: USA — retail sales (May/core)
On-chain:
Key support at $97.6k (STH cost basis), resistance at $115.4k.
Long-term holders are distributing, but bullish accumulation pressure intact.
Clustering may amplify short-term directional moves.
Key scenarios:
Bullish: Extension to 110–115k if FOMC positive, stop below 97.6k.
Bearish: Break of 97.6k = risk of drop towards 92.9–95.4k.
Management: Avoid exposure pre-FOMC, active monitoring, strict stops.
Patience & discipline: Only size up with post-FOMC validated reaction or confirmed breakout. On-chain cluster = invalidation radar for bullish bias.
__________________________________________________________________________________

Geopolitical Tensions & Technical Pattern Point to BTC Decline!Bitcoin ( BINANCE:BTCUSDT ) fell about -5% after tensions between Israel and Iran escalated. Unfortunately , these tensions are still escalating, but Bitcoin has managed to recover about +3% so far.
Bitcoin is moving near the Resistance zone($107,120-$105,330) and Cumulative Short Liquidation Leverage .
In terms of Elliott Wave theory , it seems that Bitcoin is completing a corrective wave . The corrective wave structure could be Contracting Triangle . In case of a sharp decline in Bitcoin again, we can consider these waves as five descending waves (if Bitcoin does NOT touch $106,600 ).
I expect Bitcoin to start declining again and at least drop to the Support zone($107,120-$105,330 ). The second Target could be the Support line and Cumulative Long Liquidation Leverage .
Note: If Bitcoin can break the Resistance zone($107,120-$105,330), we can expect further increases in Bitcoin.
Please respect each other's ideas and express them politely if you agree or disagree.
Bitcoin Analyze (BTCUSDT), 1-hour time frame.
Be sure to follow the updated ideas.
Do not forget to put a Stop loss for your positions (For every position you want to open).
Please follow your strategy and updates; this is just my Idea, and I will gladly see your ideas in this post.
Please do not forget the ✅' like '✅ button 🙏😊 & Share it with your friends; thanks, and Trade safe.

BTCUSDTHi . after a crash market because of war , we can get big gain of this chance , MA 100 in 1h can hold and Reverse move to 110300$ . #BTC LONG Limit buy : 105800$ , Lev : 100x , SL : 105500$ , Target : 110300$

Bitcoin (BTC): Markets are Cooked | Big Volatility IncomingYes, markets are cooked....all those tensions and news that are pressuring markets from every corner might result in a very explosive movement.
Now we've been looking for a new ATH to form near $120K and we still keep that game plan as long as buyers keep the dominance above the 200EMA line.
There is not much we can do now but just speculate. Speculate that when the war between Russia and Ukraine happened, what markets did exactly was they dumped and then shot highly up (talking mainly about Bitcoin).
So we might see similar things in the markets depending on what will happen next in the world, but one thing is sure: some will make a lot of money soon and some will lose a lot. Be sure to have proper risk management, as this is crucial!
Swallow Academy

BTC/USDTHello friends, I hope you are doing well. This analysis came to my mind for Bitcoin. On the 4-hour time frame, if Bitcoin crosses the areas I specified, it will move towards its targets. It could be bullish because gold and oil were bearish yesterday. What do you think, friend?

BTC/USDT – Rising Wedge Breakdown Looms Near $110K
Idea Summary:
Bitcoin is compressing in a rising wedge on 1D/4H timeframes, approaching resistance around $ 110K–$ 112K. We’re seeing bearish divergence on RSI and MACD, declining volume, and sentiment cooling—signaling a potential breakdown.
Key Confluences:
• Rising wedge pattern (bearish reversal during uptrend) with converging trendlines and falling volume
• RSI divergence: price rising, RSI flattening/declining
• Volume behavior: weaker rallies, distribution-style setup near highs
• Sentiment neutralizing: Fear & Greed Index slipped from ~74 to ~55–60
• Macro backdrop: U.S. inflation cooling, Fed pause in rate hikes → but upcoming FOMC brings volatility risk
Conclusion:
BTC is near a wedge apex with short-term bearish structure forming. A breakdown could test $ 90K–$ 75K, whereas a break above $ 112K invalidates the setup. 📉
Trigger zones:
• Breakdown < $ 105K → triggers short
• Breakout > $ 112K → stop out & pause
💬 Thoughts? Breakdown or breakout next?

[SeoVereign] Bitcoin Bearish Outlook – June 17, 2025We are the SeoVereign Trading Team.
With sharp insight and precise analysis, we regularly share trading ideas on Bitcoin and other major assets—always guided by structure, sentiment, and momentum.
🔔 Follow us to never miss a market update.
🚀 Boosts provide strong motivation and drive to the SeoVereign team.
--------------------------------------------------------------------------------------------------------
Hello,
This is SeoVereign, approaching technical analysis not as a result but as a prediction, with a realistic perspective.
I am presenting a bearish view on Bitcoin as of June 17, 2025.
First, based on the fact that a downtrend appeared near the 0.786 level of the overall Fibonacci retracement, I believe strong downward pressure is forming, and thus I am outlining this bearish perspective.
This 0.786 level corresponds to around the 109,000 price range. On the chart, the 109,000–110,600 range is a very strong supply zone where support and resistance have repeatedly been confirmed.
Next, from a wave counting perspective, the 1.272 trend-based Fibonacci extension lies in a similar area as the 0.786 retracement level, which further reinforces my conviction in this view.
After successfully predicting the downward movement from the 11th, I have been continuously counting the recent upward wave, and the wave structure on the chart appears to align naturally, as I see it.
In addition, from a harmonic perspective, the Alt Bat pattern is functioning effectively, and since the movement has been captured within the pre-set X–1.13 range, the confirmation of this pattern can also be considered successful.
The first target is currently set around the 105,700 level.
I will continue to monitor the market closely, and once this idea progresses to a certain point, I will share more specific evidence and the thought process behind the bearish entry through an additional update.
Thank you.

Bitcoin - Bears vs Bulls: $100k next?Price recently tapped into a well-defined 4H and daily resistance zone and was met with an immediate rejection. That rejection wasn’t just a reaction, it led to a confirmed market structure shift as price broke the previous low. This transition from higher highs to a lower low signals the first sign of bearish control, flipping the short-term bias and setting the tone for a move lower.
Retest of MSS and Inversion Fair Value Gap
After the break in structure, price retraced directly into the origin of the move, retesting the same zone where the shift occurred. A previously bullish 4H gap has now flipped into resistance, rejecting price perfectly. This inversion, where a bullish imbalance turns into a bearish reaction zone, confirms the change in direction and strengthens the downside narrative.
New FVG as Entry Opportunity
The latest bearish impulse created a clean new fair value gap just above current price. A retest of this gap would offer a high-probability continuation setup, as it aligns with both recent structure and order flow. This zone becomes the critical level for bears to defend, and unless price reclaims it, the expectation remains for continuation toward lower liquidity.
Liquidity Outlook and Bearish Target
Below current price, a large pool of liquidity is sitting just above a major psychological round number. That level hasn’t been swept yet and is a likely downside magnet. With no meaningful support between the current FVG and that draw on liquidity, price is likely to reach for it next. This fits the typical sequence following a market structure shift: rejection, shift, retest, continuation, and liquidity sweep.
Momentum and Contextual Confluence
Zooming out slightly, the current move fits within broader bearish momentum that has been developing across timeframes. There’s no sign of strong bullish absorption, and each push higher has been met with efficient selling. This isn’t a chaotic breakdown, but a controlled sequence of lower highs and lower lows, supported by clean structural shifts and consistent rejection zones.
Conclusion
The chart tells a clear story. A clean rejection from a key resistance zone led to a confirmed bearish structure shift, followed by a textbook retest and fresh fair value gap. As long as price remains below that gap, the setup favors continuation lower, with the nearest liquidity pool being the most likely draw. This remains a high-probability bearish scenario until proven otherwise by a shift back above invalidation levels.
___________________________________
