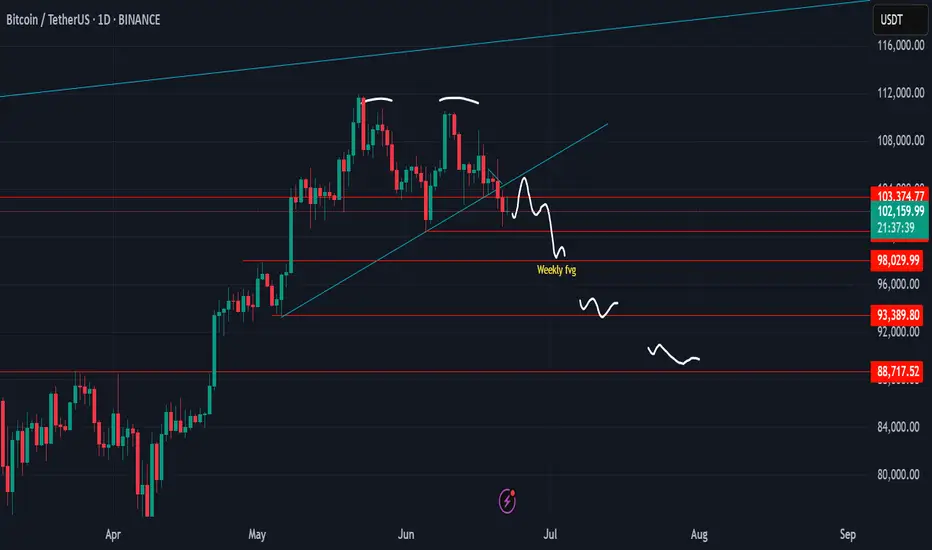
Bitcoin, everyday dump dayNow, we can see everyday is dump day till several days
After success breakout trendling and support, then can't back above the lines
Reasonable target is mini pump to retest then dump to 98k, 98k level is support and weekly open fvg
But if 98k break we will see 93k, and if 93k break we will see final of double top target around 88k and altcoin will rug hard again
But if Bitcoin can go back above 108k, maybe this scenario will be invalid
USDTBTC trade ideas
Bitcoin and the descending channel it consistently followsAccording to the UTC+3 time zone, there is a Bitcoin channel between the 23:00 and 03:00 candles on May 21, which uses the width of the channel (the yellow channel). If we copy the same channel and place it at the upper wick of the 15:00 candle on May 27, we get the green channel. Similarly, by copying the yellow channel and aligning it with the lower wick of the 03:00 candle on May 22, which is one of the first two white candles at the start of the channel, we get the orange channel. The blue channel, on the other hand, is my prediction. In addition, not only the 0 and 1 points (solid line) of the channels but also the 0.5 (short line), 0.25, and 0.75 (dotted lines) levels act as support and resistance.


bitcoin btc shortshort entry :107.300 , STOP LOSS: 108.400 , PROFIT TARGET 101.000
RR 1:5 BINANCE:BTCUSDT.P

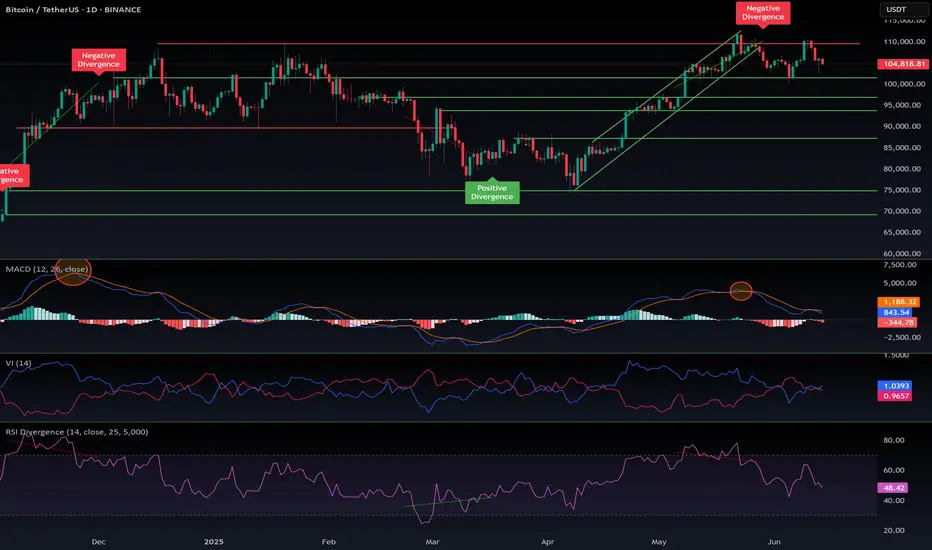
$BTC Breaks Key Support – Bearish Signal Bitcoin has lost the CRYPTOCAP:BTC Breaks Key Support – Bearish Signal
Bitcoin has lost the critical 50 EMA on the daily chart, which has historically acted as a strong support level. This breakdown mirrors the 2021 double top structure and is now hinting at a deeper correction.
🔸 Key Support Zone at $100,000:
Losing this zone increases downside risk. If $100K fails to hold, next visible supports are at $96K and $91K, aligning with past consolidation zones.
🔸 Risk Level at $104,500:
A daily close back above $104.5K would invalidate this bearish view and indicate strength recovery.
🔸 Outlook:
Wait for further confirmation below $100K for potential short setups. Avoid long entries until clear reversal signs appear.

BTC is stuck in a tightening triangle — compression phaseVolatility building up into June 18–19.
Expect a big breakout.
Main scenario: breakout to the upside with a “God Candle” and new momentum for altcoins after prolonged BTC dominance.
Alts have been suppressed, but that’s part of the setup — don’t get tricked by the fake moves.
Stay patient, don’t lose focus, and be ready for a sharp move!

Today's BTC trading strategy, I hope it will be helpful to youWhen Bitcoin prices dip to $101,900—despite the prevailing bearish sentiment—a rational long-position strategy can still be formulated by weighing long-term investment value against potential short-term rebound opportunities. The analysis below covers entry timing, position management, and risk control.
I. Entry Timing Judgment
(1) Technical Signals
Monitor price performance around $101,900. Potential long entry signals include:
1. **Confirmation of bottom patterns**: When prices consolidate near this level to form double bottoms, triple bottoms, or other base structures, and the trading volume during the second/third retest is notably lower than previous attempts—indicating weakening selling pressure. For example, if a double bottom forms near $101,900 with 30% less volume in the second retest than the first, this signals a preliminary entry point.
2. **Technical indicator crossovers**: Track metrics like the Relative Strength Index (RSI) and Moving Averages (MA). A long signal strengthens when:
- RSI breaks above 50 from oversold territory (below 30).
- The 5-day MA crosses above the 10-day MA (golden cross).
- Price breaks through short-term resistance (e.g., $102,500) alongside moderate volume expansion.
(2) News Catalysts
Macro events and industry trends are critical for timing:
1. **Fed dovish signals**: Clues of earlier rate cuts or reduced hiking expectations—boosting market liquidity and benefiting Bitcoin. Align such news with technical signals to enhance long-position reliability.
2. **Cryptocurrency sector tailwinds**: Developments like progress on U.S. stablecoin legislation, relaxed global regulatory policies, or breakthroughs in real-world adoption (e.g., more enterprises accepting Bitcoin payments, higher settlement ratios) can reignite value reassessment. If prices stabilize near $101,900 amid such news, consider entering long positions.
Today's BTC trading strategy, I hope it will be helpful to you
BTCUSDT BUY@102000~103000
SL:101000
TP:105000~106000

BTC get out while you still can!I've been warning people about this for weeks. History doesn't repeat itself, but it certainly rhymes. BTC had a double tope and the 50 / 200SMA show cooling and both showing clearly that it's moving one direction and it's not up. Gravity with this one is strong (historically) and so is the volatility. Crypto bros will go back to eating beans and rice!
MSTZ and BTCZ could be good plays here....best of luck and always do your own due diligence!

$BTC correction: targets 101k, 97.5k, 94k, 87kThe hype is peaking — institutions, banks, Wall Street, and even governments are buying Bitcoin.
Yet despite the frenzy, BTC has been rejected three times around the $110K level and appears to be heading into another correction.
Bitcoin maximalists are pushing a strong FOMO narrative to attract retail investors, but several factors are pushing back:
- Psychological barrier: At these price levels, retail investors are hesitant. Owning just a "fraction" of a Bitcoin doesn’t appeal to the average person.
- Geopolitical tension: The conflict with Iran is serious. This isn’t a small, isolated country — Iran is a millennia-old civilization with global alliances. This situation won't resolve quickly or easily like Libya, Syria, or Iraq.
- Oil price surge: Escalating tensions could disrupt the Strait of Hormuz, a critical route for global oil. Western sanctions on Russia already strain supply — if Iran joins, where will Europe get its energy? U.S. supply won’t be enough. Expect a spike in inflation.
- Recession risks: Persistent inflation could drive a recession in the second half of the year.
- Trade wars & tariffs: No resolution, just chaos.
- Ukraine-Russia war: Still unresolved. Still draining global stability.
In short, the world is burning — and this is terrible for markets.
Bitcoin maximalists — some even selling company shares to buy more BTC — may soon face the harsh reality: Bitcoin needs a deeper flush before it can rally again. Retail won’t return until altseason clears the way and resets sentiment.
In a cycle dominated by propaganda, institutional manipulation, and global unrest, predictions are fragile. The only guide left: the chart.
Technically, we’re in correction mode again. Comparing with past cycles, potential pullback targets are:
$101K, $97.5K, $94K, $87K
There’s massive support at $74K, but it's unlikely we revisit it soon.
Stay cautious. DYOR.
#Bitcoin #CryptoMarket #BTCUpdate #Geopolitics #Altseason #CryptoCorrection #MacroView #CryptoFOMO #RiskAssets #DYOR
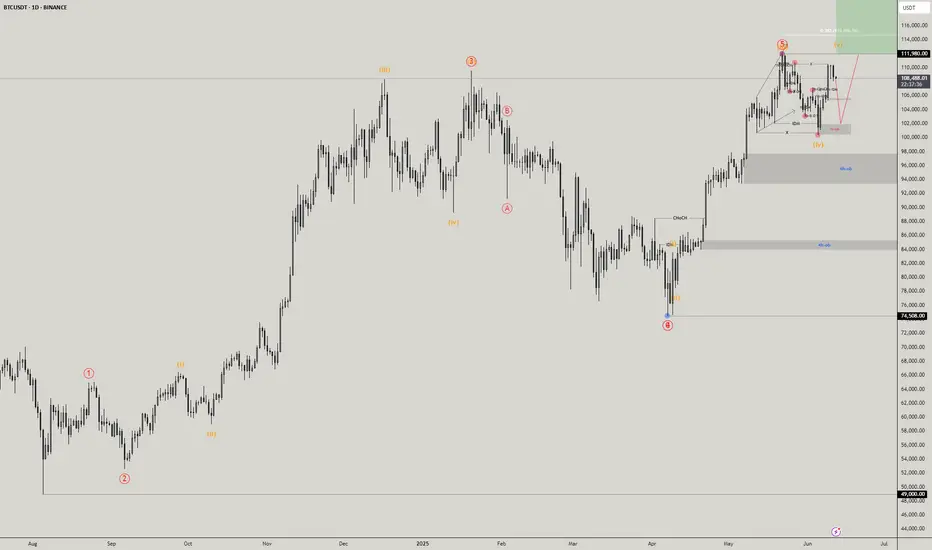
BTCUSDT Possible Sell BTCUSDT completed wave 4 of 5 and currently in wave 5 of 5 . wave 5 targets are on green and a possible sell is in place to finish wave 2 of 5 .
Good LUck
The Bull Run IS DONE! (For Now Anyway...)My bold declaration that price has reached it's all time high, has done enough buying and is now on sell-mode.

Bitcoin (BTC/USDT) – Bearish Breakdown in Play (4H)BTC has lost key support at $103,573 on the 4-hour timeframe, breaking down from the recent consolidation zone. The rejection from the lower highs and weakening RSI suggest more downside pressure ahead.
Technical Breakdown:
Support Broken: $103,573 (now acting as resistance)
Current Price: $102,246
Next Key Support Zones:
$101,410 (short-term bounce zone)
$97,340 – critical horizontal support
$93,343 – potential deeper flush area
Resistance to Watch:
$103,573 (retest = short opportunity)
$105,807 (major rejection zone)
Short Setup (Signal Style):
Short Entry: ~$103,500 (if retested)
Stoploss: Above $105,800
Targets:
TP1: $101,400
TP2: $97,300
TP3: $93,300
Final Note:
Trend remains bearish below $103.5K. Bulls need to reclaim that level fast or further downside becomes likely.
Not financial advice. DYOR.

BTCUSDTHello traders. Wishing each of you a great weekend ahead!
Even though it's the weekend, I’ve spotted a sell opportunity on the BTCUSDT pair and decided to share it with you. However, we should also keep in mind that weekend markets tend to have lower volume. That said, I will still proceed with this trade based on my own risk parameters and trading strategy.
🔍 Trade Details
✔️ Timeframe: 30-Minute
✔️ Risk-to-Reward Ratio: 1:2
✔️ Trade Direction: Sell
✔️ Entry Price: 103815.32
✔️ Take Profit: 102640.12
✔️ Stop Loss: 104402.06
🕒 If the trade does not continue with strong momentum, I will keep the position open only until 23:00 today. Otherwise, I will close it either in profit or at a loss depending on the price action.
🔔 Disclaimer: This is not financial advice. I’m simply sharing a trade I’ve taken based on my personal trading system, strictly for educational and illustrative purposes.
📌 Interested in a systematic, data-driven trading approach?
💡 Follow the page and turn on notifications to stay updated on future trade setups and advanced market insights.

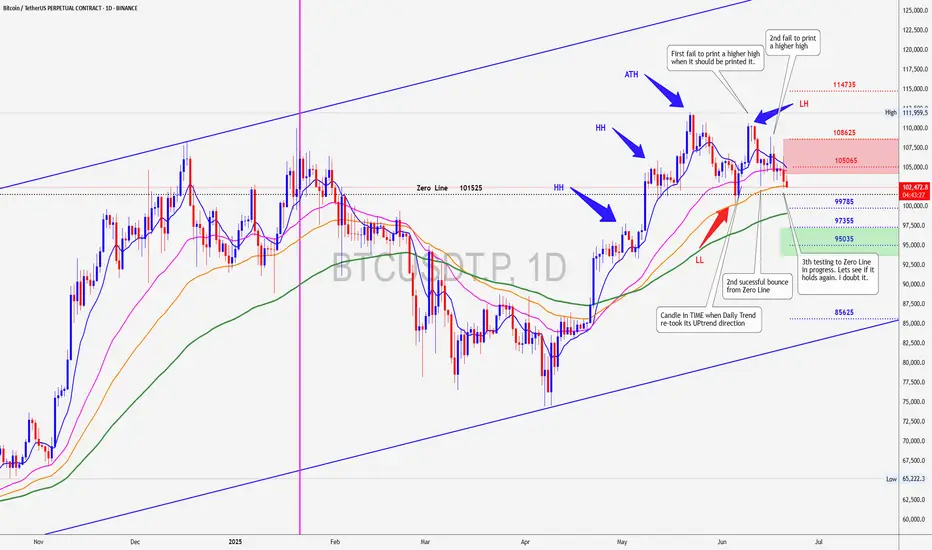
BITCOIN near a danger PointBitcoin has tested its Zero Line twice and bounce, it is said that third TIME is the charm but I think this TIME will be different so prepare for impact.
BTC - SHORTBitcoin will do this in the next days, in a long term vision and i see it touchin the zones below 90,000. The start of a new downtrend!!! DYOR

BTC CORRECTIONBIG REASON WHY
Geopolitical tension. The war between Iran and Israel is inevitable. It's just a matter of time; either the USA, China, and Russia will be involved. The money will flow much more into safe havens like assets.
But based on the Jerome Powell interview after the FOMC statement, the US economy is going on the great path. We can say that if the USA is involved, it will cost the economy growth. But they still need to show the world who's the BOSS (military co.).
The conclusion is,
BTC is too risky for current conditions. As we know, the war might escalate.
BTC Projectory price
Nearest Area 94.5-95K
Mid term Area 85.4 - 86K
Worst Case 76.5-72-53.2K
P.S. Things will change rapidly; always monitor your portfolio and the news

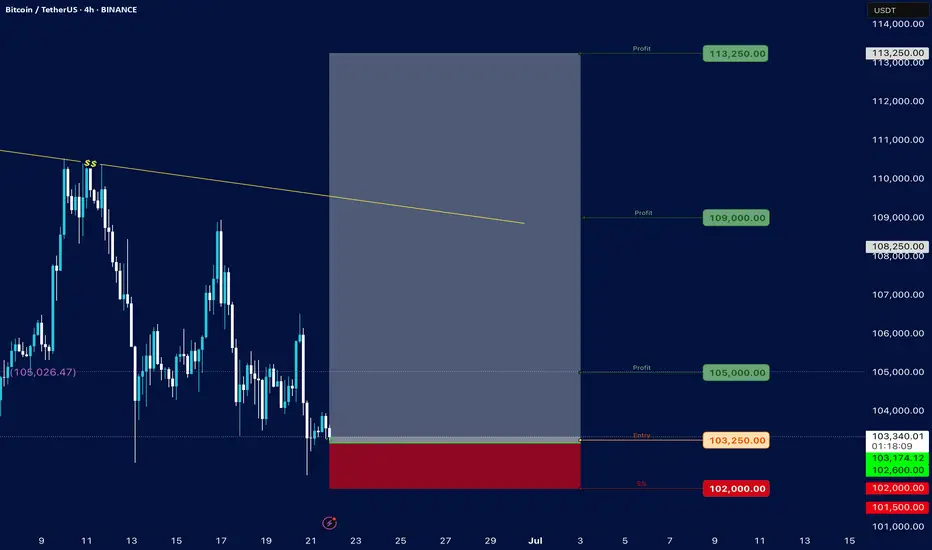
Bitcoin### Bitcoin Price Analysis (June 21, 2025)
#### **Current Price**: $103,236.15 (as of the snapshot)
- The price is hovering near the lower end of the recent range, with key support at **$102,000** (marked as "S/s" on the chart).
- Resistance levels are visible at **$105,000**, **$107,000**, and **$110,000–$114,000**.
#### **Key Observations**:
1. **Support and Resistance**:
- **Strong Support**: $102,000 (critical level; break below could signal further downside).
- **Immediate Resistance**: $105,000 (previous entry point and psychological level).
- **Higher Targets**: $110,000–$114,000 (if bullish momentum returns).
2. **Price Action Context**:
- The price recently rejected the $105,250 level ("Entry") and is now testing lower support.
- The "Profit" markers at $105,000 and $105,026 suggest these were take-profit zones for traders.
3. **Trend and Sentiment**:
- The chart shows consolidation between $102,000–$110,000, with no clear breakout yet.
- A hold above $102,000 could lead to a retest of $105,000, while a break below may target $100,000 or lower.
4. **Volume and Timeframe**:
- The snapshot lacks volume data, but the date range (June–July) suggests a medium-term view.
- Key dates to watch: June 25–28 and early July for potential volatility.
#### **Conclusion**:
- **Bullish Case**: Hold above $102,000 and reclaim $105,000 to aim for $110,000+.
- **Bearish Risk**: Break below $102,000 could accelerate selling toward $100,000 or $99,000.
**Actionable Insight**: Watch the $102,000–$105,000 range for a breakout or breakdown. A rebound from support with volume could signal a buying opportunity, while a drop below $102,000 may indicate further downside.
*(Note: The analysis is based on limited data from the snapshot. For a full assessment, additional indicators like RSI, MACD, and volume would be needed.)*
Bitcoin Expecting Relief moveBitcoin Poised for 109K
Bitcoin is showing resilience around the key psychological support level of 100K which appears to be holding firm despite recent volatility. The current price action reflects a complex consolidation pattern, but overall sentiment remains bullish, driven in part by ongoing geopolitical tensions that are boosting Bitcoin’s appeal as a safe-haven asset.
If this support holds, the structure suggests a potential move toward the next resistance level at 109K.
You may find more details in chart Ps Support with like and comments for more analysis.

BTC is Bearish again?BTC 1W Overview
BTC is still trading above 100k despite the macro situation and ww3 situation in the Middle East , which is fine for the BTC maxis and institutions.
Weekly structure starting to shift in a bearish direction considering the weekly close below the structure and daily range is just a chop fest around the 104k area and so does the other assets getting chopped.
BTC.D is now over 1000 days uptrending and this is wild and not at all what many were expecting this point in the cycle.
Big concern on my mind is that what if BTC pulls back to the 90k area as I think may happen which I marked in the chart then altcoins will leg down another 20-30%.
Obviously everything is not about technical and the fundamental side is simply that there is an ongoing conflict in the middle East and the whole crypto market is waiting for a resolution one way or the other and crypto market lacks patience and even we do get the uncertainty then it still doesn't address the deeper market issues of altcoin weakness and continued dominance of BTC (BTC outperformed every single alt except MKR).
My best bet for LONG maxis will be around the 92k area Weekly FVG and Yearly Open, if we get more bad news from the middle East or Russia-ukraine or Sir powell comes with a bad news then this zone will be fast forwarded
And for short maxis or Beras my best bet will be S\R of 104k or monthly open is area to look for
All this planning will go down the drain if TRUMP comes with a good news regarding Tarrifs with china or other countries or any other news from the TRUMP because he's unpredictable
On the short time frame Scalps are possible on both sides and 100k is a psychological level to long but in bearish scenerio or war news will just wreck it
Final bias shifting Bearish
For alts instead of trying to long every dead cat bounce or predict the bottom we have to wait for it to happen and then react accordingly because reaction and execution is better than drawing predictions and getting chopped

Long trade
1min TF entry
🟢 Trade Journal Entry – Buyside Trade
📍 Pair: BTCUSDT
📅 Date: Saturday, June 21, 2025
🕒 Time: 11:45 AM (NY Session AM)
⏱ Time Frame: 1 Minute
📈 Direction: Buyside
📊 Trade Breakdown:
Entry Price 103,468.8
Profit Level 103,639.8 (+0.17%)
Stop Loss 103,420.3 (−0.05%)
Risk-Reward
Ratio 3.53: 1
🧠 Context / Trade Notes:
1-Minute TF Scalping Setup:
Trade executed on ultra-low time frame during late NY AM volatility window — ideal for short bursts of movement and precision entries.
Liquidity Sweep Below Minor Low:
Entry taken after price dipped below a small intra-session low, triggering a liquidity grab before a quick reversal.

Bitcoin Hits PRZ — Is This the Perfect Short Entry?Bitcoin ( BINANCE:BTCUSDT ) has entered the Potential Reversal Zone (PRZ) after a strong bullish impulse , testing the confluence of Daily Resistance(3) .
In terms of Elliott Wave analysis , the market seems to have completed a complex WXY corrective structure , with the recent rally likely representing the final wave Y . This makes the current zone highly reactive for potential reversal .
I expect Bitcoin to retrace toward the CME Gap($105,075-$105,055) and possibly continue downward toward the Support zone($104,380-$103,060) and Cumulative Long Liquidation levels if the sellers regain momentum .
Cumulative Short Liquidation Leverage: $107,568-$106,601
Cumulative Long Liquidation Leverage: $105,360-$104,784
Cumulative Long Liquidation Leverage: $103,937-$103,217
Note: It is better to look for short positions at the Potential Reversal Zone (PRZ) or if Bitcoin touches $104,780 before reaching PRZ. That is why I chose to label this analysis as ''Short".
Note: If Bitcoin can touch $107,620 , there is a possibility of breaking the resistance lines and increasing further.
Please respect each other's ideas and express them politely if you agree or disagree.
Bitcoin Analyze (BTCUSDT), 1-hour time frame.
Be sure to follow the updated ideas.
Do not forget to put a Stop loss for your positions (For every position you want to open).
Please follow your strategy and updates; this is just my Idea, and I will gladly see your ideas in this post.
Please do not forget the ✅' like '✅ button 🙏😊 & Share it with your friends; thanks, and Trade safe.

BTCUSDTBULLISH TREND
Major Zone = Yellow area
Can take entry on break of HH/
instant buy/
or any fib level 0.5 or 0.618
Sl is mentioned on the chart, you can adjust your tp's according to ur sl and entry.

BTCUSDT – Critical Price Zone | High Probability for Price DiscoBitcoin is currently trading in a critical price zone, showing strong momentum and bullish structure. If the current trend holds, there is a high probability for a price discovery move toward the $121,000 level.
Bullish Scenario:
A sustained move above current resistance which is 110k can trigger a breakout.
Targeting $121K as the next key upside level.
Invalidation Level / Stop Loss:
A daily close below $105K will invalidate the bullish structure.
This would likely lead to a deeper correction toward the $95K–$98K support area.
trade Setup Summary:
Entry Zone: green box
Target: $121,000
Stop Loss: Daily close below $105,000
if strong daily close below 105 k will have last chance to buy btc below 0.1 Million dollar
DYOR
