Bitcoin Short-Term 1H Timeframe, Next Target ConfirmedWe have two drops on this chart. The one of the left is more extended and long lasting compared to the one on the right. When a move is sudden with major force, it tends to end suddenly as well.
The recent drop was very steep and the force needed to keep pushing prices lower cannot be maintained, it requires too much energy; for this reason, a higher low is in place and the bulls win the game.
The action is happening above the blue line and space on the chart, this is the 0.618 Fib. retracement support. This is the most important level and so far it holds. Prices went below just to recover. Can be called a failed signal or a bear-trap, whichever you choose, the action is bullish above this level and bearish below.
Bitcoin's main support stands around $102,663, this level was not challenged. Since bears failed to push prices lower, the next logical move is a challenge of higher resistance. And the same pattern repeats, up and down, up and down... This is the short-term noise. When all is set and done, Bitcoin will resolve going up.
Patience is key.
Thank you for reading.
Thanks a lot for your continued support.
Namaste.
USDTBTC trade ideas

Upon reaching PDL price
Previous Day rejected the previous day's low.
When price reaches PDL if price shows a bullish CHOCH to the upside
there could be a bullish orderflow change @ near previous day low's
Could be a good long entry towards previous day high

BTC to 102.5k game plan. here you can see that bitcoin is trading within a zone that will likely lead to a breakout to the downside, unless geopolitical tensions somehow get freed up. I believe that we will see 102.5k by the end of the month, if not sooner.

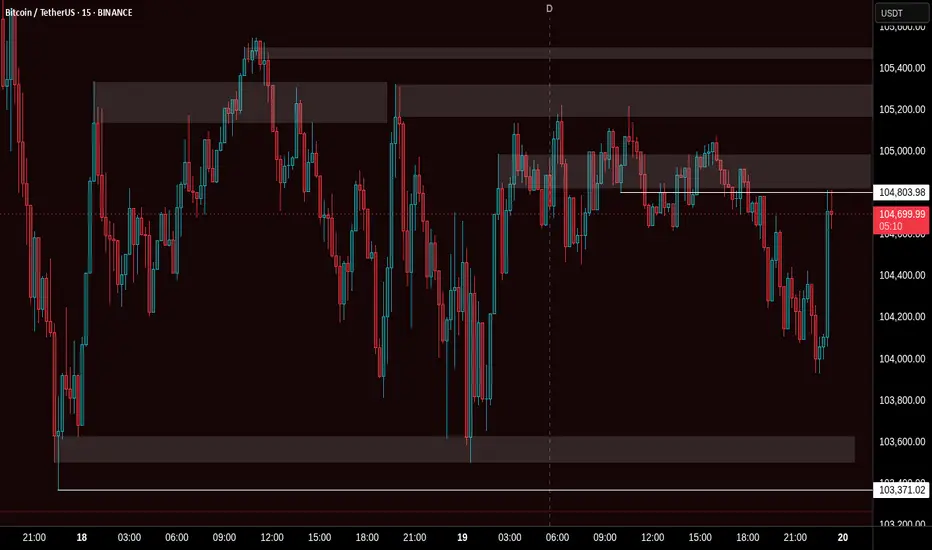
BTC – 15min Reversal Structure & Fibonacci ReclaimWe’re currently witnessing a potential short-term reversal on BTC’s lower timeframe after a volume-supported breakdown and sweep of local lows.
🔍 Key Observations:
Price swept liquidity at local lows (~103,929.27)
Entered into a clear reaccumulation box with responsive buyers
Volume profile shows prior POC just above – room for fill
Fibonacci retracement aligns with key structure:
0.5 = 104,372.94
0.618 = 104,268.23
1.0 = 104,816.60 (final high target for this impulse)
📈 Potential Play:
Entry Zone: Just above the sweep candle (104,100–104,200)
Target 1: 0.382 at 104,477
Target 2: 104,816.60
Invalidation: Close below 103,926
🧠 Mindset:
This is a classic liquidity sweep → reaction → reclaim pattern. If BTC flips the 0.5 level with strong momentum, a short squeeze toward the 104.8K area becomes likely.
Great opportunity for scalpers or day traders.
Let me know if you want this turned into a long-form breakdown or sent in another format.


The Nature of Zones — Reversals, Continuations, and the FlowWe’ve all heard trading terms like Major Trend and Major Counter-Trend levels. These are zones where price either breaks through and continues (Trend Levels) or sharply reverses (Counter-Trend Levels). In the crypto world, these levels are often separated by enormous gaps, due to the nature of the space — as I’ve mentioned in a previous idea: Crypto Charts Whisper—Are You Listening?
Let’s get one thing clear from the start. These levels are not just thin lines that traders casually draw across a chart. They are zones. So, as a skilled trader, anytime someone mentions support or resistance, keep in mind: interact with these as zones, not levels.
Why? The answer lies in the nature of the candlestick itself. Most support and resistance areas — 99% of the time — are defined by candlesticks such as inverted hammers, shooting stars, etc. For instance, in an uptrend near its peak, you’ll often spot an inverted hammer with a rejection wick that’s at least 25–50% of the candle’s body. The longer the wick, the stronger the rejection. In that sense, the high and the close of that candle form the zone. And what better tool to use for this than the rectangle?
Now, to slowly return to our main point — many of you might’ve noticed that zones often change their nature, especially resistance zones. If you’re experienced, you already know: price tends to go higher by nature. So when a counter-trend zone gets broken and price pushes above it, it shifts — it becomes a trend zone. Later, if price retests it from above, it often turns into support, and with another reversal, it can shift again — becoming a counter-trend zone once more.
But my point goes deeper than what you’ll hear in lessons or YouTube videos. Like I said in another post — A Follow-up to “Adjustments for Better Readings & VSA vs BTC” — if it’s already out there, it’s probably old news.
A skilled trader keeps an open mind — merging everything into one system. And it's part of this oneness mindset that elite traders follow, which I want to share now.
So I ask you:
What if the idea of trend and counter-trend zones didn’t just apply to major levels?
What if this concept applied everywhere on the chart?
For me, this isn’t just a question anymore — it’s a fact. A fact that made me a better trader. I won’t lie — before I got good at this, I failed over and over. But I never quit. That’s not the point though. The point is to expand your vision and train yourself to react just like the elite do.
Take double or triple tops/bottoms — standard or rounded. These formations also act exactly like trend and counter-trend zones. And they stay relevant well into the future. Every level is tested at least twice, from both directions. Maybe not immediately, but eventually — across multiple time frames.
And just like that, a level becomes a major zone for future use — especially if you trade across multiple time frames. So be careful: if you’re only looking at the 1-hour chart, you might miss something important that’s playing out on the 3-minute. And that can trigger psychological discomfort... leading to FOMO — and all the mistakes that come with it.
Also remember — double and triple tops/bottoms are zones, not exact lines. Many traders lose trades by a single tick, just because they forget that rule.
Let’s go a bit deeper now.
Think about all the small highs and lows that appear between those tops and bottoms on a 3-minute chart.
How can they help you trade better? The answer goes back to my previous idea: Location, Location, Location — Consistency and Alignment.
I get it — staying observant 24/7 is hard. That’s why institutions and big players work in teams, in shifts. They’re never alone. You shouldn’t be either.
There’s a lot more that could be said about these levels and zones — how they reveal future trend behavior, a flow! even without indicators or VSA. It has to do with how specific highs and lows behave at certain points in time... but let’s leave that for now.
For the outro, remember this:
The real edge isn’t in indicators.
It’s in your ability to catch the flow of price,
And to read strength or weakness through the simple structures within the zones Big Players create — whether visible or hidden.
A chart isn’t a single truth.
It’s a battlefield of conflicting zones and mixed signals.
If this mindset resonates with you and you want to go deeper — whether it’s building confidence or spotting hidden signals early — I work with a small circle of traders, sharing TA privately every day. Feel free to reach out.
Until next time, be well and trade wisely.
ABC or 12345Just a little deeper to finish the wave count and we're all set. If it stays an ABC, it could mean an expanded flat correction, which wouldn't be good since it would mean we'd go deeper later.

Future market trend predictionIn the short term, the price trend of Bitcoin is full of uncertainties. On the one hand, if the global macroeconomic environment continues to deteriorate, with slower economic growth and increased inflationary pressures, it may prompt more investors to seek safe-haven assets. As an asset with certain safe-haven properties, Bitcoin may attract some capital inflows, providing support for its price. However, if regulatory policies are further tightened in the short term, especially if more stringent restrictive measures are introduced in countries and regions where Bitcoin trading is active, then the price of Bitcoin may face significant downward pressure.
you are currently struggling with losses,or are unsure which of the numerous trading strategies to follow,You have the option to join our VIP program. I will assist you and provide you with accurate trading signals, enabling you to navigate the financial markets with greater confidence and potentially achieve optimal trading results.

BTC Approaching Key Confluence Zone: Pivot + PRZ + LiquidationsBitcoin ( BINANCE:BTCUSDT ) appears to have broken the Support lines and is currently declining .
In terms of Elliott Wave theory , Bitcoin appears to be completing a corrective wave C . The corrective wave structure is a Zigzag Correction(ABC/5-3-5) .
I expect Bitcoin to start rising again from the Support zone($104,380-$103,660) , Potential Reversal Zone(PRZ) , Cumulative Long Liquidation Leverage($104,471-$103,124) , Monthly Pivot Point , Support line , and 50_SMA(Daily) , and the small CME Gap($106,190-$106,150) will also fill.
Note: Stop Loss: $102,520
Please respect each other's ideas and express them politely if you agree or disagree.
Bitcoin Analyze (BTCUSDT), 1-hour time frame.
Be sure to follow the updated ideas.
Do not forget to put a Stop loss for your positions (For every position you want to open).
Please follow your strategy and updates; this is just my Idea, and I will gladly see your ideas in this post.
Please do not forget the ✅' like '✅ button 🙏😊 & Share it with your friends; thanks, and Trade safe.

BTC RESPECTING THIS BOXESLast time we had great btc trade
This time play this boxes with good risk management

Possible outcome for $BTCBitcoin Price Analysis: Signs Pointing to a Potential Downtrend
The chart above illustrates a detailed analysis of BTCUSDT (Bitcoin paired with USDT) using Elliott Wave theory and key support/resistance levels. After what appears to be a completed 5-wave bullish cycle, the technical outlook suggests that Bitcoin may be poised for a significant downside correction.
Completion of the Elliott Wave Structure
The chart marks the completion of five distinct waves:
Wave (1) initiated the bullish trend.
Wave (2) represented the first significant pullback.
Wave (3) delivered a strong upward surge, surpassing previous highs.
Wave (4) brought another retracement, finding support near a previous resistance zone.
Wave (5) capped off the structure, reaching above the $100,000 mark before exhibiting signs of exhaustion.
According to Elliott Wave theory, a 5-wave impulse is typically followed by a corrective ABC pattern. The chart suggests that this correction is now underway.
But I think it is trying to create a double top pattern.
Key Levels to Watch
Highlighted on the chart are several crucial horizontal zones:
Near-term resistance: Around $109,600 – $112,000. Bitcoin struggled to maintain momentum above this area and has since started declining.
First major support zone: Around $75,000 – $80,000. This was a former resistance zone during Wave (3) and may now act as support during the early stages of the correction.
Critical support levels: Marked at $54,019, $50,000, and $46,877.5. A break below these levels would indicate a deeper corrective move, potentially aligning with the projected path shown on the chart.
Trendline Break and Bearish Outlook
The yellow upward trendline that supported the entire rally is at risk of being decisively broken. The chart projection shows Bitcoin slicing through this trendline, signaling a shift from a bullish to bearish market structure. If this occurs, it could lead to accelerated selling pressure as confidence in the uptrend erodes.
Projected Price Path
The white arrows in the image depict a scenario where Bitcoin could fall to around $54,000 and possibly as low as the $46,000 region if key supports give way. This represents a significant correction, but one that aligns with historical post-impulse patterns seen in previous Bitcoin cycles.
Conclusion
While Bitcoin has enjoyed an impressive rally culminating above the $100,000 level, technical indicators on this chart point to the increasing likelihood of a sustained downward correction. Traders and investors should monitor the key support levels closely and be prepared for heightened volatility as the market seeks a new equilibrium following this extended bull run.


BTC: Short 19/06/25Trade Direction:
BTC Short
Risk Management:
- Risk approx 0.25%
Reason for Entry:
- M30 + M15 Bear Div
- Rejected off Monday low
- Failure to break weekly open
- H1 overbought
- Market is choppy, HTF Bearish
Additional Notes:
- Compounding shorts to maximize edge if trade confirms, currently have a risk free SOL short running. Moving my risk to this.

June 12, 2025 Historical Comparison Analysis [Wave Analysis]No one knows tomorrow but what if???
Here, we have a historical comparison between December 07, 2020 to June 13, 2022, and January 22, 2024 to present day.
December 07, 2020 to November 08, 2021:
• Uptrend
• Flag (retracement)
• Uptrend continuation
• Range
• Downtrend
• Range (W or Double bottom pattern)
• Uptrend
• Flag (retracement)
• Uptrend continuation
November 08, 2021 to June 13, 2022:
• Downtrend
• Flag (retracement)
• Downtrend continuation
January 22, 2024 to May 19, 2025:
• Uptrend
• Flag (retracement)
• Uptrend continuation
• Range
• Downtrend
• Range (W or Double bottom pattern)
• Uptrend
May 19, 2025 to present day:
• .......
JUST WHAT IF HISTORY REPEATS ITSELF

Bitcoin Ready For Fall Check my levels Hello trader's
Here is the chart level of bitcoin for selling...
So if you want to Know about intrday levels
Comment...

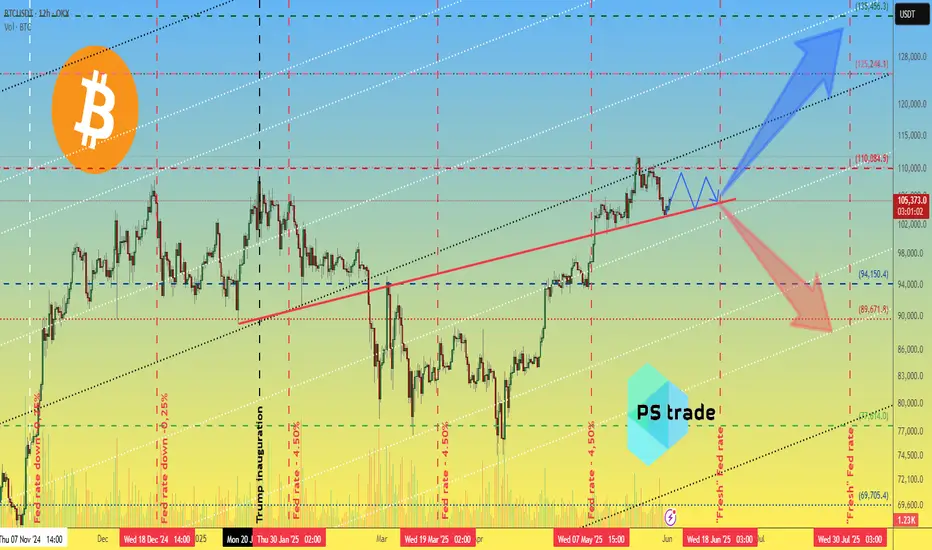
Bitcoin BTC price analysis🍿 At the OKX:BTCUSDT chart, we show one of the scenarios that could play out in the first half of June.
Much will be decided today with the opening of the US market. It is very likely that there will be a downward movement at the opening in response to the new tariffs announced by Trump on Friday after the markets closed.
🕯 Well, then we'll have to “keep our fingers crossed” that market players show their strength and hold on and buy back the drop — like say: we're tired of shaking with every crazy statement from Trump.
💰 If the price of CRYPTOCAP:BTC stays above $103k, there is a chance that it will be “stuck” in the $103-110k consolidation. The market needs to digest and redistribute the results of two months of #BTCUSD price growth from $75k to $112k.
And considering the position of the BTC.D and USDT.D indices, there is a chance that the “little bit” of capital will pass to the altcoins, and they will shoot up a little.
⁉️ Probably, the safest thing to do would be to watch the altcoins and buy only those that have started a significant upward movement with volume.
What do you think?
BTC
BTC is currently in local consolidation. After a liquidity grab on either side, potential entry setups may form via the AMD pattern — but only if key conditions are met.
No setup — no trade. Wait for confirmation.


#Bitcoin Update - 19.06.2025🚨 #Bitcoin Update – 19.06.2025 🚨
For the first time after FOMC, Bitcoin is showing an unusual calm – and yes, that’s pretty strange, especially considering the ongoing tensions in the Middle East. But let's break it down clearly and from my point of view. 👇
🔹 Arrow #2 remains a crucial resistance level. Price *did* break above it, but there was no strong confirmation or momentum – it got rejected and pulled back.
🔸 Currently, Bitcoin is stuck in a range, moving between Arrow #2 and Arrow #4 (marked by black lines). This range-bound behavior might continue for a while unless we get a strong breakout.
🌟 Now, pay close attention to the yellow lines under Arrow #3 and Arrow #5 – these are key support zones. As long as these hold, bullish sentiment remains intact.
✅ Also, Arrow #6 (black line) is the last strong support – only if this breaks, we can start talking about a potential bearish move or at least a deeper retest.
📈 In my opinion, we might see another attempt to break the All-Time High (ATH) very soon. Price still looks bullish, and as long as we hold above Arrow #6, there’s no clear sign of weakness.
🎯 Summary:
* Market is calm but not dead.
* Still bullish unless Arrow #6 breaks.
* Range between Arrow #2 & Arrow #4 continues.
* Eyes on next ATH attempt! 🚀
🧠 Stay patient. Stay focused.
📊 Next up: ETH and Bitcoin Dominance analysis coming soon – make sure you follow so you don’t miss the update!
\#Crypto #BTC #Trading #BitcoinAnalysis #CryptoUpdate #BTCUSDT

BTC/USD – Price Rejected at ATH | Key Support in PlaY Bitcoin recently reached a new all-time high at $111,942, but the daily candle closed lower around $109,550, signaling a potential rejection.
On the 1D timeframe, we are now watching the $100,725 level closely. A confirmed break below this support would be a strong signal to consider short positions.
Until then, BTC may consolidate or attempt another push higher. Patience is key here — wait for confirmation.
📌 Key levels:
• Resistance: $111,942 (ATH)
• Support: $100,725 (critical break level)
🧠 Trade safe, manage risk, and follow for more analysis.

BTC-----Buy around 104900, target 106000 areaTechnical analysis of BTC contract on June 19:
Today, the large-cycle daily level closed with a small positive line yesterday, the K-line pattern was a single positive line with continuous negative lines, the price was below the moving average, and the attached indicator was dead cross. The general trend of the decline was still relatively obvious, but in trading, we should pay more attention to the rhythm of the price range in the shock, so the operation should be decisive, not greedy, and do a good job of risk control; the short-cycle hourly chart yesterday's intraday support was corrected upward, the European session fell but did not continue to break down, the price support rebounded in the early morning, the current K-line pattern was a single positive line with continuous positive lines, and the attached indicator was golden cross, so it is highly likely to break through yesterday's high of 105500 area within the day.
Today's BTC short-term contract trading strategy:
Buy at the current price of 104900 area, stop loss at 104000 area, and target 106000 area;

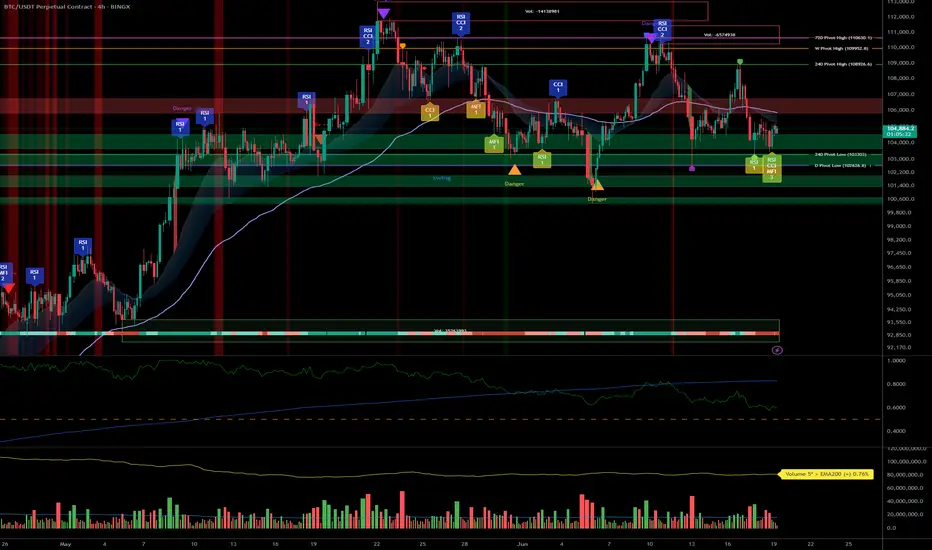
BTC – Bullish bias under review: 102k/103k supports in focus__________________________________________________________________________________
Technical Overview – Summary Points
__________________________________________________________________________________
Momentum : Dominant on all major timeframes (1D, 12H, 6H, 4H). Risk On / Risk Off Indicator signals STRONG BUY except on 15min (neutral).
Support/Resistance : Structurally key pivot zone 102k–106k; major supports 102k/103k. Potential breakout above 106k (swing target 109k).
Volumes : Normal across all timeframes. No excess signals, no accumulation/capitulation peaks.
Multi-TF Behaviors : Horizontal consolidation with bullish dominance. Short-term bearish divergence on 2H–15min, micro-TF in correction only, no panic.
__________________________________________________________________________________
Strategic Summary
__________________________________________________________________________________
Global Bias : Solid bullish structure as long as 102k/103k hold. “Risk On” maintained by sector outperformance.
Opportunities : Entries on pullback/main base 103k–104k; breakouts to watch above 106k.
Risk Zones : Clear invalidation <102k, potential rapid flush to 97k–88k; keep strict stop-loss below 102.5k.
Macro Catalysts : FOMC, Fed projections, Middle East geopolitics keep volatility high, but no shock. Price action leads near-term strategy.
Action Plan : Swing buy on confirmed support, dynamic hedge post-news, monitor volumes/closures on key pivots.
__________________________________________________________________________________
Multi-Timeframe Analysis
__________________________________________________________________________________
1D : Bullish momentum, major supports intact (102k/105k). Risk On / Risk Off Indicator = STRONG BUY, stable volume, no excess. Healthy structure for long swings.
12H : Positive bias, range 102.6k–106k. Risk On / Risk Off Indicator = STRONG BUY.
6H : Presumed accumulation 103k–106k, momentum still strong. No volume weakness.
4H : Range oscillation, structural support test at 103k. Sector outperformance, neutral volume.
2H : First sign of short-term weakness. Divergent with higher TFs but no panic.
1H : Technical rebound towards 104.8k possible as long as 103k support holds.
30min : Short-term trend remains bearish (trend 30min = down). Correction/purge ongoing.
15min : Neutral momentum, supports being tested. No panic or melt-down observed.
Summary : Strong bullish confluence on higher TFs, temporary divergence on micro-TFs. “Range with bullish bias” scenario as long as 102k/103k holds the structure.
__________________________________________________________________________________
Macro and Fundamental Analysis
__________________________________________________________________________________
FED/FOMC (June 18) : Rates unchanged, “data dependent” guidance. Raised volatility but no risk-off shift.
Market Sentiment : BTC technical structure holds, moderate post-FOMC volatility.
S&P500 : Above all key moving averages. Sector momentum (software, uranium, semis) remains dominant.
Energy Level : Weak oil = little macro pressure against BTC.
Geopolitics : Israel–Iran escalation / US posture reinforced. High FX/oil volatility but BTC resilient (>102k), no panic on record.
Economic Calendar : Closely watching BoE & SNB, but low BTC impact odds.
Implications : Post-news phase = ideal for range trading, no rupture event expected within 48h.
__________________________________________________________________________________
Strategic synthesis & R/R guidance
__________________________________________________________________________________
Long on pullback 103–104k, swing targets 106/109k. Optimal R/R (>2.5) if stop 102.5k (D Pivot Low).
Invalidation area : Clean close <102k or heavy downside volume (capitulation via ISPD/volumes).
Risk Management : Dynamic stops, partial hedge post-FOMC during macro volatility.
Conclusion : Bullish structure preserved. Range trading scenario dominant, no extreme signals or panic. Actions: support watch, technical buy on confirmed pullback.
BTC continues to accumulate above 103,500Plan BTC today: 19 June 2025
Related Information:!!!
Bitcoin (BTC) price edges slightly higher, trading near $104,700 at the time of writing on Thursday, after stabilizing above a key level — the 50-day Exponential Moving Average (EMA) at $103,100. A breach below this level could trigger a sharp fall in BTC. Risk aversion could intensify, as reports indicate that US officials are preparing for a strike on Iran in the coming days. Despite this risk-off sentiment in global markets, institutional demand remains strong, with US spot Bitcoin Exchange Traded Funds (ETFs) seeing positive inflows for eight consecutive days
personal opinion:!!!
btc continues to accumulate above 103,500, the market is no longer sensitive to interest rate information yesterday
Important price zone to consider :!!!
support zone : 103.500 \ 101.000
Sustainable trading to beat the market
