Bitcoin - Showing strength as it breaks key resistance levels!Bitcoin (BTC) recently demonstrated impressive strength by bouncing off a well-known confluence zone consisting of the golden pocket and a 4-hour fair value gap (FVG) around the $100,000 level. This technical area has historically acted as a reliable support and once again proved its significance, offering a solid foundation for the current rally.
Following this bounce, BTC surged to $108,000, decisively breaking above the 4-hour FVG near $107,000. With this breakout, the previously resistant zone is now expected to flip into support, adding further confidence to the bullish outlook. This type of price action is often seen in strong uptrends, where key resistance levels are reclaimed and converted into support, providing a base for further upside.
Importantly, BTC has also managed to push through the golden pocket resistance, a critical Fibonacci retracement area closely watched by traders. This breakout, in conjunction with the 4H FVG clearance, clears the path for a potential continuation toward Bitcoin’s all-time high.
Momentum is clearly building. Buying pressure is strong, and retracements have been shallow, indicating a market dominated by demand. While this is a bullish sign, a brief pullback or bounce off the newly formed support (the 4H FVG zone) would be healthy. Such a move would allow BTC to consolidate and build strength before potentially pushing toward new highs.
Overall, the technical landscape looks increasingly favorable for BTC. As long as it holds above the reclaimed support zones, the path to retesting, and possibly surpassing, the all-time high appears wide open.
Thanks for your support.
- Make sure to follow me so you don't miss out on the next analysis!
- Drop a like and leave a comment!
USDTBTC trade ideas

Possible Bitcoin price movement in the upcoming cyclePerhaps to attack the ceiling of the ascending channel, it would be better to collect the remaining liquidity in the 89,000 area, then move strongly towards 35,000.


BTCUSDT: PYH Manipulation & Critical Target AheadWe're facing a potential manipulation at the Previous Yearly High (PYH) level. This is a trap for the unwary.
Here's the critical insight: Bitcoin's price is rising, but CDV (Cumulative Delta Volume) is falling. My volume footprint shows no serious buyers, despite the current price push. This means the underlying strength isn't real.
Your action plan is simple: if the volume footprint turns negative, our target is a precise $100,385.
I only focus on assets with sudden volume increases. Watch the CDV and PYH level closely. Most traders miss these details, but this is where you make the most informed decisions.
Act now: Keep your eyes locked on Bitcoin. Missing this insight could cost you dearly.

BULLISH!💰 #BTC successfully retested the broken weekly resistance with a positive outcome✅
a Morning Star bullish candlestick pattern is forming✨
BULLISH🚀

The current price action appears to be forming or just breaking 🔍 Pattern Analysis:
✅ Possibly a Rising Wedge / Bearish Channel:
• The price has moved up sharply and is consolidating in a narrowing, upward-sloping range, which is typical of a rising wedge—a bearish reversal pattern.
• These wedges often break downward, especially if they form after a steep rise (which BTC has recently had).
✅ Breakout Zone:
• BTC appears to be testing or just breaking above the upper trendline of a prior descending resistance (could be a breakout retest of a downtrend line from a larger timeframe).
• Volume shows a slight uptick, which adds some bullish confirmation, but RSI is in overbought territory (above 70), suggesting caution.
⸻
📊 RSI & Volume Context:
• RSI is above 70, showing potential overbought conditions.
• Volume spiked during the recent move up, suggesting strong buying interest—but watch for divergences.
⸻
🔄 What to Watch Next:
1. Fakeout Risk: If the price fails to hold above the trendline and falls back into the wedge, this would validate the bearish wedge and could lead to a drop.
2. Confirmation of Breakout: A sustained close above ~$108,000 with strong volume may flip this pattern into a bullish breakout, invalidating the wedge.
3. Support to Watch: $106,500 (recent breakout area), $105,000, and the lower wedge line.
⸻
⚠️ Summary:
• Likely Pattern: Rising wedge (bearish), with possible breakout attempt.
• Bias: Cautiously bullish short-term, but bearish risk increases if the price closes back below the trendline.

Is it possible 114k-115k ATH?Here is my insigt on BTC. Possible reach of 114k-115k. And if not, 105k down
Trade at your own risk
#NFA

#BTC - Post Weekly Close Update 👉#BTC has deviated from the RLs and has since seen a magnificent recovery into KL, which, if closed above on the daily, can result in higher prices, potentially even a new ATH. The weekly candle itself is a long-legged doji, which, as you know, is an indecisive candle with a very small body representing indecision, and rightly so, as we continue to range on HTF with no resolution above or below the SH and SL.
I also note that despite the recovery, we’ve closed below the weekly resistance at 106400 on HTF. A weekly close above it would be ideal to confirm higher prices
👉On LTF/MTF – We’ve seen a break above the TL as well as 4H & 12H closes above the PSH at 106766, which ought to be sufficient as a signal for an upward move. For better confirmation, I’d like to see a daily close above PSH, followed by a PB into KL, and we can then look for entries on BTC or alts.
If, however, we see a rejection from the CMP and get below ~103K, it suggests a retest of 100K and potentially even 98K. So keep that in mind, even though that’s an unlikely scenario given the strength of the PA atm.
💪I also note that we haven’t left any imbalances in the chart. Every imbalance has been filled by an LH, which suggests we might see a swift move up if it comes. Now we’re just waiting for the daily close to confirm the BO above PSH, which seems likely given the PA.
💪Also, all BVOLs charts are at support atm, suggesting a massive surge in volatility may follow.
Bitcoin scalp long back to $106450Might wick backdown for entry
Just opened a bitcoin scalp long.
Targeting $106450 back to the recent highs. I anticipate the market will try to break it again then fail and correct deeper
Time sensitive.

BTC/USDT Technical Analysis, 2025-06-03 22:30 UTC✅ Bullish Reversal Confirmed
Breakout from a descending wedge with a strong volume surge (3x avg)
EMA(20) crossover above EMA(50) – early uptrend signal
RSI(14) at 58.7 – shows healthy bullish momentum
MACD turning positive with a fresh signal line crossover
OBV rising in line with price – confirms genuine accumulation
🔍 Smart Money Activity
Whale bid zone spotted between $105,500–$105,600 (visible in DOM)
Breakout aligns with London session high, adding sessional strength
🧠 Technical Confluence
This move combines structure, momentum, and volume — classic signs of a trend reversal and early entry opportunity. Chart markups include the wedge breakout zone, whale bids, EMA cross, and Fibonacci levels for context.
📈 Watching for potential continuation if current momentum sustains. Clean setup backed by technicals and smart money presence.

BTC NEW UPDATE (4H)This analysis is an update of the analysis you see in the "Related publications" section
These days, Bitcoin's movement is mostly driven by liquidity hunting and is caught in complex and risky corrections.
The resistance zone currently in front of Bitcoin is marked in red. If the price is going to get rejected, it should happen from this zone. However, if this zone is broken and price stabilizes above it, Bitcoin could turn bullish again.
Considering today is Monday, volumes are still low, and the price is near a strong order block | you should be careful with your positions.
For risk management, please don't forget stop loss and capital management
Comment if you have any questions
Thank You

BTC RISKY SETUP (ANALYST TOKEN BREAKER)LONGED BTC HERE
RISKY ONE BUT CAN EXPECT PUMP TOWARDS WHITE LINE
BTC Risky Long
📦 Entry Zone: $107,986.2 (Marked on chart)
🎯 TP1: $110,335.5
🎯 TP2: $111,965.9
🎯 TP3: $117,929.0
❌ SL: $106,436.2
🧠 Strategy:
✅ Use low leverage
✅ Risk only 2–5% per trade
⚠️ Stick to the plan — no chasing trades.
Discipline = Consistency 💹

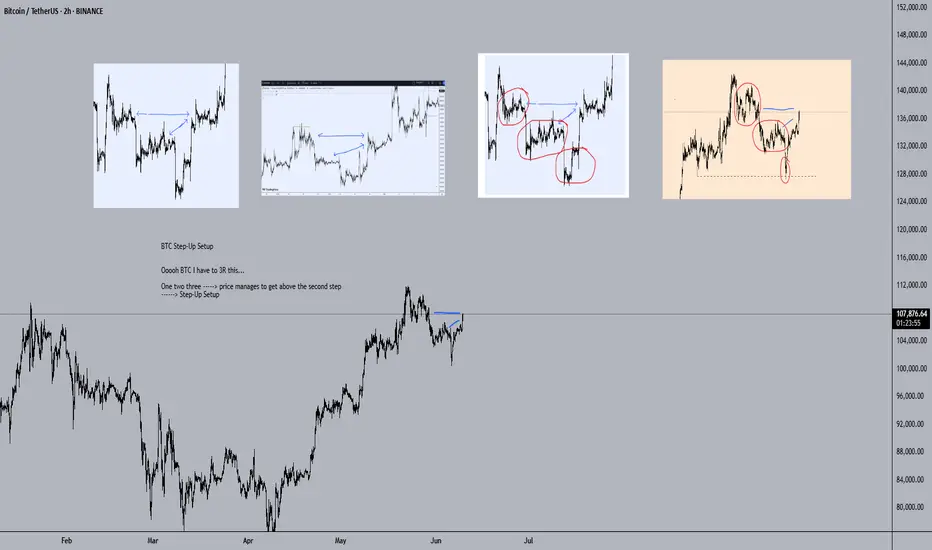
BTC Step-Up SetupBTC Step-Up Setup
Ooooh BTC I have to 3R this...
One two three -----> price manages to get above the second step ------> Step-Up Setup
BTC - setupWe’re currently sitting in a bearish trend reversal zone,
so a pullback is absolutely possible —
and honestly, if you’re heavily long, it wouldn’t be the worst idea to look for some short hedges here.
However, we also have clear signals that are pushing us toward a breakout:
1️⃣ The heatmap shows a massive stack of shorts right above us
2️⃣ The ongoing U.S.–China meeting in London where tariffs are being discussed
➡️ One positive headline could ignite the next rally.
I'm bullish and positioned accordingly.
If anyone has questions, drop them below — I read everything 👇
LFG! 🚀

Bitcoin (BTC/USDT) 2-hour chart, focused on the buy side only!📊 Chart Overview
The chart shows BTC/USDT on the 2-hour timeframe, featuring clear levels of resistance, mini-resistance, and target zones. Let’s break down the buy idea:
🚀 Key Zones & Levels
💜 Resistance Zone (Purple Box):
Historical price ceiling.
Price dropped from this area several times.
🟦 Target Zone (Blue Line):
106,691 - 106,683 USDT.
Target for the next bullish move!
🟧 Mini Resistance (Yellow Box):
Around 102,000 USDT.
Acting as support (buy zone!) now.
💰 Buy Setup & Entry Area
✅ Buy Zone:
Just below 103,000 USDT, aligning with the mini resistance / support box (yellow).
✅ Entry Level:
Between 102,000 - 103,000 USDT.
Best if price consolidates or forms a reversal candle here.
🟢 Target:
First target: 106,000 USDT
Next major target: 106,683 - 106,691 USDT.
📉 Stop Loss:
Below 101,000 USDT for protection.
🎯 Trading Plan
1️⃣ Wait for a bullish reversal candlestick at the mini resistance box (~102,000 - 103,000 USDT).
2️⃣ Enter long (buy) position.
3️⃣ Target profit at 106,000 and 106,691 USDT.
4️⃣ Stop below 101,000 to manage risk.
⚡️ Summary
🟢 Buy: At mini resistance (~102,000 - 103,000).
🎯 Targets: 106,000 - 106,691.
❌ Stop: 101,000.
🚀 Let's ride the bullish wave! 💹📈🟢

TradeCityPro | Bitcoin Daily Analysis #112👋 Welcome to TradeCity Pro
Let’s dive into the analysis of Bitcoin and key crypto indexes. As usual, in this analysis I’ll review the futures triggers for the New York session.
⏳ 1-Hour Timeframe
Yesterday, Bitcoin finally broke through the resistance zone it had formed. As you can see, it pushed through this level with strong buying volume and is now moving toward 108777.
🔍 If you entered a position using yesterday’s triggers, I’d be glad to hear about it in the comments. Your feedback gives me great energy.
⭐ Today, I cannot provide a specific trigger because the market has already made its move. If you do not have an open position, it is better to wait for a new market structure and then identify a fresh trigger.
💥 At the moment, I expect Bitcoin’s upward movement to continue toward 108777. Market volume is strongly supporting the trend and is aligned with price action. RSI is also in the overbought zone, indicating strong buyer presence. If RSI stays above 70, the sharp upward movement is likely to continue.
📊 If a market correction occurs, the price could pull back to the zone I marked. In future analyses, I will review triggers for both trend continuation and possible reversals.
👑 BTC.D Analysis
Bitcoin dominance formed a higher low above 6449 and has now broken the 6467 resistance, signaling the beginning of a new bullish leg.
⚡️ If this upward move continues, Bitcoin dominance may climb further. However, if a pullback to 6467 happens, altcoins could see a strong upward move as well.
📅 Total2 Analysis
Looking at Total2, this index was supported at 114 yesterday and is now moving toward 117.
📈 If Bitcoin dominance starts to drop, Total2 will likely break above 117 and begin a main bullish trend.
📅 USDT.D Analysis
Now for Tether dominance. After forming a lower high below 479, it broke below the 472 support and is now heading toward 464.
✅ In my view, this movement toward 464 is likely to continue, and as that happens, the overall crypto market is expected to keep moving upward.
❌ Disclaimer ❌
Trading futures is highly risky and dangerous. If you're not an expert, these triggers may not be suitable for you. You should first learn risk and capital management. You can also use the educational content from this channel.
Finally, these triggers reflect my personal opinions on price action, and the market may move completely against this analysis. So, do your own research before opening any position.

BTC Testing Major Resistance >>> Rejection Likely?Hi guys!
Did you see my last analysis about Btc? Let's break it down more!
Bitcoin is now testing a major resistance zone around $106.8K, where a descending trendline has already pushed the price down several times.
This area could act as a reversal point again. If BTC fails to break above, we might see a move down toward $102.2K — a strong support level from earlier this month.
Right now, the market is showing signs of weakness near resistance, so this could be a good spot to watch for a short setup — unless bulls step in with strong volume and break out cleanly.
attention to these levels:
Resistance: $106.8K (trendline + supply zone)
Support target: $102.2K
Outlook: Bearish unless breakout confirmed

BTCUSDT: Your Next Move? The Blue Box OpportunityAlright, focusing on BTCUSDT. This blue box is a critical buying zone.
The market's recent moves demand clarity. You need to know where genuine opportunity lies, avoiding the traps that catch most traders.
I've identified this blue box as a prime area where demand could ignite. But don't just jump in. Here's the plan:
Watch the Volume Footprint: Is there real accumulation, or just noise?
Spot CDV Divergences: Hidden strength often appears here, even if price looks weak.
Confirm on LTF: A clear breakout above minor resistance, followed by a retest as support, is your green light.
Be vigilant for liquidity hunts – those quick dips that shake out weak hands before a real move. If this blue box holds, and we get these confirmations, my bias is firmly upwards.
I only focus on assets with sudden, significant volume increases. BTCUSDT's current setup, combined with this potential volume, makes it a high-interest play.
Keep a very close eye on this blue box. Understanding these subtle signals means you can navigate these intricate dynamics, securing your position for potential gains. Miss this, and you might regret it.
📌I keep my charts clean and simple because I believe clarity leads to better decisions.
📌My approach is built on years of experience and a solid track record. I don’t claim to know it all but I’m confident in my ability to spot high-probability setups.
📌If you would like to learn how to use the heatmap, cumulative volume delta and volume footprint techniques that I use to determine very accurate demand regions, you can send me a private message. I help anyone who wants it completely free of charge.
🔑 On my profile, you can find an extensive track record spanning hundreds of analyses and many examples of my strategies in action. To keep things concise here, I'm sharing just a few of my most recent successful calls as a small snapshot of my ongoing work:
📊 FLOKIUSDT - +%100 From Blue Box!
📊 TRXUSDT - I Do My Thing Again
📊 OGNUSDT | One of Today’s Highest Volume Gainers – +32.44%
📊 TIAUSDT | Still No Buyers—Maintaining a Bearish Outlook
📊 Simple Red Box, Extraordinary Results
Feel free to check out my TradingView profile for all of them; listing everything here would genuinely take too long! 😉

BTCUSD is replaying the 2021 double top a bit too perfectlyTracing the weekly highs of Bitcoin's 2021 double top and translating them onto the current highs reveals some startlingly similar patterns.
Removing just a couple of week's bars between the two tops in 2021 gives a very close match to the current pattern we see unfolding.
Are we just watching an action replay?
If so, we would be looking at ~$140k highs by early August followed by a huge retracement to the long term trendline in the c. ~$90k region. Such a retracement is not unprecedented, and from these lows I would expect the price to rise at or above the trend once again, keeping Bitcoin on track to hit $1m by 2029, so this is by no means a bearish prediction.

$BTC similar pattern to early 2024CRYPTOCAP:BTC possible same scenario playing out. Similar pattern, liquidity grab long and short is done. Possible now is time to push higher. Idk what catalyst would push price higher, no rate cut in june. Perhaps tariff settlement.


BTC/USDT Technical Analysis BTC/USDT Technical Analysis | Approaching a Key Confluence Zone
As shown on the chart, Bitcoin has successfully reached our previous bullish targets. The price is now testing a critical resistance zone that could determine the next major move.
🟢 Bullish Scenario: Breakout Toward Key Levels
If BTC breaks above the current resistance, the next targets to watch are:
$106,596 – first resistance
$107,058 – major horizontal resistance
Descending trendline – dynamic resistance that has held strong in recent weeks
A clean breakout above the trendline may lead to further upside toward:
$107,902 and $108,008
These zones have historically acted as strong barriers, so price reaction here will be crucial.
🔻 Bearish Scenario: Rejection and Pullback
If BTC gets rejected at the current resistance, look for support at:
$104,740 – first area for a bounce
$104,146 – key support zone to hold for bulls
Failure to hold these levels could trigger further downside pressure.
📌 Summary
Bitcoin is at a critical intersection of horizontal and trendline resistance. A breakout could ignite a strong bullish move, while a rejection might bring another leg down.
📉 Wait for confirmation candles before entering.
🚀 If you find this helpful, smash that follow for more high-probability setups, clean charts, and daily updates. Let’s trade smart, not blind. 📈

btcusd for short *The content on this analysis is subject to change at any time without notice, and is provided for the sole purpose of assisting traders to make independent investment decisions.