Where Can Bitcoin Go? Part 8 –(Major Chart Update')First of all guys – I made the video! 🎥🔥 Watch the full breakdown before diving into the details below.
It explains everything visually, level by level. Don't miss it.
Now let’s get into the core of the analysis...
🚀📊 Where Can Bitcoin Go? Part 8 – The Final Test is Near! 🔥🔍
Welcome to Part 8 of “Where Can Bitcoin Go?” – the update of this long-running series. Since mid-2023, not much has changed in the structure. That’s the power of solid technical analysis – levels don’t lie.
🟨 The Setup
Bitcoin is now approaching a third test of a major structural resistance. If you’ve followed my 1-2-3 strategy, you know this is where decisions are made:
✅ Test 1: Rejection
✅ Test 2: Rejection
⏳ Test 3: Now pending… the TERMINAL and DECISIVE 'Breakout or Rejection', and this will change everything.
But here’s the deeper layer:
We’re not just testing one sequence. We now have two separate sets of 1-2 rejections —
🔹 One set from 2021 (the Red 1 and 2)
🔹 And a recent one in 2025 (the white 1 and 2)
This upcoming test is the third rejection attempt on both timeframes, making it a rare and extremely significant technical moment.
📐 Price is now near a critical ascending trendline around $115K–$116K, which has been the gatekeeper to parabolic moves in previous cycles.
🔄 Based on historical halving cycles:
548 days post-halving in 2016 → ATH 2017
565 days post-halving in 2020 → ATH 2021
Halving #4 was in April 2024 → 👀 Could this point to a new ATH by end of 2025?
📊 Probabilities
🔹 83% chance we see the third test before year-end
🔹 57% chance of breakout
🔻 43% chance of rejection
⚠️ And here’s the reality check:
If we see that breakout — the market unleashes itself. We’re talking major pumps, potential follow-through moves, and price discovery into untouched zones like $188K, $197K, and beyond.
But... if we get rejected, it won’t be pretty. We could retest major levels like $66K or worse, and lose momentum that took years to build.
And unfortunately — this isn’t like 18K, or 40K, or even the 79K retest.
Things are much more complicated now.
The sentiment, the structure, the risk profile — they’ve all evolved. We cannot afford to have the same blind bullishness we had in those earlier phases. This is a mature part of the cycle, and it demands discipline over emotion.
💬 What’s your take?
Will Bitcoin finally break through?
Is this just another fakeout in disguise?
Are you feeling this same tension in the market?
Let’s talk structure. Let’s talk price. Let’s talk reality.
One Love,
The FXPROFESSOR 💙
Disclosure: I am happy to be part of the Trade Nation's Influencer program and receive a monthly fee for using their TradingView charts in my analysis. Awesome broker, where the trader really comes first! 🌟🤝📈
USDTBTC trade ideas

#BTC Rising Wedge📊#BTC Rising Wedge📉
🧠From a structural point of view, we are trading sideways above the support-resistance conversion zone, and the bullish force is gradually weakening. Only if we break through the blue turning point 109669, will new bullish expectations appear, otherwise we need to be alert to the correction at the daily level.
➡️From a graphical point of view, a rising wedge is formed here, and we usually fall according to this model. At present, it has fallen below the lower edge of the wedge and rebounded to the lower edge and was blocked. I expect a further decline.
Let's see👀
🤜If you like my analysis, please like💖 and share💬 BITGET:BTCUSDT.P

Forecasting the Next Market Top (And Next Market BOTTOM)!This is a very interesting study I started 2 years ago, and found a fascinating correlation with a specific number everyone is aware of, but not typically associated with trading or retracement levels...
I'll reveal all this in the video, plus the NEW element we used to *potentially* reverse engineer the market top of THIS current cycle, which I think comes in end of the year.
In prior Fib studies you can refer to in my Bio area, I've been forecasting $150k as the first 2025 cycle high, then a 20%-25% correction, followed by a push to $200k.
Nothing terribly mind-bending there.
But THIS study looks at the forecasting ability of the Trend-Based Fib Extension, and in this video we look at how it can also be used to reverse engineer the top price.
Speculative at best, I get it.
But very interesting, and wouldn't it be amazing if we see it play out.
Let me know your thougnts and comments!
(And I won't be mad if you suggest it for Editor's Pick!)
Cheers,
Brett
-----
See my bio for links to more of what I do and how to find me online.

BTCUSDTThe Bitcoin market is overbought. I expect a change in trend. A diamond with traders' stop points will be great as a reversal pattern. Let's see

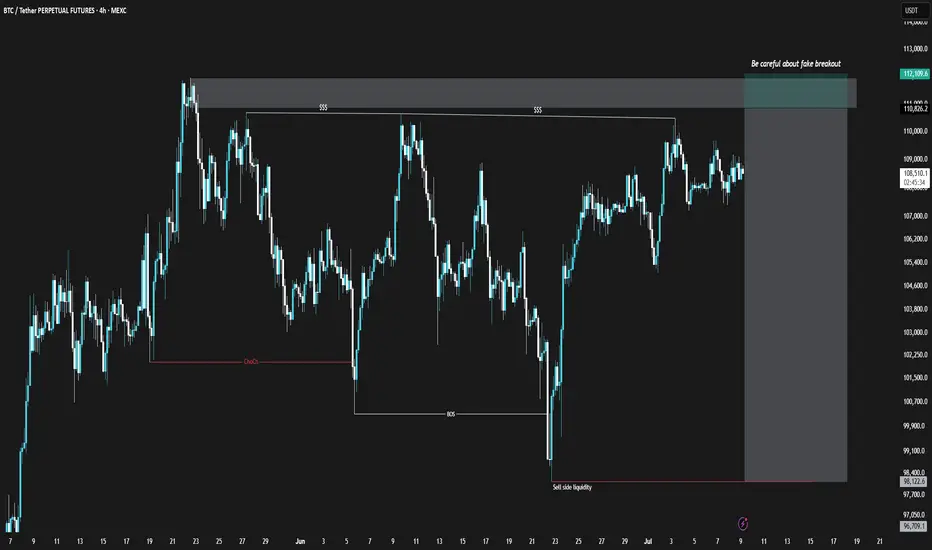
BTCUSDT Short Position (25/Jul/9)Bitcoin, similar to the TOTAL chart, is showing weakness in its bullish momentum. However, unlike TOTAL, the divergence in Bitcoin is clearly noticeable. Additionally, within the marked zone on the Bitcoin chart, there is a possibility of a fake breakout and liquidity grab. I suggest entering only with proper confirmation.
⚠️ This Analysis will be updated ...
👤 Sadegh Ahmadi: GPTradersHub
📅 2025.Jul.9
⚠️(DYOR)
❤️ If you apperciate my work , Please like and comment , It Keeps me motivated to do better
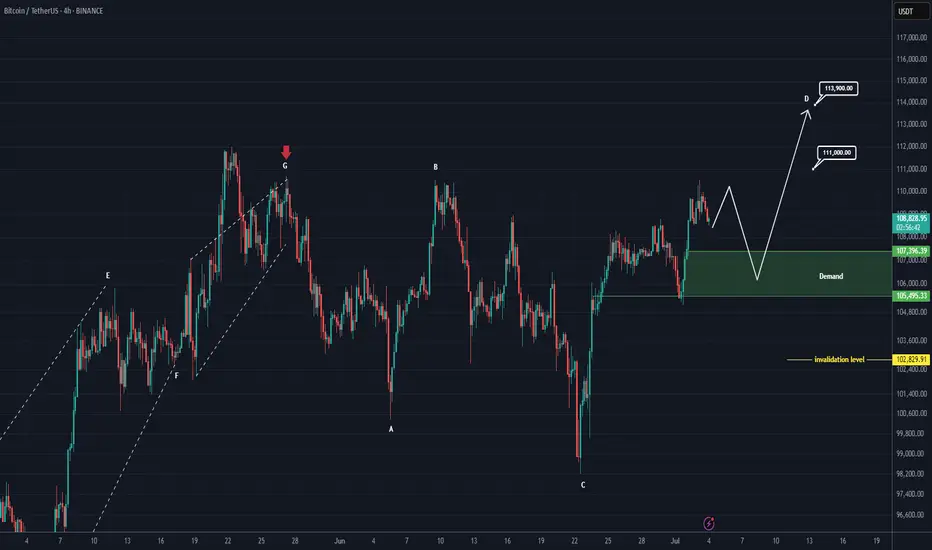
Bitcoin New Update (4H)This analysis is an update of the analysis you see in the "Related publications" section
If we were to publish an update for Bitcoin, wave D could move toward higher levels.
After hitting the green zone and gaining momentum, it could once again move upward to liquidate short positions.
In this update, we've naturally raised and revised the invalidation level.
The new targets have been marked on the chart.
A daily candle closing below the invalidation level would invalidate this analysis.
For risk management, please don't forget stop loss and capital management
Comment if you have any questions
Thank You
BITCOIN Bitcoin and the Potential Move to $136,000 based on my price action +sma+ema advanced strategy.
Current Market Context
Bitcoin (BTC) is trading near all-time highs, recently surpassing $117,000-118000
The market is characterized by strong institutional inflows, robust ETF demand, and bullish technical momentum.
Is a Move to $136,000 Possible?
Analyst and Model Forecasts
Bitwise Asset Management and several market analysts see a 30% rally possible in July, which could push Bitcoin to the $136,000 level. This projection is based on:
Historical post-crisis rallies (average 31% gains after macro/geopolitical shocks).
Institutions buying more BTC than miners can supply.
Global rate cuts increasing liquidity and risk appetite.
Quantitative models and technical forecasters also predict a range between $136,000 and $143,000 as a potential 2025 high, with some models extending targets to $151,000 and beyond.
Other major banks and analysts (e.g., Standard Chartered, Bernstein, Fundstrat) maintain even higher year-end targets ($150,000–$200,000), but $136,000 is seen as a key intermediate technical and psychological level.
Technical Analysis
Bullish momentum is confirmed across short, medium, and long-term timeframes.
Key resistance levels to watch: $120,000 (psychological), $130,000 (round number), and $136,000 (target zone highlighted by several analysts).
Sustained trading above $112,000–$118,000 would support a move toward $130,000–$136,000, especially if ETF inflows and institutional demand remain strong.
Drivers Supporting the $136K Scenario
ETF and Institutional Inflows: Demand from US spot Bitcoin ETFs and corporate treasuries remains robust.
Macro Tailwinds: Expectations of US Federal Reserve rate cuts and a weakening dollar are fueling risk-on sentiment.
Supply Dynamics: The recent Bitcoin halving has reduced miner supply, amplifying the impact of new demand.
Technical Breakouts: Bull flag and breakout patterns suggest further upside, with $136,000 cited as a technical extension target.
Risks and Considerations
Volatility: Bitcoin remains highly volatile; sharp pullbacks are possible even in a strong uptrend.
Regulatory and Macro Risks: Changes in regulatory stance or a major shift in macro conditions could impact the trajectory.
Profit-Taking: Approaching major round numbers like $130,000 or $136,000 could trigger profit-taking and temporary corrections.
Summary Table: Bitcoin 2025 Price Targets
Source/Model 2025 Target Range $136K Move Outlook
Bitwise, Polymarket $136,000 (July 2025) High probability if current trends persist
Coinfomania AI Model Up to $143,440 $136K within model range
Investing Haven $80,840–$151,150 $136K within bullish scenario
Changelly, CoinDCX $100,000–$150,000 $136K is a key resistance
Standard Chartered $120,000–$200,000 $136K as a stepping stone
Conclusion
A move to $136,000 for Bitcoin is considered plausible in 2025 by my market structure advanced strategy , This scenario is supported by strong institutional demand, favorable macro conditions, and bullish technical patterns. However, volatility and macro/regulatory risks remain, so price action should be monitored closely as BTC approaches key resistance levels at 120k and 136k level
#bitcoin #btc

BTC is sitting on a volcanoStrong resistance at 110k and things couldn't get hotter for BTC esp. with the President pumping it and profiting from all of this (ethics 101). Let's recap: yields going up, economy is cooling (S&P going up for a week is not a reflection of things getting better), high interest rates, ultra high historical multiples, tariffs and higher debt, which are inflationary are all in front of us. This is not sustainable, a correction will happen very soon and people could get wiped out.
Always do your own due diligence and best of luck! Profit takers and crypto bros will start selling real soon, just like every other time before.

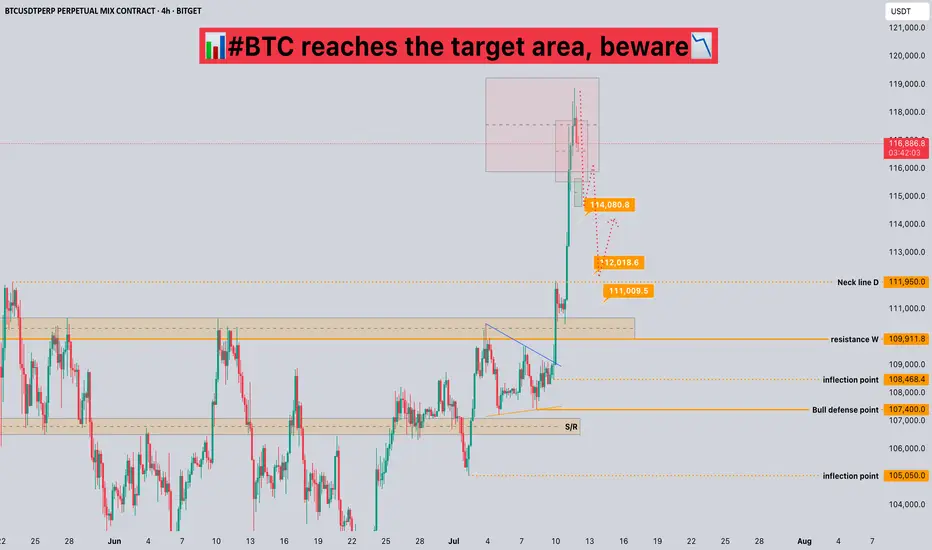
#BTC reaches the target area, beware📊#BTC reaches the target area, beware📉
🧠From a structural point of view, we have reached the target area of the bullish structure, so we need to be alert to the risk of callbacks and do not chase the rise in the target area!
➡️From a graphical point of view, the appearance of the ascending triangle means that the daily level of the upward trend is about to come to an end, so we need to be alert to the correction of the daily level. However, it is worth noting that the bullish trend at the weekly and monthly levels is still intact.
➡️Therefore, if we want to participate in long transactions, we must wait for the callback to occur. The aggressive support level is around 114000, and the stable support area is 110000-112000.
⚠️No matter how the market develops, it is reasonable, so please do a good job of risk management, keep yourself alive first, and then seek profits!
🤜If you like my analysis, please like 💖 and share 💬
BITGET:BTCUSDT.P

BITCOIN UPDATEHello friends🙌
📈Given the upward trend we had, you can see that the price is in an upward channel and has also formed a bullish pattern, which, given the strength behind the trend, seems to have higher targets.
🔊Be careful, the basic principle of trading is capital management, so be sure to follow capital management.
🔥Join us for more signals🔥
*Trade safely with us*

BTC/USD Fake out before Pump | Bullish Flag formationBTC/USDT (1D) Market Outlook – July 1, 2025
Introduction
BTC is currently consolidating within a bullish flag pattern after printing a swing high at 108.9K and a recent swing low at 98K. The price sits just below a major supply zone.
Context 1: Key Zones
Supply: 104.6K – 112.1K
Demand: 74.4K – 82.5K
Fair Value Gaps (FVG): 3 zones below price, with one near 88–90K
Context 2: Technical Confluence
Liquidation Zone: 106.2K
Golden Pocket (Fib 0.618): 102.1K
Psychological Levels: 105K and 110K
Context 3: Market Structure
Pattern: Bullish flag
Trend (LTF): Sideways/consolidation
Volume Profile: Heavy activity near 105K–110K
Bullish Scenario
Breaks above 106.2K (liq zone)
Pulls back to 102.1K (golden pocket), forms higher low
Retests resistance for continuation
Alt scenario: clean breakout above resistance → ATH retest
Bearish Scenario
Breaks below 106.2K and flag support
Fills FVG, breaks prior low at 98K
Triggers macro downtrend toward 88–90K zone
Summary
BTC is at a decision point inside a bullish flag, facing supply. A break above 106.2K favors upside continuation, while rejection and a lower low could trigger a deeper retracement. Watch key levels closely.

TradeCityPro | Bitcoin Daily Analysis #120👋 Welcome to TradeCity Pro!
Let’s dive into the Bitcoin analysis and key crypto indices. As usual, in this analysis I want to review the futures triggers for the New York session.
⏳ 1-Hour Timeframe
In the 1-hour timeframe, as you can see, Bitcoin has finally broken out of the range it formed yesterday and is now moving upward.
✔️ If this upward move continues, we can open a long position in these zones by getting confirmation in the lower timeframes. The main long trigger is still activated after breaking 110256.
💥 The RSI oscillator entered the Overbuy zone in the previous candle. We need to see how the price reacts to this move and what impact this oscillator will have on the price.
⚡️ In my opinion, this RSI move won't have much impact. Although the price is moving upward, the main trend has not yet formed, so there's no real momentum in the market, and RSI is basically useless for now.
✨ If this upward move turns out to be fake, we can enter a short position with the 107853 trigger.
👑 BTC.D Analysis
Let’s look at Bitcoin Dominance. Yesterday, dominance had an upward move and broke its ascending trendline but failed to stabilize above 65.52, resulting in a fake breakout and a move downward.
☘️ The fake breakout trigger for the trendline was the 65.38 zone, which was activated, and now the price is heading downward. If this move continues, the next target will be 65.04.
📅 Total2 Analysis
Alongside Bitcoin’s upward move, this index also activated the 1.14 trigger and is moving up, now reaching 1.15.
💫 If the move continues, the next entry trigger is at 1.17, which is still quite far from the current price.
📅 USDT.D Analysis
Looking at Tether Dominance, the 4.82 trigger was activated, and dominance is now moving down, having reached 4.78.
📈 If it stabilizes below 4.78, we can confirm the continuation of the downtrend in dominance, which could push it down to 4.72.
❌ Disclaimer ❌
Trading futures is highly risky and dangerous. If you're not an expert, these triggers may not be suitable for you. You should first learn risk and capital management. You can also use the educational content from this channel.
Finally, these triggers reflect my personal opinions on price action, and the market may move completely against this analysis. So, do your own research before opening any position.

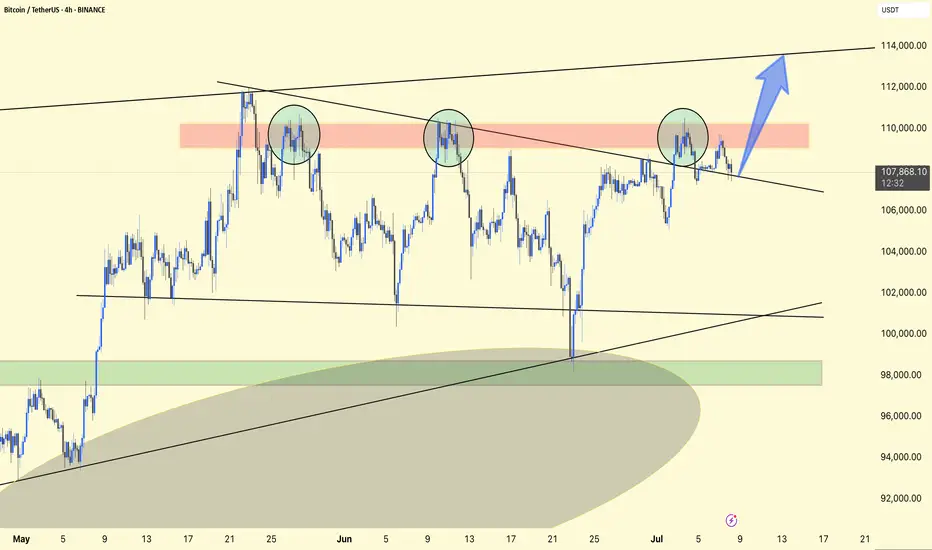
BTC ALL SET FOR MAJOR HIGHS The price has tested the resistance line multiple times showing strong supply/resistance. Buyers are gradually pushing price higher (higher lows), but momentum is weakening near resistance.
This is a sign of consolidation under resistance pattern before breakout .Rising wedge typically breaks down signaling a potential drop, it confirms weakening momentum.
Area to Watch for Entry
103000-104000 (recent demand zone) for Bullish
After daily candle closes above 113000 instant bullish Entry.

BTC 4 HR TIME FRAME ANALYSIS 4H Technical Analysis – BTCUSDT.P (Bitcoin Perpetual on Bitget)
✅ 1. Trend Overview:
Current Market Phase: Strong uptrend.
Price has broken multiple H4 BOS (Break of Structure) levels with strong bullish momentum.
The last impulse candle shows a vertical breakout, often a sign of aggressive buyers or FOMO.
🔄 2. Key Structure Zones:
🔵 Demand Zones (Highlighted in Green):
Around 113,700–114,000 → fresh demand zone after last breakout.
Around 108,000–110,000 → mid-level zone from earlier accumulation.
Deeper zone at ~96,000–98,000 → higher timeframe demand (may hold if larger correction happens).
🔴 Supply Zones (No immediate supply shown, but...)
Watch for reaction zones around 118,000–120,000 as psychological resistance.
📍 3. Price Action & Structure:
The current move is parabolic, indicating momentum exhaustion may soon follow.
However, the last CHoCH and BOS signals are clearly bullish, and pullbacks are being aggressively bought.
Short-Term Expectation:
A correction or sideways consolidation may happen near 118,000–119,000.
Best scenario: price pulls back into the 113,700 zone, forming a bullish continuation setup.
🔍 4. Candlestick Patterns:
At the top, the last 2 candles are showing wicks, indicating possible early rejection or take-profit activity.
No confirmed reversal pattern yet (e.g., no bearish engulfing, pin bar, or evening star).
Wait for confirmation if considering a reversal trade.
📉 5. Risk Zones:
If price breaks below 113,700, then correction may deepen toward 110,000 or even 108,000.
Below 108,000 would invalidate the current short-term bullish structure and signal trend weakening.
📌 6. Key Levels to Watch:
Type Price Zone Notes
Resistance 118,500–120,000 Current high zone, psychological barrier
Demand Zone 1 113,700–114,000 Nearest fresh demand
Demand Zone 2 108,000–110,000 Mid support
HTF Demand ~96,000–98,000 Deep liquidity + structural demand
✅ Conclusion:
Market is in a strong bullish trend on the 4H chart.
Wait for a healthy pullback to demand zones before considering new longs.
Watch for bearish candlestick confirmation (like engulfing or M-structure) near highs for possible short-term reversals.
⚠️ Disclaimer:
This is not financial advice or a trading signal.
It's purely educational analysis.
Always trade based on your personal strategy and risk management. BITGET:BTCUSDT.P

DeGRAM | BTCUSD got out from the triangle📊 Technical Analysis
● Price reclaimed the purple 2-month trend cap and has “fixed” above the 107 k former supply, turning it into support; this validates the grey ascending triangle whose base lies on the channel mid-line.
● Triangle height and prior swing grid point to 112 k first, then the 114.9 k May high just beneath the channel ceiling. Invalid if candles sink back below 107 k.
💡 Fundamental Analysis
● Spot-ETF desks added >9 800 BTC since Friday while on-chain miner reserves stabilised, suggesting dwindling sell pressure just as U.S. CPI relief is lifting real-yield headwinds.
✨ Summary
Long 107–108 k; breakout >112 k opens 114.9 k. Bull view void on 4 h close <107 k.
-------------------
Share your opinion in the comments and support the idea with a like. Thanks for your support!

Bitcoin Rejected at Resistance – Sideways Trap Now Likely⚠️🚫 Bitcoin Rejected at $111,592 – Smart Money Took Profits, Not FOMO 💰📉
We called it yesterday. I urgently posted about the $111,592 level — one of the most important resistance zones in this structure. And right on schedule… Bitcoin tagged it and got rejected.
📍 This isn’t just luck. It’s structure + timing + discipline.
🔄 While many were eyeing a breakout, we were preparing for the expected rejection — and we took profits after long entries from just under $100K (as shown). This wasn’t the time to FOMO. This was the time to cash in.
🔎 Key Points from Today’s Market View:
We’re still inside the ascending channel, but testing the upper end
Multiple divergences on the 2-day chart are still active (8 counted). Many more across big timeframes.
The third macro resistance test is inbound — watch the 'where can Bitcoin go post below'
Current outlook favors a sideways chop — the classic liquidation zone where longs and shorts alike get punished
We might still get the breakout to $114,900 — but if that happens, it’ll come after more pain, not from clean momentum.
🧠 Bigger Picture:
If you missed the major chart update, watch:
👉 Where Can Bitcoin Go? Part 8
And if you want today’s broader outlook (including ETH, BTC.D, NASDAQ), catch the July 10th video:
👉 July 10th Market Outlook – Uncharted Waters
🗣️ Final Word:
What we’re seeing is not a breakout. Not yet.
This is a trap zone.
Discipline > Emotion.
Structure > Hope.
Profits > FOMO.
Welcome to day trading.
💬 Peanut butter Street Talk:
Presidents are out here launching meme coins. The insiders already made their billions — and they’re calling it “peanuts.”
But we don’t want to be their peanut butter.
That’s what happens when we become the exit liquidity.
They dump while we FOMO. They wait while we panic.
So don’t feed the trap. Keep your edge sharp, your charts tighter, and your emotions in check.
I prefer to buy over 115k, over resistance or lower at support.
Not today,
The FXPROFESSOR 💙
Disclosure: I am happy to be part of the Trade Nation's Influencer program and receive a monthly fee for using their TradingView charts in my analysis. Awesome broker, where the trader really comes first! 🌟🤝📈

TradeCityPro | Bitcoin Daily Analysis #119👋 Welcome to TradeCity Pro!
Let’s go over the analysis of Bitcoin and the key crypto indexes. As usual, in this analysis I’m going to review the futures triggers for the New York session.
⏳ 1-Hour Timeframe
Yesterday, the price broke out of the range box between 108619 and 110256 that I had marked for you, and with the heavy selling volume that entered the market, this bearish move took place.
✔️ This move continued to the 107448 zone, and as you can see, we are now in a consolidation and rest phase, and once again the volume has dropped significantly.
✨ As I mentioned in yesterday’s analysis, I believe this low volume will persist through the weekend, and for a solid move to happen, we’ll need to wait for the new week to begin.
💥 For now, the price has room to move up to 108619 and perform a retracement. A break above the 50 zone on the RSI greatly increases the likelihood of this move.
📊 If selling volume re-enters the market and the price moves downward, the short trigger we have is the 107448 level, and breaking it could start the next bearish leg.
📈 For a long position, the price must first stabilize above 108619, and then, if we see that buying volume continues and increases, we can enter a long position. The main trigger will be 110256.
⭐ I myself won’t be opening any positions for now and will wait until the market shows some proper volume and trend before entering. If you plan to open a position based on these triggers, I suggest you take on very little risk so that in case your stop-loss is hit, you don’t lose much money.
👑 BTC.D Analysis
Let’s look at Bitcoin dominance. Yesterday, dominance touched the trendline I had marked and is still dealing with this dynamic resistance.
💫 A bottom has formed at 65.38. If this bottom is broken, we’ll get confirmation of rejection from the trendline, and dominance could have a bearish move down to 65.04.
⚡️ If the trendline is broken instead, we’ll have a new trigger at 65.52, and breaking it would confirm a bullish reversal in dominance. The main trigger will still be a break of 65.64.
📅 Total2 Analysis
Now let’s move on to Total2. This index dropped to the 1.13 zone and has now pulled back to 1.14. It seems like it’s getting ready for another downward move.
☘️ If Bitcoin dominance gets rejected from the trendline and moves down, and if Bitcoin moves upward, Total2 could make a very sharp move.
🔑 Even if Bitcoin drops, Total2 might range or even move up. For now, our short trigger is 1.13, and aside from 1.14, we don’t have any specific long trigger.
📅 USDT.D Analysis
Finally, let’s look at Tether dominance. This index made a bullish move to 4.85 after breaking 4.78 and is now in a corrective phase.
📊 If 4.85 is broken, the next bullish leg could continue up to 4.93. If a correction happens, dominance might pull back to 4.78.
❌ Disclaimer ❌
Trading futures is highly risky and dangerous. If you're not an expert, these triggers may not be suitable for you. You should first learn risk and capital management. You can also use the educational content from this channel.
Finally, these triggers reflect my personal opinions on price action, and the market may move completely against this analysis. So, do your own research before opening any position.

Bitcoin Breaks Out – Ultimate FOMO Unleashed Above $114,921🟢🚀 BREAKOUT POST
🚀🔥 Bitcoin Breaks Out – Ultimate FOMO Unleashed Above $114,921 🚀🔥
It’s happening. The breakout is real.
Bitcoin has just broken through the “HUGE-est Level EVER” — the infamous $114,921, marking the third macro test and final resistance in this structure.
This is not a small move. This is the unleashing of a new wave — the Ultimate FOMO zone is now LIVE.
📈 What Just Happened:
Third test confirmed ✅
Breakout through massive historical resistance
We are now in uncharted territory
🌪️ This Breakout Is Different:
Previous rejections (1 and 2) led to multi-week corrections
This time, price exploded through the level with force
Watch the parabola — we could be headed to the next ATH zone by end of 2025
🧠 Context:
The 2D divergences? Ignored. Structure wins.
This breakout invalidates the idea of sideways chop for now
It confirms strong bullish momentum across timeframes
⚠️ Caution Still Needed:
This move might trigger euphoric leverage — don’t be late, don’t chase blindly. Watch for a retest of the breakout zone for high-RR trades.
🧭 What To Watch Next:
Retest of 114.9K (support flip?)
New targets near 124K–128K
Long-term ATH projection still in play for late 2025
Full context in these breakdowns:
👉 Where Can Bitcoin Go? Part 8
👉 July 10th Market Outlook – Uncharted Waters
History is being written today.
One Love,
The FXPROFESSOR 💙
Disclosure: I am happy to be part of the Trade Nation's Influencer program and receive a monthly fee for using their TradingView charts in my analysis. Awesome broker, where the trader really comes first! 🌟🤝📈

BTCUSDT 4H Analysis
BTC is consolidating below the key resistance zone highlighted in red (~$109,000–$110,000).
The price continues to form higher lows, showing bullish pressure despite rejection in the red zone.
The structure resembles an ascending triangle, indicating a potential breakout.
Upside Target: ~$113,500–$114,000 if the price moves above ~$110,000 with strong volumes.
Support Zone: ~$106,000–$106,300 must hold to keep the bullish scenario intact.
If the support breaks, the price could retest ~$102,000–$103,000.
Small Insights: Repeated retests of resistance suggest that bulls are absorbing supply. A strong push above the red zone could trigger a short squeeze.
Stay alert!
BITCOIN ABOUT TO CRASH HARD!!!!? (Be careful with your longs)I am sharing with you in this video the next CRYPTOCAP:BTC important resistances and support levels.
Together with the confirmations, it is said that if triggered, Bitcoin will start crashing hard, so be careful if you have overleveraged long positions opened right now!
Remember to always trade only with professional trading strategies and tactics, and make sure that your money management is tight!

BTC Short Call!hort Call on BTC (Short-Term)
Entry: Sell 1 BTC Call @ $120,000 strike, August expiry (~4 weeks)
Premium Collected: ~$1.5K–$2K (~0.013 BTC)
Thesis: BTC is facing resistance in the $118.9K–$120K zone. While overall trend is bullish, short-term momentum may stall at new highs. A short call captures time decay, profiting if BTC consolidates or retraces.
Risks: Unlimited if BTC rallies strongly above $120K. Consider hedging with a long call at $125K strike.
Target: Keep the entire premium if BTC <= $120K at expiry.

$BTC/USDT Eyes $121KCRYPTOCAP:BTC has broken out of the descending wedge and is holding above key support around $106K.
The structure looks bullish with a potential move toward $121K (+11.24%).
As long as the price stays above the breakout zone, momentum favors the bulls.
DYOR, NFA
