BITCOIN Bitcoin and the Potential Move to $136,000 based on my price action +sma+ema advanced strategy.
Current Market Context
Bitcoin (BTC) is trading near all-time highs, recently surpassing $117,000-118000
The market is characterized by strong institutional inflows, robust ETF demand, and bullish technical momentum.
Is a Move to $136,000 Possible?
Analyst and Model Forecasts
Bitwise Asset Management and several market analysts see a 30% rally possible in July, which could push Bitcoin to the $136,000 level. This projection is based on:
Historical post-crisis rallies (average 31% gains after macro/geopolitical shocks).
Institutions buying more BTC than miners can supply.
Global rate cuts increasing liquidity and risk appetite.
Quantitative models and technical forecasters also predict a range between $136,000 and $143,000 as a potential 2025 high, with some models extending targets to $151,000 and beyond.
Other major banks and analysts (e.g., Standard Chartered, Bernstein, Fundstrat) maintain even higher year-end targets ($150,000–$200,000), but $136,000 is seen as a key intermediate technical and psychological level.
Technical Analysis
Bullish momentum is confirmed across short, medium, and long-term timeframes.
Key resistance levels to watch: $120,000 (psychological), $130,000 (round number), and $136,000 (target zone highlighted by several analysts).
Sustained trading above $112,000–$118,000 would support a move toward $130,000–$136,000, especially if ETF inflows and institutional demand remain strong.
Drivers Supporting the $136K Scenario
ETF and Institutional Inflows: Demand from US spot Bitcoin ETFs and corporate treasuries remains robust.
Macro Tailwinds: Expectations of US Federal Reserve rate cuts and a weakening dollar are fueling risk-on sentiment.
Supply Dynamics: The recent Bitcoin halving has reduced miner supply, amplifying the impact of new demand.
Technical Breakouts: Bull flag and breakout patterns suggest further upside, with $136,000 cited as a technical extension target.
Risks and Considerations
Volatility: Bitcoin remains highly volatile; sharp pullbacks are possible even in a strong uptrend.
Regulatory and Macro Risks: Changes in regulatory stance or a major shift in macro conditions could impact the trajectory.
Profit-Taking: Approaching major round numbers like $130,000 or $136,000 could trigger profit-taking and temporary corrections.
Summary Table: Bitcoin 2025 Price Targets
Source/Model 2025 Target Range $136K Move Outlook
Bitwise, Polymarket $136,000 (July 2025) High probability if current trends persist
Coinfomania AI Model Up to $143,440 $136K within model range
Investing Haven $80,840–$151,150 $136K within bullish scenario
Changelly, CoinDCX $100,000–$150,000 $136K is a key resistance
Standard Chartered $120,000–$200,000 $136K as a stepping stone
Conclusion
A move to $136,000 for Bitcoin is considered plausible in 2025 by my market structure advanced strategy , This scenario is supported by strong institutional demand, favorable macro conditions, and bullish technical patterns. However, volatility and macro/regulatory risks remain, so price action should be monitored closely as BTC approaches key resistance levels at 120k and 136k level
#bitcoin #btc
USDTBTC trade ideas

Bitcoin Breaks Out – Ultimate FOMO Unleashed Above $114,921🟢🚀 BREAKOUT POST
🚀🔥 Bitcoin Breaks Out – Ultimate FOMO Unleashed Above $114,921 🚀🔥
It’s happening. The breakout is real.
Bitcoin has just broken through the “HUGE-est Level EVER” — the infamous $114,921, marking the third macro test and final resistance in this structure.
This is not a small move. This is the unleashing of a new wave — the Ultimate FOMO zone is now LIVE.
📈 What Just Happened:
Third test confirmed ✅
Breakout through massive historical resistance
We are now in uncharted territory
🌪️ This Breakout Is Different:
Previous rejections (1 and 2) led to multi-week corrections
This time, price exploded through the level with force
Watch the parabola — we could be headed to the next ATH zone by end of 2025
🧠 Context:
The 2D divergences? Ignored. Structure wins.
This breakout invalidates the idea of sideways chop for now
It confirms strong bullish momentum across timeframes
⚠️ Caution Still Needed:
This move might trigger euphoric leverage — don’t be late, don’t chase blindly. Watch for a retest of the breakout zone for high-RR trades.
🧭 What To Watch Next:
Retest of 114.9K (support flip?)
New targets near 124K–128K
Long-term ATH projection still in play for late 2025
Full context in these breakdowns:
👉 Where Can Bitcoin Go? Part 8
👉 July 10th Market Outlook – Uncharted Waters
History is being written today.
One Love,
The FXPROFESSOR 💙
Disclosure: I am happy to be part of the Trade Nation's Influencer program and receive a monthly fee for using their TradingView charts in my analysis. Awesome broker, where the trader really comes first! 🌟🤝📈

BTCUSDT 4H Analysis
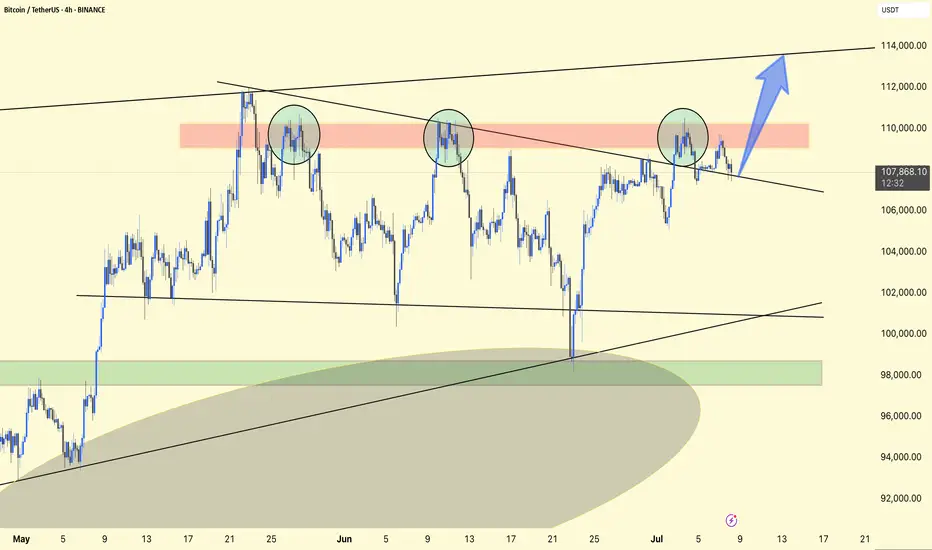
BTC is consolidating below the key resistance zone highlighted in red (~$109,000–$110,000).
The price continues to form higher lows, showing bullish pressure despite rejection in the red zone.
The structure resembles an ascending triangle, indicating a potential breakout.
Upside Target: ~$113,500–$114,000 if the price moves above ~$110,000 with strong volumes.
Support Zone: ~$106,000–$106,300 must hold to keep the bullish scenario intact.
If the support breaks, the price could retest ~$102,000–$103,000.
Small Insights: Repeated retests of resistance suggest that bulls are absorbing supply. A strong push above the red zone could trigger a short squeeze.
Stay alert!
Monday - Trade of the day Hello I took a week off from trading — life got a bit hectic 🌀. Looking back, I actually needed that break from the charts 🧠💆♂️.
But we’re back this week! Let’s see how many X’s we can cream off the market 💸🔥
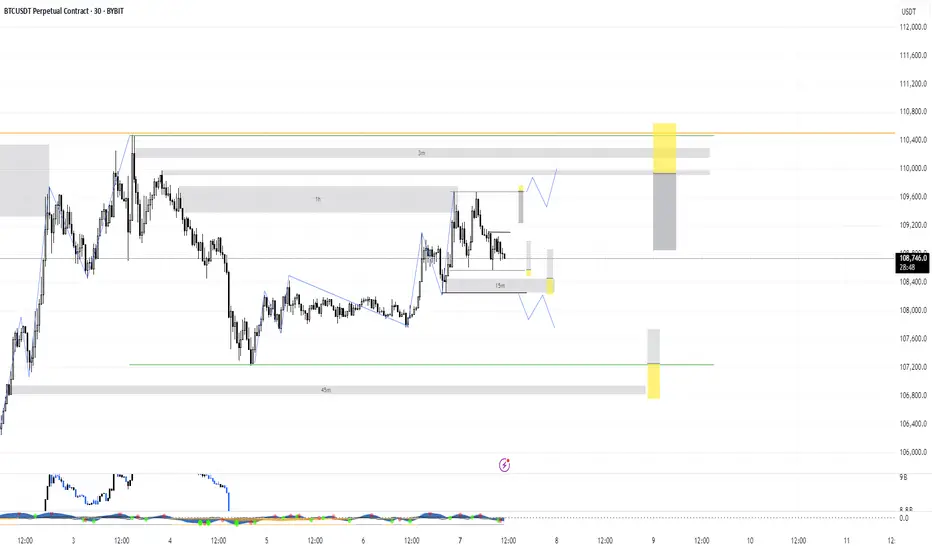
Here are the immediate levels I’m watching 👀 — mainly some range deviations from both internal and external ranges.
If we break either side of the range, I’ll be looking to enter from the last supply or demand zone for a continuation 🚀📉📈
That said, I’ll stay mindful of any supply and demand zones that could get in the way ⚠️📊
Let’s get it 💪📅
$BTC/USDT Eyes $121KCRYPTOCAP:BTC has broken out of the descending wedge and is holding above key support around $106K.
The structure looks bullish with a potential move toward $121K (+11.24%).
As long as the price stays above the breakout zone, momentum favors the bulls.
DYOR, NFA

BITCOIN ABOUT TO CRASH HARD!!!!? (Be careful with your longs)I am sharing with you in this video the next CRYPTOCAP:BTC important resistances and support levels.
Together with the confirmations, it is said that if triggered, Bitcoin will start crashing hard, so be careful if you have overleveraged long positions opened right now!
Remember to always trade only with professional trading strategies and tactics, and make sure that your money management is tight!

[SeoVereign] BITCOIN Bearish Outlook – July 6, 2025We are the SeoVereign Trading Team.
With sharp insight and precise analysis, we regularly share trading ideas on Bitcoin and other major assets—always guided by structure, sentiment, and momentum.
🔔 Follow us to never miss a market update.
🚀 Boosts provide strong motivation and drive to the SeoVereign team.
--------------------------------------------------------------------------------------------------------
Hello,
This is SeoVereign.
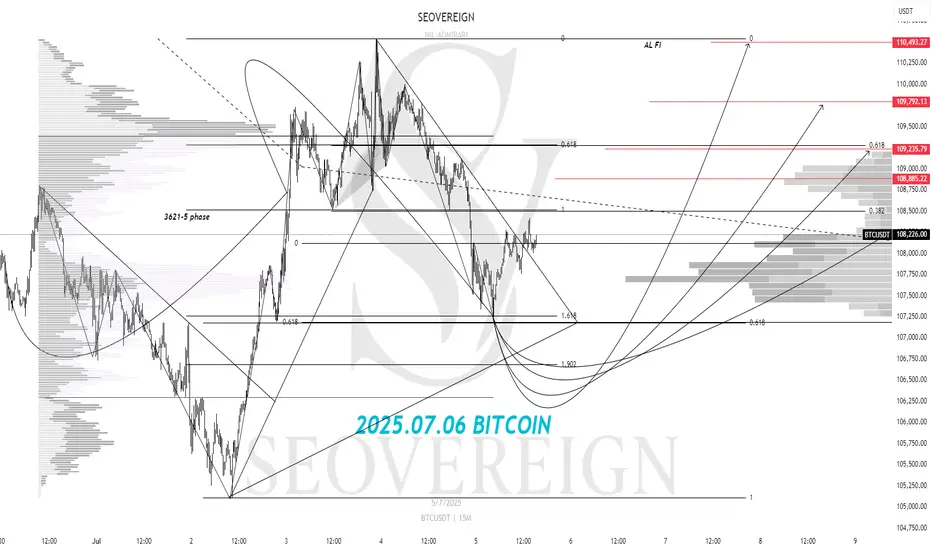
As of July 6, 2025, I present a bullish outlook on Bitcoin.
It has been a while since I last shared a long position perspective.
Those of you who have consistently followed SeoVereign’s ideas would know that, until now, most of the entry points have been centered around short positions. We have closely tracked the market, identifying opportunities amid the downtrend.
However, after comprehensively analyzing the recent overall market atmosphere, we have come to the conclusion that upward pressure is gradually increasing rather than downward pressure. After reviewing technical indicators and wave structures, we have determined that it is reasonable to consider a buy — in other words, a long position — at this stage.
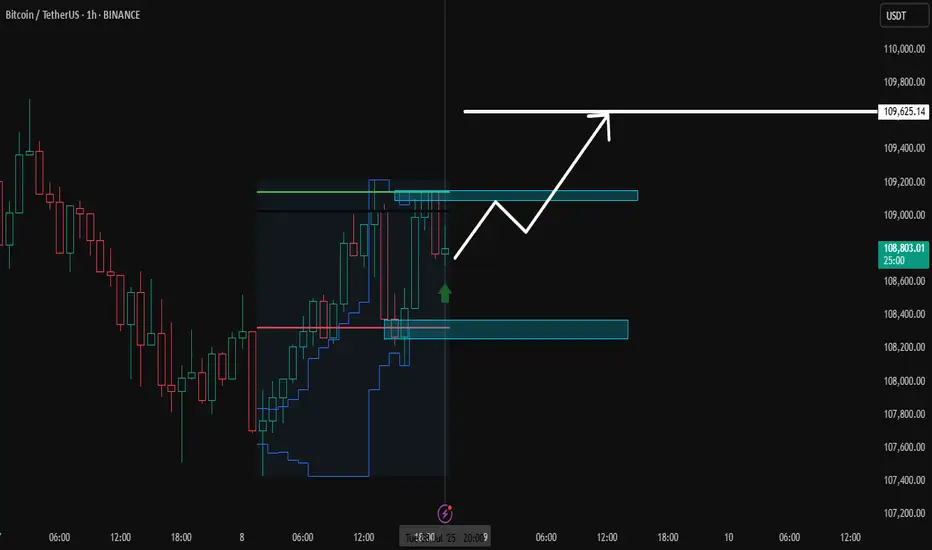
The first target for this idea is set at an average of around 109,500 . This figure is based on a comprehensive judgment that includes the current wave structure, previous key support/resistance zones, and momentum trends. Of course, this target may be flexibly adjusted depending on how the market develops, and if necessary, the rationale will be clearly revised accordingly.
As always, we will continue to track this idea and refine our logic based on the real-time developments and structures, further solidifying the grounds for the long bet.
Wishing you continued good fortune.
BTC: 650 Point Long Trade To 108,650$ (Date: Sat 05 Jul 25)High potential signal as my all signals. Don't miss this opportunity. At least open a trade in demo just to test.
Details:
Entry: Now - 108,100 $
Target Price: 108,650 $
Stop loss: 107,700 $
Trade Ideas:
There is a flag pattern here after a good down trend. So here is possibility for a small pull back till my target price.
Trade Signal:
I provide trade signals here so follow my account and you can check my previous analysis regarding BITCOIN. So don't miss trade opportunity so follow must.
BINANCE:BTCUSDT BINANCE:BTCUSDT.P BYBIT:BTCUSDT.P

Bitcoin (BTC) 4H Chart – May see new ATH SOON !!Bitcoin is currently moving tightly within a broad symmetrical wedge structure. Despite multiple fakeouts and low-conviction moves, the price has managed to stay range-bound and is holding above key support, a sign of underlying strength.
Chart Structure:
Price has broken out of the downtrend resistance but is yet to confirm momentum.
The structure suggests a larger move is imminent, with bulls gradually gaining control.
Key Levels:
Immediate Resistance: $108,700
Major Resistances Ahead: $111,862 → $116,818 → $122,341
Immediate Support: $105,189
Major Support Below: $97,205
Potential Setup:
A confirmed breakout above $108,700 with volume could initiate a rally toward the next resistance zones.
Bulls must hold the $105,000 area to avoid another deep pullback into the lower structure.
Bias:
Cautiously bullish — market is waiting for a catalyst to trigger follow-through.
Stay patient, and watch for confirmation through price and volume.
DYOR. Not financial advice.

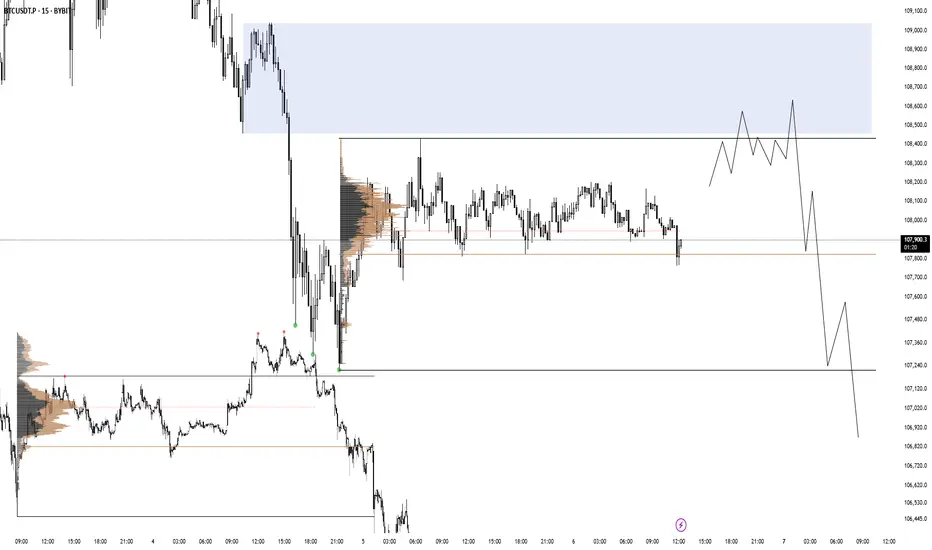
BTC 06.07.25There is a range imbalance with no price action in discount after BTC accumulated on friday afternoon. I am looking for a valid distribution like in the picture on the left.
Bitcoin will Return all-time high Interestingly Bitcoin (BTC) has not been particularly impressive over the weekend, which has been a somewhat consistent theme of the cryptocurrency market so far in the year 2025. The premier cryptocurrency continues to hover around the $108,000 mark, showing signs of indecision amongst the investors.
Resistance zone 111K
Support zone 107K
The conversation has been about when the Bitcoin price will return to its all-time high. Interestingly, the latest on-chain data shows that investors are becoming increasingly confident in the long-term promise of the flagship cryptocurrency.
Hope you can understand all our chart Pattern According the Bitcoin analysis.
Thanks for your Support.
if you found this analysis share you Opinion in comments I'm Tankful from you.

bitcoin in 1hour timeframeIn line with the previous analysis, the likely path for Bitcoin on the one-hour timeframe looks like this...follow for more...
BITCOINBITCOIN , continues to see in flow of liquidity ,investors confidence is high ,institutional adoption could change the layer of demand and supply and set a new bench mark for trading highs and low trading on intraday.
feels good to see that my correction video came 100% correct, now the confirmation will be if 108.03-107.89k will hold support. This is a classic retest to broken 4hr descending trendline ,if we adopt it ,then we buying into 111k-113k-116k watch it critically.
On a second thought if price adopt the new structure we are selling in 100k-90k and below.
trading is logical probability ,keep that in mind that every key level can be broken, manage your risk, back test on your strategy and make sure you are winning.
there are many ways to win this market without big grammar.
have a blessed new week.

Bitcoin turns bullish again | Price target = $140k++After 2 months of consolidating within a descending channel, Bitcoin has finally broken out, confirming a major technical breakout and shifting the structure back to bullish. The breakout was followed by a clean retest of the channel resistance turned support, which is now acting as a launchpad for the next leg up.
🧠 Technical Analysis:
Descending Channel Breakout: Price has convincingly broken out of the downward sloping channel, invalidating the bearish structure and flipping it bullish.
Retest Confirmation: The price is currently retesting the upper boundary of the channel — a textbook bullish retest. This confirms buyer strength and shakes out weak hands.
Liquidity Magnet Above 111k: A significant cluster of buyside liquidity sits above 111k. Once that level is breached, expect an explosive acceleration toward 120k.
Measured Move Target: Based on the height of the prior impulse (from April to May), the projected extension points to ~140k.
🌍 Macro & Sentiment Drivers:
ETF Flows & Institutional Demand: U.S. Bitcoin Spot ETFs continue to show consistent inflows, signaling strong institutional accumulation — a major shift in long-term demand.
Fed Pivot Speculation: Expectations for a Fed rate cut later in 2025 are building. Lower interest rates could fuel risk-on sentiment, pushing capital back into crypto.
Big Beautiful Bill: This bill is expected to inject money into the economy, increasing liquidity — ultimately going into crypto. This bill will be signed into law today.
Bullish crypto developments: Settlement of the XRP SEC case, spot crypto ETFs, mainstream crypto adoptions, etc. will all contribute to the bullish sentiment.
🧩 Final Thoughts:
This setup combines strong technical structure, favorable macro tailwinds, and clear liquidity targets. The coming days are critical — if Bitcoin clears 111k cleanly, it could trigger a short squeeze and FOMO-driven rally straight into 120k.

BTC ALL SET FOR MAJOR HIGHS The price has tested the resistance line multiple times showing strong supply/resistance. Buyers are gradually pushing price higher (higher lows), but momentum is weakening near resistance.
This is a sign of consolidation under resistance pattern before breakout .Rising wedge typically breaks down signaling a potential drop, it confirms weakening momentum.
Area to Watch for Entry
103000-104000 (recent demand zone) for Bullish
After daily candle closes above 113000 instant bullish Entry.

BTC is sitting on a volcanoStrong resistance at 110k and things couldn't get hotter for BTC esp. with the President pumping it and profiting from all of this (ethics 101). Let's recap: yields going up, economy is cooling (S&P going up for a week is not a reflection of things getting better), high interest rates, ultra high historical multiples, tariffs and higher debt, which are inflationary are all in front of us. This is not sustainable, a correction will happen very soon and people could get wiped out.
Always do your own due diligence and best of luck! Profit takers and crypto bros will start selling real soon, just like every other time before.

BTC - PATH to 110.5KSOO the Liquid moves or news moves made it ecstatic and so is the top move, close below 107,990 in 1H will nullify this, else yet another squeeze coming!

Trading plan for BitcoinLast week, price action followed our bullish (green) scenario perfectly. Currently, the chart shows a clearly defined narrowing triangle. A breakout of the trendline will confirm the next directional move. We still have potential for new ATHs, though a corrective pullback might come first. More details in the video itself - enjoy watching!
As always, manage your risk wisely.

Down for BitcoinHi traders,
Last week Bitcoin finished the correction down and went up again.
But this does not look like an impulse wave.
At the moment there's a small correction up so we could see another move down.
Let's see what the market does and react.
Trade idea: Wait for a change in orderflow to bearish and a correction up on a lower timeframe to trade shorts.
If you want to learn more about trading FVG's with wave analysis, please make sure to follow me.
This shared post is only my point of view on what could be the next move in this pair based on my analysis.
Don't be emotional, just trade your plan!
Eduwave

Bitcoin & new rallyBitcoin surpassed its previous all-time high of $112,000 and is now approaching $124,700, the third resistance level for July's pivot.

"Bitcoin, after breaking the resistance at $110,000"Bitcoin, after breaking the resistance at $110,000, could target $115,000 and $120,000 in the next steps."

waiting for new ATH this week , btc💎 BTC PLAN UPDATE FOR THE BEGINNING OF THE WEEK (07/07)
NOTABLE BITCOIN NEWS: Focus on 4 key points today
1. Elon Musk – “America Party” to Support Bitcoin
Elon Musk has confirmed that his newly formed political party, the “America Party,” will support Bitcoin, stating that “fiat is hopeless.”
2. Cup-and-Handle Pattern Analysis: Targeting $230K
According to technical analysis by Cointelegraph, BTC is forming a “cup and handle” pattern on the monthly chart, which could lead to a target peak of $230,000 if a breakout continues.
3. BTC Price Holds Steady Around $109K Amid “Crypto Week” and Trade Tensions
Bitcoin is currently trading around $109,000, influenced by “Crypto Week” and concerns over U.S. tariffs.
4. Institutional Inflows Increase, But Market Demand Weakens
According to CoinDesk, institutional investors are still buying BTC, but not enough to offset declining demand in the spot market, negatively affecting short-term market sentiment.
⸻
TECHNICAL ANALYSIS PERSPECTIVE
The short-term trend remains bullish. However, the steep slope of the trend indicates buying pressure is still being contested and unstable.
BTC remains stuck at Fibonacci levels—pay close attention to the resistance zones at 112K and 115K. If these two resistance levels are broken, investors may get the answer to whether BTC can approach the 120K level.
In the short term, both gold and BTC are moving sideways, indicating that market liquidity and investor capital are unstable and being divided across multiple portfolios.
==> This analysis is for reference only. Wishing all investors successful trading!

BTC/USDT — New Local High, Trendline BrokenBitcoin has officially broken out of a descending trendline and just made a new local ATH, flipping key resistance into support.
Structure:
Descending wedge breakout
Clean move above 111.8K zone
Confirmation pending with retest
Strategy:
Wait for the retest of the breakout zone for ideal entry.
Entry: 110.5K – 111.2K (on confirmation)
Stop Loss: 108.5K
Targets:
113.5K (minor)
116.8K
122.3K
Expected Move: ~10%–12% upside
BTC continues to show strength, and the breakout confirms bullish momentum. This is the Ideal time to watch for long entries on pullbacks.
DYOR | Not financial advice
