BTCUSD – Is This the Macro Top? Sell?This analysis is based on a convergence of classic technical signals, structural wave counts, and institutional order flow. Together, they strongly suggest that we may be witnessing a macro distribution phase, possibly leading into a larger correction.
1. Elliott Wave Count (Supercycle and Cycle Degree)
-Clear channel from 2018–2025 defining the entire impulsive structure.
-Final wave V is subdivided into five minor waves, with the fifth showing characteristics of an ending diagonal (low momentum, overlapping waves).
-Sructure is consistent with terminal wave exhaustion, including a false breakout and multiple rejections.
2. Volume Profile and Institutional Flow
-High-volume nodes at the top (Coinbase/Binance) align with historical distribution zones, not accumulation.
-Likely OTC activity as smart money exits quietly near all-time highs.
-VPVR shows major support clusters far below current levels (100k–88k), highlighting inefficient price zones above.
3. Weekly Technical Indicators
-RSI (classic and McAfee-based): long-term bearish divergence vs price.
-Stochastic RSI: extended overbought conditions; full cycles often reverse from this zone.
-MFI (Money Flow Index): >80 — historically precedes top formation in BTC.
-MACD: approaching a potential bearish cross in the coming weeks.
-WaveTrend Oscillator: peaking — behavior matches major tops in 2021 and 2017.
4. Moving Averages & Structural Support
-EMA21 (Weekly): ~96k — likely target for wave A of a corrective phase.
-EMA50: ~87k — coincides with cluster of historical buying interest.
-EMA100/200: ~68k and ~50k — long-term value zones if correction deepens.
5. Pivot Levels & Price Structure
-Price reached R1 (112,400) and is showing rejection — classic pivot reversal behavior.
-S1/S2 (~100–92k): probable short-term correction zones.
-S3/S4 (<88k): targets for deeper wave C or end of macro correction.
6. Institutional Behavior & Sentiment
-Large buying volume at the highs does not represent breakout momentum — likely retail absorption of institutional selling.
-Momentum divergence and false breakout behavior reinforce the distribution thesis.
-Sentiment: overly bullish news and euphoria align with classic retail top behavior.
Conclusion
This confluence of Elliott Wave structure, volume profile, indicator exhaustion, and institutional flow activity points to a high-probability macro top in Bitcoin. While no analysis is infallible, the alignment of so many signals is rare and demands attention.
Disclaimer:
This is not a recommendation to sell. This is a technical analysis intended purely for educational and analytical purposes.
USDTBTC trade ideas

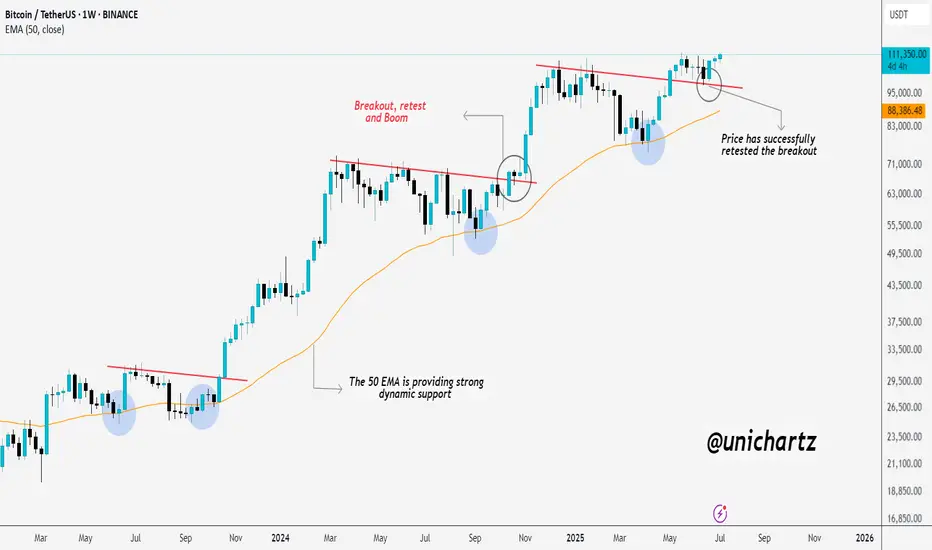
50 EMA Magic: Bitcoin Explodes After Perfect Retest!CRYPTOCAP:BTC just made a new All-Time High (ATH) — exactly as mentioned!
It broke out, retested perfectly, and blasted off.
The 50 EMA is acting like a rocket launchpad, giving price solid support every time.
Bitcoin (BTC): Bullish as Long as Buyers Hold EMAs | $112K Next?Bitcoin buyers have taken full control since bouncing from EMAs on the 2nd of July (where also our entry point was sitting last week).
Since then we have seen decent buyside dominance and we are looking for further pressure from buyers, which would result in a retest of the current ATH area, but keep in mind—we are in a very dangerous zone (near a new ATH where buyers are still showing dominance which is giving us a sign that this is not yet the full potential of the coin).
We are bullish as long as we are above the EMAs!
Swallow Academy

bitcoin long trade setup ALL trading ideas have entry point + stop loss + take profit + Risk level.
hello Traders, here is the full analysis for this pair, let me know in the comment section below if you have any questions, the entry will be taken only if all rules of the strategies will be satisfied. I suggest you keep this pair on your watchlist and see if the rules of your strategy are satisfied. Please also refer to the Important Risk Notice linked below.
Disclaimer

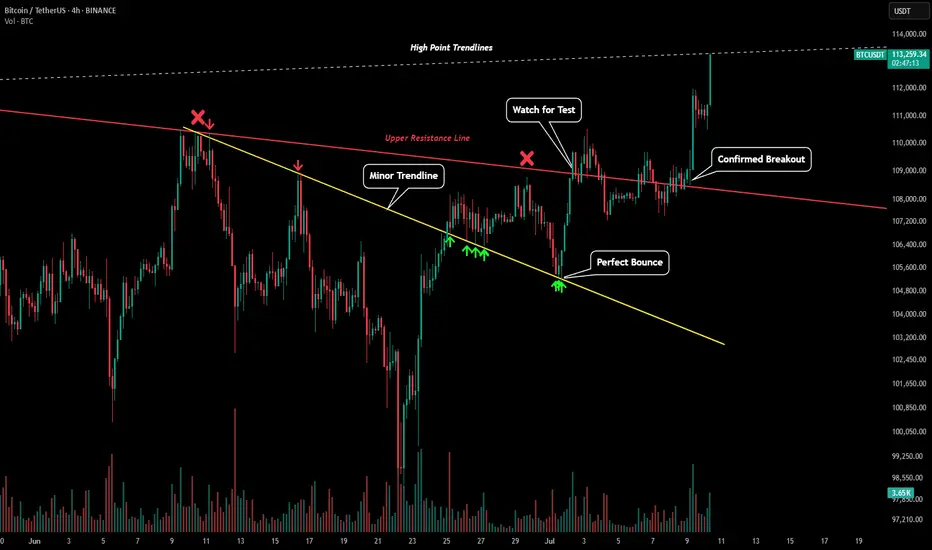
BTC - ATH After Perfect PredictionPlease refer to our previous post:
After a picture perfect test of our lower trendline of support price rallied back to our red trendline.
Price chopped back and forth around this trendline for a few days before finally confirming the breakout. Now BTC has hit a new all time high and is currently at our white upper high point trendline. Looking for confirmation closes above to continue the rally.
Bitcoin Breaks Out — Major Momentum ShiftBTC/USDT has officially broken out of the descending channel it was consolidating in for over a month. The breakout was strong, clearing the horizontal resistance at $111,862, flipping it into support.
Chart Structure:
Descending channel broken to the upside
Horizontal resistance is flipped to support
Volume confirmed breakout momentum
Key Levels:
Support: $111,862 → Newly flipped support
Resistance Zones Ahead:
$116,818
$122,342
Upside Targets:
Immediate: $116,818
Extended: $122,342
Caution: Avoid FOMO. Wait for a retest near $111,800–$112,200 to confirm breakout strength.
Bias: Bullish
Timeframe: 4H
Wait for confirmation before fresh entries.
DYOR | Not financial advice
#BTC #Bitcoin

#BTCUSDT: First $120,000 Then $140,000 Swing Move.Bitcoin has accumulated successfully and is currently on the verge of entering the next price zone, which is 120k, followed by 150k. There’s only one entry zone to consider. We’re confident that the price will move as planned, but it’s not guaranteed. Before taking entry, please conduct your own analysis.
If you like our work, please like, comment, and share.
Team Setupsfx_
❤️🚀

Master the Trio => to Level Up Your Trading🧠Most traders obsess over chart patterns and price action—but lasting success comes from mastering three pillars together:
Technical Analysis. Risk Management. Trading Psychology.
Miss one, and the structure collapses.
Let’s dive into each one, and see how they work together like a high-performance trading engine:
📈 1. Technical Analysis – Think in Layers, Not Lines
Most traders draw lines. Great traders read behavior.
Instead of asking “Is this support holding?”, ask “Why would smart money defend this level?”
Markets aren’t driven by lines—they’re driven by liquidity, trapped traders, and imbalances. That’s why:
A fakeout isn’t failure—it’s often a feature.
A breakout isn’t a buy signal—it’s bait.
Trendlines aren’t magic—they’re just visualizations of collective bias.
🔍 Advanced tip: When analyzing a chart, map out:
Where liquidity is resting (above equal highs/lows, tight consolidations)
Who’s likely trapped (late buyers at resistance, early sellers during accumulation)
Where the market must not go if your bias is correct (invalidations)
The real edge? Seeing the chart as a battle of intentions, not just candles.
🛡️ 2. Risk Management – Your License to Play the Game
Every trade is a bet. But without proper risk, it’s a gamble.
Risk management isn’t just about stop losses—it’s about position sizing, asymmetry, and survival.
I risk no more than 1% per trade , regardless of conviction.
I aim for 2R minimum —because even with a 50% win rate, I still grow.
I define my invalidation before I enter, never after.
You can’t control the outcome, but you can control your exposure. That’s professional.
🧠 3. Trading Psychology – Where Most Traders Break
You can have the perfect setup and smart risk, but still sabotage yourself.
Why? Because emotion overrides logic —especially when money is on the line.
Ever moved your stop? Chased a candle? Closed a trade too early, only to see it hit your TP later?
That’s not lack of skill—it’s lack of emotional discipline.
What works for me:
Journaling every trade—not just the result, but how I felt
Practicing “sit tight” discipline after entries
Reminding myself that no single trade matters—only the process does
You don’t trade the chart—you trade your beliefs about the chart. Master yourself first.
🔄 Final Thoughts
Trading isn’t just about entries.
It’s a mental game played on financial charts, where edge lies in understanding market mechanics, protecting capital, and staying emotionally grounded.
TA shows you the “what”
Risk shows you the “how much”
Psychology decides the “how well”
Master all three—and you’ll separate yourself from 95% of traders.
💬 Which of the three is your strongest? And which one needs more work?
Let’s grow together—drop your thoughts in the comments 👇
All Strategies Are Good; If Managed Properly!
~Richard Nasr

[SeoVereign] BITCOIN Bearish Outlook – July 9, 2025We are the SeoVereign Trading Team.
With sharp insight and precise analysis, we regularly share trading ideas on Bitcoin and other major assets—always guided by structure, sentiment, and momentum.
🔔 Follow us to never miss a market update.
🚀 Boosts provide strong motivation and drive to the SeoVereign team.
--------------------------------------------------------------------------------------------------------
Hello.
This is SeoVereign.
As of July 9, 2025, I present a bullish outlook on Bitcoin.
This idea is an extension of the analysis posted on July 6.
Therefore, it will be easier to understand this analysis if you first read the July 6 idea.
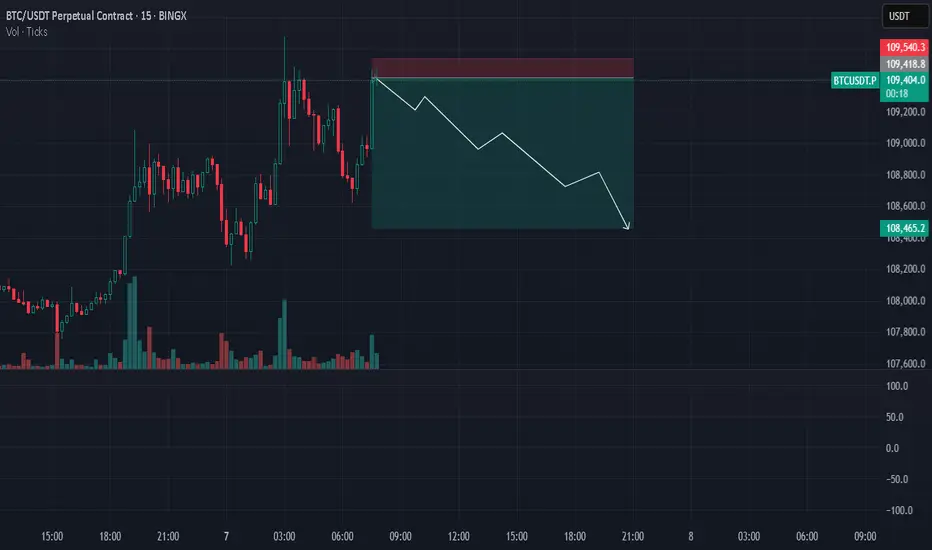
The position reached the second target price and then showed a downward movement.
In this idea, harmonic 0.382 and 1.618 patterns have been additionally identified, and accordingly, I plan to continue holding the long position entered from the July 6 entry point.
The average target price has been set around 109,150 KRW.
I will continue to track the situation, clarify the rationale, and provide updates through this post.
Wishing you continued good fortune.
Sincerely,
SeoVereign

Bitcoin overall: likely still headed down for time beingI expect a short move up followed by a bigger retracement. While I’d try a long at the lower indicated range, a move further, below it, is certainly possible.

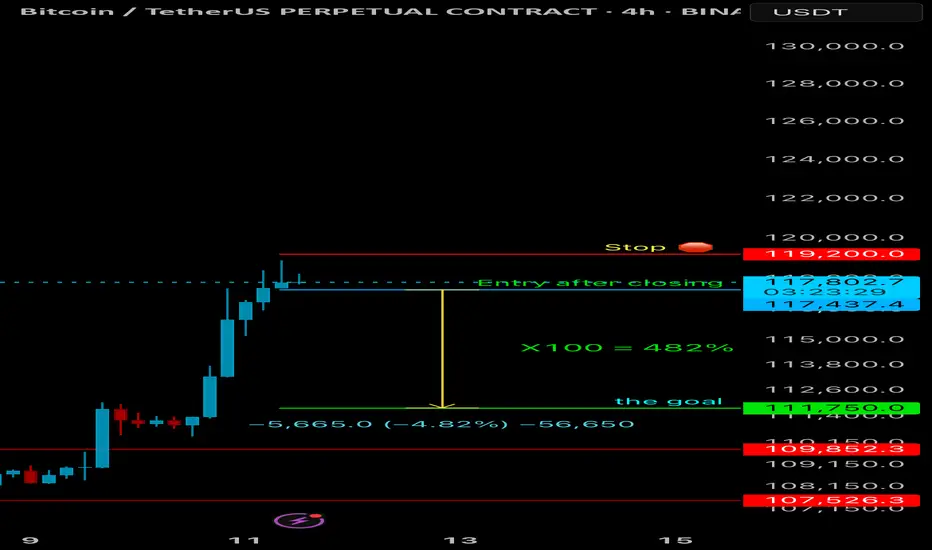
BTCQuick trade. I hope everyone manages their risk and enters after the close. 4-hour time frame. Leverage from 10 to 100.
Bitcoin BTC Trade Plan: Watching for Breakout or Pullback Entry📊 Currently watching BTC (Bitcoin) as price action remains bullish overall, but we're approaching a key decision point 🎯
💹 Price is pushing higher, but with some signs of exhaustion after the recent rally ⚠️ — and with the weekend approaching, we could either see a continuation higher or a healthy pullback
I’m keeping an eye on two potential trade scenarios:
1️⃣ A break and clean retest of the recent high, which could offer a continuation long if momentum follows through 🚀
2️⃣ A retracement into equilibrium — a deeper pullback toward fair value 📉 — which could also present a high-probability long setup if confirmed with structure and reaction 📈
Either way, I’m letting the market reveal its hand and waiting for one of these setups to play out before committing 💡
💬 Not financial advice — always assess your own risk and confirm with your own analysis.

#BTC/USDT Bitcoin Recovers Above 108,000 $#BTC
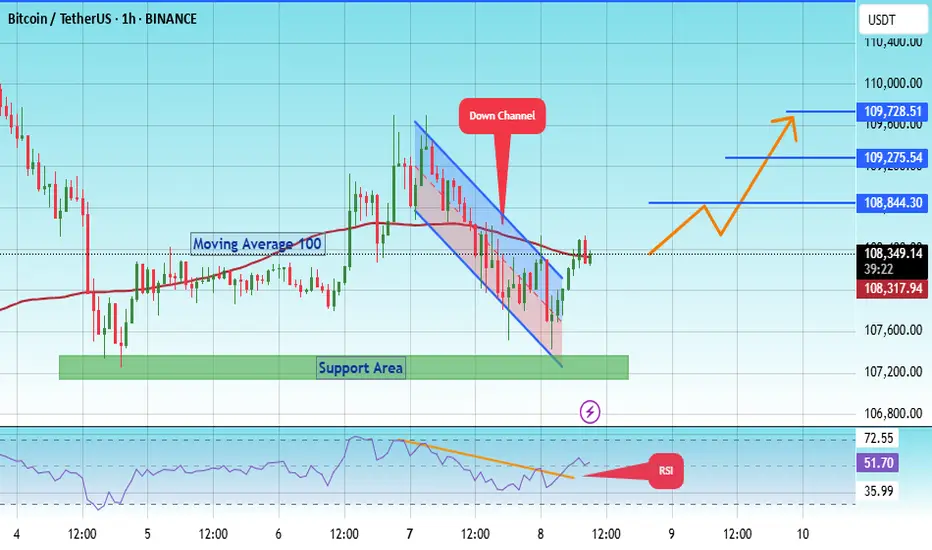
The price is moving within a descending channel on the 1-hour frame, adhering well to it, and is on its way to breaking it strongly upwards and retesting it.
We are seeing a bounce from the lower boundary of the descending channel. This support is at 107600.
We have a downtrend on the RSI indicator that is about to break and retest, supporting the upside.
There is a major support area in green at 107217, which represents a strong basis for the upside.
Don't forget a simple thing: ease and capital.
When you reach the first target, save some money and then change your stop-loss order to an entry order.
For inquiries, please leave a comment.
We are looking to hold above the Moving Average 100.
Entry price: 108337.
First target: 108844.
Second target: 109275.
Third target: 109728.
Don't forget a simple thing: ease and capital.
When you reach the first target, save some money and then change your stop-loss order to an entry order.
For inquiries, please leave a comment.
Thank you.
BTC Leg2 115KBINANCE:BTCUSDT major movement from base 98K S to 106K $.BTC want to next movement to 115K $ but in middle of way 110K $ level there are sellers.
Support: 106.000 - 102.000
Resistance: 110.400 - 115.000
⚠️Control Risk Management

Bitcoin turns bullish again | Price target = $140k++After 2 months of consolidating within a descending channel, Bitcoin has finally broken out, confirming a major technical breakout and shifting the structure back to bullish. The breakout was followed by a clean retest of the channel resistance turned support, which is now acting as a launchpad for the next leg up.
🧠 Technical Analysis:
Descending Channel Breakout: Price has convincingly broken out of the downward sloping channel, invalidating the bearish structure and flipping it bullish.
Retest Confirmation: The price is currently retesting the upper boundary of the channel — a textbook bullish retest. This confirms buyer strength and shakes out weak hands.
Liquidity Magnet Above 111k: A significant cluster of buyside liquidity sits above 111k. Once that level is breached, expect an explosive acceleration toward 120k.
Measured Move Target: Based on the height of the prior impulse (from April to May), the projected extension points to ~140k.
🌍 Macro & Sentiment Drivers:
ETF Flows & Institutional Demand: U.S. Bitcoin Spot ETFs continue to show consistent inflows, signaling strong institutional accumulation — a major shift in long-term demand.
Fed Pivot Speculation: Expectations for a Fed rate cut later in 2025 are building. Lower interest rates could fuel risk-on sentiment, pushing capital back into crypto.
Big Beautiful Bill: This bill is expected to inject money into the economy, increasing liquidity — ultimately going into crypto. This bill will be signed into law today.
Bullish crypto developments: Settlement of the XRP SEC case, spot crypto ETFs, mainstream crypto adoptions, etc. will all contribute to the bullish sentiment.
🧩 Final Thoughts:
This setup combines strong technical structure, favorable macro tailwinds, and clear liquidity targets. The coming days are critical — if Bitcoin clears 111k cleanly, it could trigger a short squeeze and FOMO-driven rally straight into 120k.

Bitcoin (BTC): Targeting $120K | Buyers Showing DominanceBitcoin is hovering still in between the old ATH area and the new, entering into a consolidation zone, which might be our breaking point.
Last week we saw the buyside dominance, which was backed by big institutions buy orders and short-term traders selling assets, giving us a sign of a potential bullish breakout—that's what we are looking for, a proper breakout from local resistance, which would then send the price towards our first target of $120K.
Swallow Academy

BTCUSDTWait for breaked ATH for 115K target.
BINANCE:BTCUSDT.P
Now price is in two level trading renge but come entry volume of buyers.

Bitcoin Trading Update:From the current market position at 102,663.96, Bitcoin is poised within a key price range. As per your outlined strategy, you're targeting a potential 4.71% drop to the mitigation block at 97,911. This level serves as a critical zone for price action, which could offer an opportunity for a potential reversal or continuation.
Key Levels:
Dealing Range High: 117,900
Mitigation Block: 97,911
Current Price: 102,663.96
Potential Drop: 4.71% to the mitigation block
Price Target (TP):
From the mitigation block at 97,911, the target suggests a 20% potential gain as the price moves toward the upper boundary of the dealing range at 117,900.
Key Observations:
Risk/Reward Ratio: The setup shows a favorable Risk/Reward ratio of 4.75, which aligns with a solid risk management strategy, especially considering the potential for a 20% gain from the mitigation block to the dealing range high.
Stop Loss: The stop loss is set around 93,456.00 as per the chart, ensuring proper risk management in case the market moves against the expected setup.
Suggested Strategy:
Entry: Watch for price action near the mitigation block (97,911) for a potential entry.
Take Profit: Aim for the 117,900 level, targeting a 20% gain.
Stop Loss: Keep stop loss orders at 94,960 to protect against larger downside movement.
This setup offers an attractive risk/reward proposition, but always ensure you are actively managing the trade, especially if price approaches the mitigation block.

BTC - Fly High or Just Nuke down?As depicted earlier in the earlier drawing, 109,850 and now little bit more push to fall it down!

BTC bullish sentiment and All time highs?BTC is printing a good structure and characteristics resembling the highs of 2021. 2025 is the only bullish year left before BTC crashes again.
Usually BTC is bullish in the end of the year. This OCT/NOV could print 130K-136k for btc before a fatal crash

BITCOIN WE shared for free the strcuture of bitcoin and it came back 100% complete. On break and retest and 116k is target and 126-128k will be watched.
trading is probability and any key level can fail.
