USDTHB structure replayFirst time I forecast this exotic I believe. Instantly noticed this diagonal trend and the bearish candles for August and September '18 lookalikes. Based on this and more possibly current bullish candle to turn bearish up to 30.6, 30.2 or even all the way down to 29.7. Then a bullish candle for October and another two bearish for November and December targeting 28.55.
Thailand may see lesser US tourists already ongoing from October '15. Wasn't that when FED started printing?
Note the volumes of late '08 and '09 and now at higher levels than previous years from March '18 till date. If volume spikes like March '09 repeat this pair might hit new record lows. Even more as the diagonal downtrend may be recognised as part of a descending triangle and signal a accelerated breakdown.
UJ Seasonality agrees as USD devaluation has broken pre-covid lows back July and momentum has not signalled to reverse imho.
USDTHB trade ideas


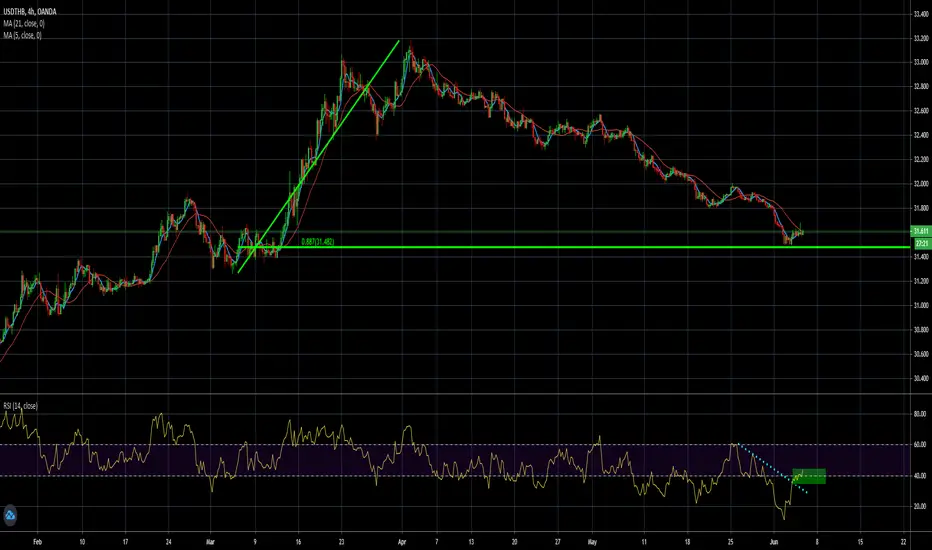
USDTHBThis set up is for a long position waiting for a break in the line to take a long after the retracement.


Dissection of Head N Shoulder Monthly ChartOn Friday we had a break and close above a downtrend that went on since the beginnings of April this year. Now this doesn't mean that price must now shoot off to the moon, this would be a much greater certainty once price manages to, if it ever does, do the same thing across the down trendline extending from late 2015. If anything, the level that should hold and not be revisited in years to come is the low of the Right Shoulder, subsequently if price does cross above the yellow dotted line, I would hope for price to then the last low at 30.8, for a cruise to at least the last high @33.20. Happy Trading.

Inverted HEAD N SHOULDER in the MONTLYThis is one of my favorite exotic pairs due to the technicality of the price movements it does, and I am a fan of Thailand overall. This moves has an immense potential to the upside. The downward trendline gives us a good hint at when this might develop. Follow up for further dissection of the movement.


USDTHB Long term Sell SignalPattern: Channel Down on 1W.
Signal: Bearish after a rebound is completed on the 1W MA200.
Target: 30.150 and 29.300 in extension.
** Please support this idea with your likes and comments, it is the best way to keep it relevant and support me. **


THB will be weak or strong against USD?Main direction of THB which we expect to be weaker compared against USD. It might pull back to test the lower line of channel again.

USDTHB Buy Limit - Entry 13.95Stop Loss = 31.65 / Take Profit = 32.55 > Coupled with a 1% risk and 2% reward.
Once the trade reaches a 1:1 point move SL in front of the entry to protect the downside.
If it takes you out we can always re enter at another opportunity.
As the trade progresses i will comment every change to show you how i make to maximize profits.
Remember Risk/Reward is the key, we will take losses along the way but overall profit in the long run.
If you enjoy follow and like my ideas and if you have questions message me.
Keep Chasing that Paper!!!


USD/THB Long Trade - Entry 33.164Stop Loss = 32.564 / Take Profit = 34.964 > Coupled with a 1% risk with 3% reward.
Once the trade reaches a 2:1 point move SL in front of opening at a 1:1 point to mitigate risk.
Keep Chasing that Paper!!!

USDTHB Potential Bullish MovementUSDTHB Potential Bullish Movement
we are waiting for a momentum candle close above 32.870 to buy this one
Reason:
1- Divergence on MACD (in red)
2- Objective Wedge (in blue)
3- Double Bottom (in purple)
Three confluences are enough to consider Buying USDTHB, after a break below 32.870 (in gray)
*unless price broke below our double bottom pattern (purple zone), then this one may resume its bearish trend.

USDTHB Trading Plan BUY - Riks Reward 1:3 - FollowTrendUSDTHB Trading Plan BUY - Riks Reward 1:3 - FollowTrend

