USOIL Double Top Breakdown | Short Setup Alert!USOIL Double Top Breakdown | Short Setup Alert!
Hey traders! A classic Double Top pattern has formed on the 4H USOIL chart (Top 1 & Top 2), signaling a potential trend reversal. After breaking the neckline, price action confirms bearish momentum. The stop-out level is clearly marked at 70.00 , while the target zone is set around 58.00. This setup offers a great risk-reward ratio.
📍 Supertrend also aligns with bearish confirmation.
💬 Drop your thoughts in the comments section – let's discuss the trade!
❤️ If you find this helpful, don’t forget to support with a like and follow!
Stay sharp and trade safe!
USDWTI trade ideas

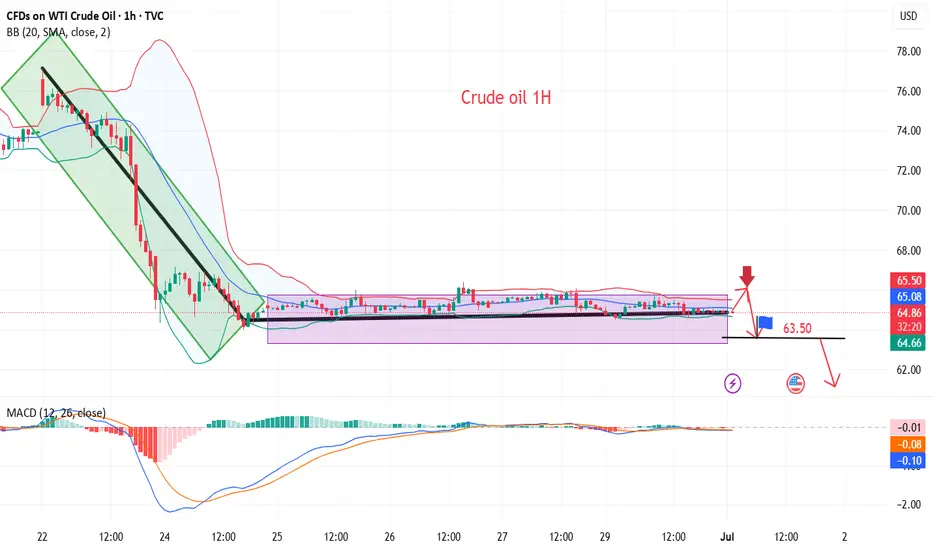
Crude oil continues to correct, short-term ideas
💡Message Strategy
WTI crude oil prices recovered from a two-week low but remained about $12 below the previous Monday's high as upside was limited by Middle East peace and expectations that OPEC+ countries will agree to increase supply again this week.
📊Technical aspects
From the daily chart level, crude oil fluctuates upward in the medium term and tests around 75. The K-line closes with a large real negative line, which has not yet destroyed the moving average system and is still supported. The medium-term objective upward trend remains unchanged.
However, from the perspective of momentum, the MACD indicator crosses downward above the zero axis, indicating that the bullish momentum is weakening. It is expected that the medium-term trend of crude oil will fall into a high-level oscillation pattern.
The short-term trend of crude oil (1H) continues to fluctuate in a narrow range, and the oil price falls back to the lower edge of the range. Pay attention to the support strength of 64. In terms of momentum, the MACD indicator is at the zero axis position, and the long and short forces are equal. It is expected that the trend of crude oil will maintain a fluctuating consolidation pattern during the day.
💰Strategy Package
Short Position:65.50-66.50,SL:67.50,Target: 64.00-63.00
WTI Surge Incoming? $67 Base Could Launch Prices Toward $86Wavervanir_Intl created with TradingView.com, Jul 02, 2025 12:27 UTC‑7
CFDs on WTI Crude Oil · 1h · TVC 67.26 H67.41 L67.26 C67.27 +0.02 (+0.02%)
---
**🎯 Short‑Term Outlook (1 h)**
• Price rebounding from demand zone at $64.15 & equilibrium
• Break of 0.447–0.5 fib (~65.30–66.48) → targeting 70.00 then 72.82
• Entry: 67.30–67.50 | SL: <65.50 | TP1: 70.00 | TP2: 72.80
**📊 Mid‑Term (Daily/Weekly)**
• Weekly Heikin‑Ashi confirms bullish reversal, testing long-term resistance near $74–76
• Breakout clears range → potential extension to $86 (1.382 fib)
• If rejected → expect pullback to 67–70 base zone
**⚠️ Macro Catalysts & Risk**
• Bullish from inventory draws & Middle East tensions
• Upcoming OPEC+ July 6 meeting could shift supply dynamics
**🏁 Summary**
- Play for short‑term lift to fib targets
- Monitor mid‑term breakout above ~$75.60 for extended rally
- Place stops below structured support for controlled risk
Stay agile—conditions remain fluid with macro implications in control.
#Oil #WTI #Fib #Demand #Supply #OPEC #WaverVanir

Market next move 🔄 Disruption Analysis: Contrarian View
⚠️ Original Viewpoint Summary:
The original analysis suggests a bearish breakdown from the rising channel, with a short-term target of 64.36, pointing to a move towards the support zone.
---
📉 Disrupted (Contrarian) Perspective:
🔁 Fakeout Scenario Possibility:
The sharp drop below the trendline may be a bear trap.
Price quickly bounced back into the channel region, showing buyer interest near the support.
🔎 Key Observations:
Wick rejection near the lower support suggests that demand is active around 64.50–64.36 zone.
The structure of higher lows is still valid unless there's a confirmed close below the support box.
Momentum indicators (not shown) may help validate whether this is a temporary pullback or a deeper correction.
📈 Alternative Projection:
If price holds above the support zone, it could rebound back to test 65.50–65.80 resistance.
A false breakdown followed by consolidation may lead to retest of the upper channel (near 66.00).
---
🧭 Revised Strategy Suggestion:
Avoid early shorts unless there is a confirmed candle close below 64.36.
Watch for bullish price action near support (hammer, engulfing) for a potential long re-entry.
Reevaluate if WTI forms a base around 64.40 — possible reversal setup.

Crude Oil Trades in Range with Bullish PotentialCrude Oil trades above key support at $64.6, hovering near $66.83. If buyers maintain control, the next upside target is $69.45.
However, a bearish breakdown below $62.42 would invalidate this bullish outlook.

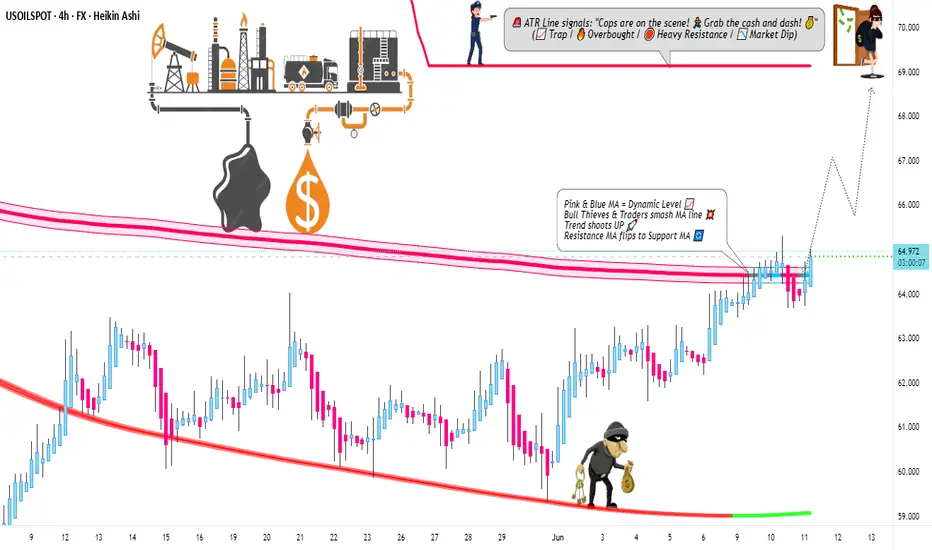
Bulls on the Loose: US Oil Spot/WTI Heist Strategy! 🚨💰 THE OIL VAULT HEIST: US OIL SPOT/WTI TRADING STRATEGY 💸🔫
🌟Hi! Hola! Ola! Bonjour! Hallo! Marhaba!🌟
Dear Money Makers & Robbers 🤑💰💸✈️
Based on our 🔥Thief Trading style analysis🔥 (both technical and fundamental), here’s the master plan to heist the US Oil Spot/WTI Energy Market. Follow the blueprint carefully—this strategy focuses on long entries, with a daring escape planned near the high-risk Red ATR line Zone where bearish robbers and consolidation traps await. 🏆💸 Take your profit and treat yourself, fellow traders—you earned it! 💪🏆🎉
🕵️♂️ Entry 📈
💥 The vault is wide open! Time to swipe that bullish loot—heist is on!
Place buy limit orders within the 15 or 30-minute timeframe, near swing lows/highs for pullback entries.
🛑 Stop Loss 🛑
📍 Thief’s SL—recent swing low and below the moving average (4H timeframe) for day/swing trades.
📍 Adjust SL based on risk, lot size, and number of orders.
🎯 Target
🏴☠️💥 69.000 (Aim for the big loot!) OR escape before the target
🔥 Market Heist Overview
The UK Oil Spot/Brent market is currently showing bullishness 🐂, driven by key factors—perfect for a day/scalping trade robbery! ☝☝☝
📰 Additional Tools & Analysis
📊 Get the Fundamental, Macro, COT Report, Quantitative Analysis, Sentiment Outlook, Intermarket Analysis, Future Targets—check our bi0 liinks 👉👉👉🔗🔗
⚠️ Trading Alert: News Releases & Position Management
📰 News can rattle the vault! 💥
✅ Avoid new trades during news releases.
✅ Use trailing stop-loss orders to protect profits.
💖 Supporting our heist plan?
💥 Smash the Boost Button 💥 to empower the robbery team.
Let’s make money every day in this market with the Thief Trading Style! 🏆💪🤝❤️🎉🚀
👀 Stay tuned for the next robbery plan, thieves! 🤑🐱👤🤗🤩
BUY OPPORTUNITY IN WTI NOW!Price dropped low and currently trade at $65.15 per barrel a buy opportunity is envisaged from the current market price. This is a potential opportunity to capitalize on. Take advantage of it

USOIL Potential UpsidesHey Traders, in tomorrow's trading session we are monitoring USOIL for a buying opportunity around 72.00 zone, USOIL is trading in an uptrend and currently is in a correction phase in which it is approaching the trend at 72 support and resistance area.
Trade safe, Joe.

WTI Oil H4 | Potential bearish reversalWTI oil (USOIL) could rise towards a pullback resistance and potentially reverse off this level to drop lower.
Sell entry is at 68.28 which is a pullback resistance.
Stop loss is at 70.90 which is a level that sits above the 50% Fibonacci retracement and a pullback resistance.
Take profit is at 63.86 which is a pullback support that aligns closely with the 161.8% Fibonacci extension.
High Risk Investment Warning
Trading Forex/CFDs on margin carries a high level of risk and may not be suitable for all investors. Leverage can work against you.
Stratos Markets Limited (tradu.com ):
CFDs are complex instruments and come with a high risk of losing money rapidly due to leverage. 63% of retail investor accounts lose money when trading CFDs with this provider. You should consider whether you understand how CFDs work and whether you can afford to take the high risk of losing your money.
Stratos Europe Ltd (tradu.com ):
CFDs are complex instruments and come with a high risk of losing money rapidly due to leverage. 63% of retail investor accounts lose money when trading CFDs with this provider. You should consider whether you understand how CFDs work and whether you can afford to take the high risk of losing your money.
Stratos Global LLC (tradu.com ):
Losses can exceed deposits.
Please be advised that the information presented on TradingView is provided to Tradu (‘Company’, ‘we’) by a third-party provider (‘TFA Global Pte Ltd’). Please be reminded that you are solely responsible for the trading decisions on your account. There is a very high degree of risk involved in trading. Any information and/or content is intended entirely for research, educational and informational purposes only and does not constitute investment or consultation advice or investment strategy. The information is not tailored to the investment needs of any specific person and therefore does not involve a consideration of any of the investment objectives, financial situation or needs of any viewer that may receive it. Kindly also note that past performance is not a reliable indicator of future results. Actual results may differ materially from those anticipated in forward-looking or past performance statements. We assume no liability as to the accuracy or completeness of any of the information and/or content provided herein and the Company cannot be held responsible for any omission, mistake nor for any loss or damage including without limitation to any loss of profit which may arise from reliance on any information supplied by TFA Global Pte Ltd.
The speaker(s) is neither an employee, agent nor representative of Tradu and is therefore acting independently. The opinions given are their own, constitute general market commentary, and do not constitute the opinion or advice of Tradu or any form of personal or investment advice. Tradu neither endorses nor guarantees offerings of third-party speakers, nor is Tradu responsible for the content, veracity or opinions of third-party speakers, presenters or participants.

OIL IDEA /30 06 25So we are looking for this Short position, but first we need a better Premium position

WTI Crude Oil sideways consolidation support at 6460Crude oil prices remain under pressure as easing geopolitical tensions between Iran and Israel reduce fears of supply disruptions in the Middle East. Adding to the bearish tone, the anticipated output increase by OPEC+—expected to raise August production by 411,000 bpd—acts as a supply-side headwind. Meanwhile, a modest rebound in the US Dollar from multi-year lows also weighs on oil demand, given its inverse relationship with USD-denominated commodities.
However, expectations that the Federal Reserve may soon resume rate cuts could limit USD upside, offering some support to oil prices. Traders are likely to stay cautious ahead of key US economic data, including Wednesday’s ADP report and Thursday’s Nonfarm Payrolls, which will shape Fed policy expectations. Additionally, the latest EIA stockpile data will be closely watched for immediate supply signals.
Conclusion:
WTI Crude Oil is likely to trade with a neutral-to-bearish bias in the near term, pressured by rising supply and a firmer dollar. However, Fed rate cut expectations and upcoming US labor and inventory data may help cushion the downside. Traders may remain on the sidelines until clearer direction emerges post-NFP and OPEC+ decisions.
Key Support and Resistance Levels
Resistance Level 1: 6925
Resistance Level 2: 7080
Resistance Level 3: 7230
Support Level 1: 6460
Support Level 2: 6300
Support Level 3: 6100
This communication is for informational purposes only and should not be viewed as any form of recommendation as to a particular course of action or as investment advice. It is not intended as an offer or solicitation for the purchase or sale of any financial instrument or as an official confirmation of any transaction. Opinions, estimates and assumptions expressed herein are made as of the date of this communication and are subject to change without notice. This communication has been prepared based upon information, including market prices, data and other information, believed to be reliable; however, Trade Nation does not warrant its completeness or accuracy. All market prices and market data contained in or attached to this communication are indicative and subject to change without notice.

WTI OIL TRADING IDEA 1 JULY 2025WTI Crude Oil is currently trading around $64.77, following a recent rejection from the $76–78 resistance zone. This area represents a strong supply zone and coincides with the upper boundary of a long-term descending channel, indicating institutional selling pressure. From a Smart Money Concepts (SMC) perspective, this move appears to be a liquidity grab above previous highs, where price tapped into a bearish order block before aggressively reversing. Price action confirms this bearish sentiment, with a visible rejection and bearish engulfing candle suggesting that sellers are defending the region aggressively.
On the supply and demand side, the $76.77–78.30 zone is the immediate supply zone, while the next key resistance above lies between $79.37 and $93.94. On the downside, demand lies at $58.69–64.00, with major demand and liquidity resting around $55.00 and $51.79. Fundamentally, the recent spike in oil prices was largely driven by heightened tensions in the Middle East, particularly renewed conflict concerns between Iran and Israel. However, as no direct disruption to oil supply has occurred, the geopolitical risk premium is now being priced out. Additionally, concerns over global demand, especially from China and Europe, along with a gradual and controlled U.S. Strategic Petroleum Reserve (SPR) refill, are putting downward pressure on prices despite OPEC+ maintaining output cuts.
Based on this analysis, the trade idea favors a bearish swing setup. A short position around $64.00–66.00 could be considered, targeting $58.69 as the first take-profit level, followed by $55.00 and $51.79 for extended targets. The stop loss should be placed just above $78.50 to allow room beyond the supply zone and trendline. This setup offers a risk-reward ratio of approximately 1:3. However, if price breaks and holds above $78.50, it may signal a structural shift toward bullish momentum, likely driven by unexpected geopolitical escalation or a change in OPEC strategy. In such a case, the bias should flip to bullish, with potential targets around $89.00–93.00.

CRUDE OIL (WTI): Technical Analysis & Important pattern to WatchHere’s my latest analysis on ⚠️USOIL price action.
The price has recently finished a correction, followed by a brief consolidation in a horizontal range and an ascending triangle pattern
A bullish breakout above the intraday resistance levels would suggest a likely end to the accumulation phase.
The chances are high that the pair is returning back to a bullish trend, with a target of 77.00.
Strong fundamentals back this bullish outlook.

Oil’s Reaction to Geopolitical DevelopmentsOil’s Reaction to Geopolitical Developments
We must be cautious when trading oil.
Despite the unexpected attack by Israel on Iran last week, gold prices did not rise beyond $77.50.
In my view, oil prices remain largely under the influence of the U.S. and OPEC+, with Trump opposing any significant price increase.
Iran ranks as one of the world's top oil producers, holding the fifth position in daily output. However, it is surprising that prices did not exceed $77.50, especially considering past instances of major price surges during the Russia-Ukraine war.
Even if oil rebounds toward $80, this movement could be purely speculative, with a high likelihood of a pullback, as indicated by the technical chart.
Key target zones: 67.00 ; 64 and 56.50
You may find more details in the chart!
Thank you and Good Luck!
❤️PS: Please support with a like or comment if you find this analysis useful for your trading day❤️

OIL Bouncing at SupportLooking for a short bounce on US Oil here after a massive sell off earlier this week when the ceasefire was announced in the middle east. Again this is a short, countertrend bounce trade . Once you get a few percent, take your profits and get out.

USOIL:Go long
usoil: Let's start with a short-term rebound.
Trading idea:
BUY@64.8-65.2
TP: 66-66.4
More detailed strategies and trading will be notified here ↗↗↗
Keep updated, come to "get" ↗↗↗

Is WW3 Coming? Crude Waves Flash Warning which I DO NOT LIKE ITI’m getting a knot in my stomach looking at this chart, it feels like a warning about what’s coming.
Chart Context
• WTI jumped from the pandemic low of 6.62 up to 131.02 on March 6, 2022.
• It then retraced to 59.86 (38 % Fib) by June 4, 2025.
• That pullback seems complete, and now price is pressing against a descending wedge.
Wave Map
• Wave 3 could extend toward 207
• A full five-wave run points up near 330
• The pattern is squeezed in a tightening channel that looks ready to break any day
Why It Feels Risky
Breaking above 200 normally requires a major supply shock—think trouble at the Strait of Hormuz, surprise OPEC cuts, or a hit to U.S. shale. The Iran–Israel cease-fire is shaky, drones are still buzzing storage sites, and even a brief chokepoint shutdown would send tanker traffic into chaos. To me, the chart is flashing that tail risk.
Trading Plan
• I’ll watch the wedge’s upper trendline around 83 for my first signal
• A weekly close above 93 would clear the path to 117, then 145
• If price closes below 51 on the week, this thesis is off
Your Thoughts?
Does this wave count make sense, or am I reading too much into it? Drop your views—especially if you’ve got the geopolitical angle covered. I hope this wave doesn’t play out, but pretending it’s not there feels reckless.
(Not financial advice)

WW3 Scenario - Bull flag potentialWe bottomed at the gap fill at $57, a long term target I had been expecting. A bullish retest at the golden pocket followed, now all we need is a clean break above $80 to end the lower high downtrend. I don't want to comment on politics, but suffice to say the price of oil will tell us what's really going on. A supply shock has the potential to send oil to the $200 level. I don't know what the world will look like in that scenario, but I can assure you it will be a global catastrophe. Inflation will reignite, the interest rates will likely go up.
This is the single most important chart to be watching now. Forget Apple, forget Nvidia. Oil and the DXY is where the chart will reveal the news. Pay attention!

The latest layout for crude oil today.With geopolitical risks gradually easing, oil prices have deviated significantly from macroeconomic and fundamental guidance. While Iran's situation has shown signs of mitigation, the single-day decline in oil prices was excessive. We believe current oil prices have reached a reasonable range: short positions can still be held, but chasing further shorting is no longer advisable.
On the daily chart, crude oil formed a large bearish candlestick with both no upper and lower shadows, directly breaking below support and continuing to decline. After breaking above the previous high, the breakdown of support indicates that oil prices are falling back again to seek a new trading range. Today, the focus remains on the sustainability of the bearish momentum.
you are currently struggling with losses,or are unsure which of the numerous trading strategies to follow,You have the option to join our VIP program. I will assist you and provide you with accurate trading signals, enabling you to navigate the financial markets with greater confidence and potentially achieve optimal trading results.
Trading Strategy:
sell@68.5-69.0
TP:64.5-64.0

Today's crude oil trading strategy, I hope it will be helpful toThree Driving Logics Behind Oil Price Collapse: From Geopolitical Ebb to Supply Loosening
(1) The "Security Pledge" for Strait of Hormuz Materializes
As the "lifeblood" for 30% of global seaborne crude oil, blockade expectations for the Strait of Hormuz were the core support for oil prices above $75. However, during the recent attacks, Iran deliberately avoided the strait's vicinity and even issued navigation safety bulletins via the International Maritime Organization (IMO)—this explicit signal of "no supply disruption" eliminated market panic over a "11 million bpd supply outage." Historical parallels show that after Iran attacked U.S. bases in 2020, oil prices surged 4.5% before rapidly reversing to a 1% decline due to the same "uninterrupted supply" logic—a pattern repeating today.
(2) OPEC+ Production Hike Expectations "Undercut the Foundation"
Despite escalating geopolitical tensions, OPEC+ has stuck to its plan to increase output by 411,000 bpd in July, with producers like Saudi Arabia hinting at "further capacity releases if necessary." This combination of "production pledge + supply stability" directly hedges against geopolitical risk premiums. More crucially, while U.S. crude inventories dropped by 11.47 million barrels last week, strategic reserve replenishment demand remains uninitiated, leaving markets focused on potential "oversupply" from OPEC+'s actual production increases.
(3) Aftermath of Trump's "Ceasefire Smokescreen"
Trump's earlier announcement of a "comprehensive Israel-Iran ceasefire"—though unconfirmed by official sources—planted expectations of "conflict resolution" in the market. When Iran opted for "symbolic attacks" over all-out retaliation, capital accelerated its exit from geopolitical risk exposures: data shows WTI net long positions have dropped from 179,100 contracts to 123,000 contracts, with the rapid exodus of speculative capital amplifying price declines.
Today's crude oil trading strategy, I hope it will be helpful to you
USOIL sell@64~64.5
SL:66
TP1:63.5~63

WTI CRUDE OIL: Massive 4H MA50 bearish breakout.WTI Crude Oil has turned neutral again on its 1D technical outlook (RSI = 48.933, MACD = 2.900, ADX = 47.682) as it just broke with force under the 4H MA50. Every time this has taken place in the recent past, a strong downtrend followed. The last such selling sequence dropped by -23.71%. The 4H RSI is on the exact same spot as then. We are bearish, TP = 59.00.
See how our prior idea has worked out:
## If you like our free content follow our profile to get more daily ideas. ##
## Comments and likes are greatly appreciated. ##

#USOIL - CUT n REVERSE region, still holds??#USOIL.. well guys in first go market perfectly holds our region then again n again..
Now again. Market is in our resistance region and if market hold again then again drop expected.
But
Keep in mind that above that region new will go for cut n reverse on confirmation .
Good luck
Trade wisely

Potential 3000+pips on XXXUSD PairsGBPUSD
We anticipate a potential bullish move towards the 1.3540 region, from there, we'll be watching closely for sign of exhaustion to initiate a short position, targeting up to 300pips to the downside. A confirmed daily close below the 1.2270 level will serve as out trigger to hold the short position with confidence,
EURUSD
For this market, we remain cautiously bearish. A 4H timeframe close below the 1.3950 region will be our signal to begin more sells to the downside targets around 1.3400 and 1.12800 zones. Until that breakdown occurs, we'll remain on the side-lines to avoid premature entries.
XAUUSD
Gold will be traded with a high level of discipline- only high conviction trades will be taken here. We're currently waiting for a clear breAK and close below the 3291.90 level before initiating any shorts positions. Until then, we maintain a neutral stance and monitor price action closely around key levels.
USOIL
We're keeping an eye on possible entry opportunities, anticipating a potential rally towards the 116 region. Updates on the setup and validation criteria will follow as price action unfolds.
Send a direct message if you are interested in more info about Capital Management.
Patience is the Way! Ieios
