Oil in a multi-week declining triangle patternPYTH:USOILSPOT
Oil has been in a multi-week declining triangle pattern, lasting over 2 years so far, which will eventually break to the downside. When it does, the price target should be around $35 USD. Which is calculated subtracting the width of the triangle from the base of the triangle.
When? Probably when we have a stock market crash, which could be soon. Fundamentally speaking, a global recession should reduce global demand for crude oil. Also, a resolution of the Ukraine-Rusia conflict should increase global supply of crude oil.
Good luck to you
USDWTI trade ideas

OIL, 15 Mn, Long on BreakoutOIL, 15 Mn, Long on Breakout
Bullish Divergence
Trade to be placed on Breakout

WTI / OIL PoV - Break Point 65$ / 62$ / 47$ LONG The price of oil has recently undergone a significant retracement, dropping to its lowest levels in the last three months. This decline has been influenced by several factors, including trade tariff policies and decisions made by OPEC+.
In March 2025, the price of Brent crude fell below $70, touching a low of $69.76, its lowest since September. In New York, West Texas Intermediate (WTI) lost 1.64%, reaching $67.24. New tariffs imposed by the Trump administration on imports from Canada and Mexico have fueled uncertainty about international trade, raising concerns that global economic slowdown might cause oil demand to fall behind supply.
Additionally, OPEC+ decided to increase production by 138,000 barrels per day in April, with the goal of reaching a production level of 2.2 million barrels per day by 2026. This decision contributed to an oversupply that could negatively affect prices, especially if economic growth slows.
Trade tariffs have had a direct impact on the oil market. In February 2025, China imposed a 10% tariff on U.S. crude oil in response to U.S. tariffs, contributing to the drop in oil prices to their lowest levels of the year. Additionally, U.S. crude oil inventories increased beyond expectations, indicating further weakness in demand.
Geopolitical tensions, such as the U.S. proposals to take control of Gaza and the intention to strengthen sanctions on Iran, have added further uncertainty to the market, affecting consumer and investor confidence.
Regarding the price levels you’ve identified for potential purchases, it's important to note that the oil market is influenced by a combination of geopolitical, economic, and supply factors. The support levels at $65, $62, and $57 that you've pointed out may represent significant technical levels, but it’s crucial to monitor geopolitical developments and trade policies that can affect price volatility. It is advisable to consult up-to-date sources and market analysis before making investment decisions.

Hellena | Oil (4H): SHORT to support area 65.268.We need to talk about one important nuance. Many people ask “Hellena, you say you can't buy oil, but it's going up. Well, it is, yes. But all my data and wave markings suggest that the price will soon start a downward movement. There are major changes in geopolitics and I am not in a position to stop them. I just set a stoploss and wait for the trade that will bring me profit.
Now coming to the forecast, I think that the downward movement will start soon, but before it, the price may rise quite high, maybe even to the area of 74.000.
But the main direction is the support area of 65.268.
There are 2 possible ways to enter the trade:
1) Entry at market price.
2) Limit pending sell orders if the price starts an upward movement to the area of 74.484.
Manage your capital correctly and competently! Only enter trades based on reliable patterns!

USOIL:Continue to move downwardAfter U.S. President Donald Trump announced tariffs and the OPEC+ decided to increase oil production, concerns about the demand outlook intensified, leading to a significant decline in crude oil prices on Thursday.
The short-term trend of crude oil has dropped sharply, with all the gains since mid-March being given back. The oil price has touched a low near 66. The moving average system diverges downward, and objectively, the short-term trend direction is downward. The bearish momentum is abundant. It is expected that after a minor adjustment at a low level in the intraday trading, the short-term trend of crude oil will mainly continue to move downward.
Trading Strategy:
buy@67.5-68
TP:66-65.5
Get daily trading signals that ensure continuous profits! With an astonishing 90% accuracy rate, I'm the record - holder of an 800% monthly return. Click the link below the article to obtain accurate signals now!

Bearish drop?WTI Oil (XTI/USD) has reacted off the pivot which has been identified as a pullback resistance and could drop to the 127.2% Fibonacci support.
Pivot: 66.59
1st Support: 64.82
1st Resistance: 67.96
Risk Warning:
Trading Forex and CFDs carries a high level of risk to your capital and you should only trade with money you can afford to lose. Trading Forex and CFDs may not be suitable for all investors, so please ensure that you fully understand the risks involved and seek independent advice if necessary.
Disclaimer:
The above opinions given constitute general market commentary, and do not constitute the opinion or advice of IC Markets or any form of personal or investment advice.
Any opinions, news, research, analyses, prices, other information, or links to third-party sites contained on this website are provided on an "as-is" basis, are intended only to be informative, is not an advice nor a recommendation, nor research, or a record of our trading prices, or an offer of, or solicitation for a transaction in any financial instrument and thus should not be treated as such. The information provided does not involve any specific investment objectives, financial situation and needs of any specific person who may receive it. Please be aware, that past performance is not a reliable indicator of future performance and/or results. Past Performance or Forward-looking scenarios based upon the reasonable beliefs of the third-party provider are not a guarantee of future performance. Actual results may differ materially from those anticipated in forward-looking or past performance statements. IC Markets makes no representation or warranty and assumes no liability as to the accuracy or completeness of the information provided, nor any loss arising from any investment based on a recommendation, forecast or any information supplied by any third-party.

WTI Oil H4 | Potential bearish breakoutWTI oil (USOIL) is falling towards a potential breakout level and it could drop lower from here.
Sell entry is at 66.44 which is a potential breakout level.
Stop loss is at 67.40 which is a level that sits above a pullback resistance.
Take profit is at 65.20 which is a multi-swing-low support.
High Risk Investment Warning
Trading Forex/CFDs on margin carries a high level of risk and may not be suitable for all investors. Leverage can work against you.
Stratos Markets Limited (www.fxcm.com):
CFDs are complex instruments and come with a high risk of losing money rapidly due to leverage. 63% of retail investor accounts lose money when trading CFDs with this provider. You should consider whether you understand how CFDs work and whether you can afford to take the high risk of losing your money.
Stratos Europe Ltd (www.fxcm.com):
CFDs are complex instruments and come with a high risk of losing money rapidly due to leverage. 63% of retail investor accounts lose money when trading CFDs with this provider. You should consider whether you understand how CFDs work and whether you can afford to take the high risk of losing your money.
Stratos Trading Pty. Limited (www.fxcm.com):
Trading FX/CFDs carries significant risks. FXCM AU (AFSL 309763), please read the Financial Services Guide, Product Disclosure Statement, Target Market Determination and Terms of Business at www.fxcm.com
Stratos Global LLC (www.fxcm.com):
Losses can exceed deposits.
Please be advised that the information presented on TradingView is provided to FXCM (‘Company’, ‘we’) by a third-party provider (‘TFA Global Pte Ltd’). Please be reminded that you are solely responsible for the trading decisions on your account. There is a very high degree of risk involved in trading. Any information and/or content is intended entirely for research, educational and informational purposes only and does not constitute investment or consultation advice or investment strategy. The information is not tailored to the investment needs of any specific person and therefore does not involve a consideration of any of the investment objectives, financial situation or needs of any viewer that may receive it. Kindly also note that past performance is not a reliable indicator of future results. Actual results may differ materially from those anticipated in forward-looking or past performance statements. We assume no liability as to the accuracy or completeness of any of the information and/or content provided herein and the Company cannot be held responsible for any omission, mistake nor for any loss or damage including without limitation to any loss of profit which may arise from reliance on any information supplied by TFA Global Pte Ltd.
The speaker(s) is neither an employee, agent nor representative of FXCM and is therefore acting independently. The opinions given are their own, constitute general market commentary, and do not constitute the opinion or advice of FXCM or any form of personal or investment advice. FXCM neither endorses nor guarantees offerings of third-party speakers, nor is FXCM responsible for the content, veracity or opinions of third-party speakers, presenters or participants.

Oil will increase to reach 71 dollarWe can assume this Safe Zone won’t break out from the bottom, so let's trade accordingly.

USOIL LONG SIGNAL|
✅CRUDE OIL fell down sharply
And will soon retest a key wide
Support area around 66.00$
So I think that the pair will make a rebound
Therefore we will be able to enter
A long trade with the TP of 68.20$
And the SL of 65.17$
LONG🚀
✅Like and subscribe to never miss a new idea!✅
Disclosure: I am part of Trade Nation's Influencer program and receive a monthly fee for using their TradingView charts in my analysis.

OILUSD PositiveOIL prices should hike from this support towards the normal 75,00 to the USD. This area is a strong support zone, let us see if it rejects habibi

SALE on CRUDEWe are having a sale on crude oil right now due to tariffs.
Trump will change his words or make ways to lower the price a bit more for him to buy more. ALWAYS buy crude without any leverages as it is investment, we will keep our position and buy when there are sale opportunities like today.
I anticipated that this month will be just waiting month. The reaction (rise) that we had was not a healthy reaction, so we needed this healthy way of rise. WHY? Its always better to buy in more positions and lower your averages 💪😎
Keep an eye on crude, and we will build a habit to look at crude when we clear our positions one by one, not being like a kid rise-happy&fall-sad.
It is very healthy and I LOVE IT right now💪😫👌🎉

Trade War Toilet Flush The tariff toilet flush has begun. 🚽 Don't get sucked down the drain into the sewer.
Let's look at oil. While things LOOK bad now, if we are headed to a true recession, look at the medium and long term supports for likely targets.
It feels like this "trade war" is a great cover for everyone to hide their dirty laundry in a growing pile of dirty laundry. I feel like the AI unwind has been going on for a while, and we had to "repay" all the printed money at some point.
DON'T PANIC. Look at previous crashes (dotcom bubble, GFC) for guidance of what things look like on the way down in a true crash. They want us to panic so they can buy things for dirt cheap then ride it all the way back up.


USOIL 1HR // 03 April 2025 AnalysisWe can see a small uptrend forming on the 1 hour timeframe.
Let's see how the price reacts around the trendline and the marked are of support and resistance.
Potential buys if we get a rejection from both the trendline and marked area of support/resistance.
Alternatively, if the price breaks through the area of support and resistance and the trendline, we can wait for a break and retest for potential sells.
DISCLAIMER: This analysis is purely for personal reference and record keeping and should be taken as educational material only, NOT FINANCIAL ADVISE. I will not be responsible for profits or loses due to this analysis.
USOIL: Key Levels and Bullish Prospects Amid Trade War ConcernsGood morning Traders,
Trust you are doing great.
Kindly go through my analysis of USOIL.
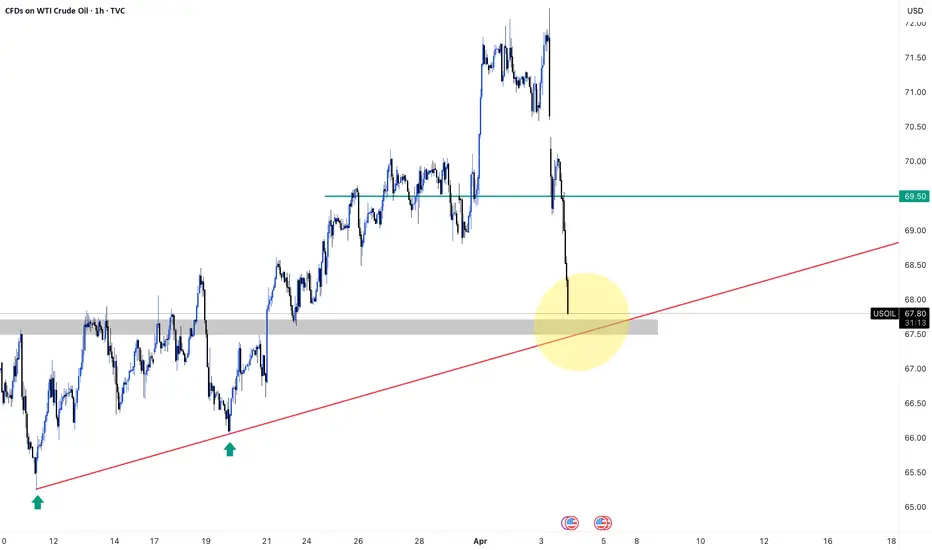
USOIL is currently experiencing market imbalance due to the nature of its opening range, following a gap-down decline last night in response to trade war concerns that have fueled recession fears. The price dropped from its weekly high of 72.22 to a key support zone at 69.00, which is near the week's low. As we anticipate the release of the ISM Services PMI at 3 PM GMT+1, I expect the demand zone to hold, driving the price higher—initially to fill the gap and subsequently toward the 71.35 region. Furthermore, this outlook is strengthened by the formation of a bullish Bat pattern on the M30 chart.
The key levels I will be monitoring for potential price action include the previous week's high at 70.10, the five-week high at 70.62, and the 71.35 region. These areas represent significant resistance levels that could be tested as price moves upward. A break below 68.80 will invalidate this outlook.
Cheers and Happy trading.


USOIL BULLS ARE STRONG HERE|LONG
USOIL SIGNAL
Trade Direction: long
Entry Level: 69.37
Target Level: 70.64
Stop Loss: 68.53
RISK PROFILE
Risk level: medium
Suggested risk: 1%
Timeframe: 2h
Disclosure: I am part of Trade Nation's Influencer program and receive a monthly fee for using their TradingView charts in my analysis.
✅LIKE AND COMMENT MY IDEAS✅

WTI CRUDE OIL TRADE SETUP : BREAKOUT OR BREAKDOWN ?📊 Key Observations:
🔹 Trend:
🚀 Strong bullish move followed by a correction 📉
🔻 Price is testing a support zone
🔹 Pattern Formation:
📏 Descending channel or flag-like structure
📍 Price is near a breakout point
🔹 Trade Setup:
✅ Entry Zone: Around 70.77
🛑 Stop Loss: 70.44 - 70.49 (Risk limit ❌)
🎯 Target Point: 71.80 (Profit zone ✅)
🔹 Indicators & Confirmation:
📊 DEMA (9) at 70.92 → Price is slightly below short-term momentum
🔥 A breakout above resistance could confirm a bullish move 🚀
📌 Conclusion:
✅ If price breaks the trendline upwards → Buy 📈 aiming for 71.80 🎯
❌ If support at 70.44-70.49 fails → More downside possible ⚠️
🚀 Watch for volume & candlestick confirmation before entering!

Crude Oil Dipped, Testing Critical Support Level FenzoFx—Crude oil dropped from $72.20 and is now testing the $68.8 support. The decline was expected as the Stochastic oscillator signaled overbought conditions.
If $68.8 breaks, the downtrend could extend to $67.6.
Bullish Scenario : However, a higher low above $70.15 would invalidate the bearish outlook, potentially pushing prices back to $72.20.

WTI Crude Oil (XTIUSD) – H4 SELL SetupWTI Crude Oil (XTIUSD) – H4 SELL Setup
Price has reacted from a key H4 supply zone after taking out previous highs. A clean bearish shift suggests continuation to the downside.
🔹 Entry: At supply zone
🔹 SL: Above mitigation zone
🔹 TPs:
First support
Equal lows
Extended swing low
Bias: Bearish
Reasoning: Liquidity sweep + market structure shift + imbalance

USOIL - NEW BREAKOUTHello Traders !
On Wednesday 5 March, The USOIL reached the support level (65.24 - 66.28).
Yesterday, The price broke the resistance level (70.08 - 70.57).
This key level becomes new support level !
So, I expect a bullish move🚀
________________
TARGET: 72.490🎯

Crude oil meets resistance at high levels, it is time to go shorAlthough we have used the daily line to re-count the waves, and explained that the current rising market is in the 2nd wave rebound of the daily line, which is the sub-wave c of wave 2, the market is still in a bearish trend in the daily line. After the market has completed this wave of 2nd wave rebound and adjustment, it will continue to fall by 3 waves. In the 4-hour market, the current market has not risen above 72.90 US dollars. We can still regard it as a rebound of 3-2 waves, or a rebound of the main wave 4. The main decline wave 1 of 4 hours fell from 76.57 US dollars to 69.80 US dollars, a drop of 6.77 US dollars, and the current 4-hour main decline wave 3 fell from 72.90 US dollars to 64. .85 dollars fell to 8.05 dollars. Why can it be either 3-2 waves or 4 waves? Because the current 8.05 dollars is larger than the decline of the main decline wave 1, it can be regarded as 3 waves, and the current rebound is very strong, so it can be regarded as 4 waves, but I think from the perspective of the main decline wave 3 in 4 hours, the decline should be more than that, it should be greater than 10 US dollars, so it can also be regarded as a rebound of 3-2 waves. The key is whether this wave of rise will break 72.90 US dollars. If it breaks, it will be a sub-wave of the main decline wave 1 in 4 hours. Therefore, our trading ideas today do not have a main direction. The market will make orders when the strategy reaches that first.
Today's crude oil recommendations: 1. Short at 72.65 US dollars, stop loss 30 points, and take profit 70.60 US dollars.

USOIL:Give priority to go long positions on the retracementU.S. heating oil futures gave back their gains. EIA (Energy Information Administration) data showed that U.S. distillate fuel oil inventories unexpectedly increased. U.S. gasoline futures' upward momentum expanded slightly, and the EIA data indicated that the inventory was basically in line with expectations.
The commercial crude oil imports in the United States excluding the strategic petroleum reserve for the week ended March 28 reached the highest level since the week ended January 31, 2025. The EIA strategic petroleum reserve inventory in the United States for the week ended March 28 was at its highest level since the week ended October 28, 2022. The increase in EIA crude oil inventories in the United States for the week ended March 28 recorded the largest gain since the week ended January 31, 2025. The domestic crude oil production in the United States for the week ended March 28 was at its highest level since the week ended December 20, 2024. The commercial crude oil inventory in the United States excluding the strategic petroleum reserve for the week ended March 28 was at its highest level since the week ended July 12, 2024.
Crude oil showed a trend of bottoming out and rebounding on Wednesday. It stabilized and rose near 70.7. After breaking through the $71.2 mark, there might have been a bullish reversal in crude oil. The oil price is expected to test the resistance level above 72.0. Once it further breaks through, it is expected to open up the upside space. In terms of future trading operations, it is advisable to consider laying out long positions on the retracement first.
Trading Strategy:
buy@70-70.5
TP:71.5-72
Get daily trading signals that ensure continuous profits! With an astonishing 90% accuracy rate, I'm the record - holder of an 800% monthly return. Click the link below the article to obtain accurate signals now!
