USOIL LONG FROM SUPPORT
USOIL SIGNAL
Trade Direction: long
Entry Level: 64.84
Target Level: 70.03
Stop Loss: 61.37
RISK PROFILE
Risk level: medium
Suggested risk: 1%
Timeframe: 9h
Disclosure: I am part of Trade Nation's Influencer program and receive a monthly fee for using their TradingView charts in my analysis.
✅LIKE AND COMMENT MY IDEAS✅
USDWTI trade ideas

Oil prices could rise due to high geopolitical uncertaintiesOil prices could rise due to high geopolitical uncertainties
The price of OIL has been waiting all these days with hopes for negotiations between Iran and Israel.
Currently, diplomacy is dead, so for now, the market has to absorb the news that the US has attacked Iran.
The price of oil is normal to rise and it is also very risky because it reacts quickly and does not keep the bullish momentum.
The price may rise as I showed in the chart, but the risk remains high.
Please be careful.
You may find more details in the chart!
Thank you and Good Luck!
❤️PS: Please support with a like or comment if you find this analysis useful for your trading day❤️

LONG ON OILUSOIL is consolidating at a major demand area.
We have a small choc (change of character) from down to up on the lower timeframe.
I will be buying oil to the next supply level looking to catch 500-1000 pips.

USOIL: Bullish Correction Ahead! Buy!
USOIL
- Classic bullish correction formation
- Our team expects growth
SUGGESTED TRADE:
Swing Trade
Buy USOIL
Entry Level - 65.16
Sl - 62.68
Tp - 68.86
Our Risk - 1%
Start protection of your profits from lower levels
Disclosure: I am part of Trade Nation's Influencer program and receive a monthly fee for using their TradingView charts in my analysis.
❤️ Please, support our work with like & comment! ❤️

USOIL Expected to Rebound to the 68–70 ZoneUSOIL has shown signs of short-term overselling, and a technical rebound is likely during today’s session. Traders participating in crude oil can consider buying on dips, focusing on short-term opportunities with proper position management. Quick entries and exits are recommended.

OIL: THE CHART THAT COULD TIP THE WORLDWTI Crude just bounced hard off the $65 channel support, tagging resistance at $76 — and what happens next isn’t just about price. It’s about power.
Zoom into this chart:
We're sitting at a directional pivot with two possible outcomes:
1️⃣ If this was a truncated 5th wave, the structure is complete. Any further war escalation could be the catalyst for oil to break resistance — dragging down risk assets, including CRYPTOCAP:BTC and equities.
2️⃣ If wave 5 isn’t done, we’ll likely see one more sharp leg down before oil launches. Either way, this is a high-stakes Elliott Wave setup with global macro consequences.
Chart with FIB Levels:
You'll see the wave I’ve marked (3) is messy, and on lower timeframes, that may hint at a truncated move worth watching.
Why this matters:
Over 20% of global oil flows through the Strait of Hormuz, a critical chokepoint controlled by Iran. If conflict escalates, that line gets squeezed… and oil price explodes.
Price to watch:
$76 resistance.
If oil breaks, the markets will react fast.
If it fails, we might get one more correction and maybe some relief from the sideways pain we’ve seen across risk assets.
Remember the COVID Crash?
Oil literally went below zero in April 2020. That wasn't just a chart anomaly, it was a global demand collapse. Traders were paying to get rid of oil because there was nowhere to store it. That moment marked a generational low, and what followed was a powerful multi-year 5 wave up.
Now look where we are:
That same COVID low helped form the base of the current Elliott Wave structure. The fact we’re back testing levels that once sparked global panic is no coincidence.
If you’ve been here before, you’ll see the signs. The charts always leave traces. And if this is the end of wave 5, it could be the start of a whole new macro move.
TLDR:
Stop trading headlines.
Trade the structure.
This chart is telling us everything.

USOIL - REVERSAL Market is in bearish trend, however there is a bullish divergence on 1H time- which means market may take a deep correction. Futher harmonic pattern Bullish crab is also in formation.
Take the entry above the break of LH and stoploss below the D point / LL. and TPs with R:R ratio of 1:1 and 1:2
Thanks.

Oil Set to Surge? Aggressive Entry Ahead of Potential BreakoutWTI is showing signs of a breakout following reports suggesting price spikes ahead. I've taken an aggressive position early, with an extreme risk-reward setup. A more conservative 3R idea also sits in play if price confirms. Watch for a trendline break—the clearest sign of lift-off. But be warned: the gap breakout may hit before many can get in. Momentum is building fast.

USOIL Technical analysisThere is a possibility of going up. If it breaks down, it will go down even further. Otherwise, it is likely to go up gradually.

USoilLatest news. If the Strait of Hormuz is closed, the restrictions on the import and export of oil and natural gas will increase greatly. Because 20% of the world's oil and natural gas exports come from the Strait of Hormuz. So the trend of geopolitics will affect the closing and opening of this important checkpoint. If the increase in geopolitics really reaches this point, the price of oil may rise to 90$-100$. This is an excellent trading opportunity for investors who like to trade oil. But at present, this is an option for Iran to negotiate. Rather than a real closure, after all, the incident has not developed to this situation. If you like to trade oil. You can also follow me. Get brand new trading opportunities and make profits. Do not trade independently to avoid losses.

CRUDE OIL (WTI): Bullish Move From Support
WTI Crude Oil may continue rising from an underlined blue support cluster.
As a confirmation, I see a quick liquidity grab below that and a consequent
bullish imbalance candle on an hourly time frame.
I expect a rise to 66.24
❤️Please, support my work with like, thank you!❤️

CRUDE set to fire 82 $ 90 $ 104 $ ????Crude Daily Elliot waves count suggest big UP setup in progress right now
55 $ key level to watch for buyer Extension point
Due to amid middle-east war situation may trigger Up move impulse wave towards 82 $ to 104 $ range
EW count are keeping changing during different price action in different time frame & multiple forecast .
this educational based chart as per EW theory method

Crude Oil Gets Trapped Back Inside 3-Year Down trending ChannelAfter failing to close above the upper border and the 78 resistance level, and amid renewed hopes for a Middle East ceasefire, oil prices dropped sharply back toward the neckline of the inverted head and shoulders formation—initially broken ahead of the recent war escalation—at 64.70.
A sustained move below that neckline could target crude prices toward the mid-zone of the established channel, near 63.40 and 61.40, where another rebound may take shape.
On the upside, if a clear recovery re-emerges above the 72-mark, the potential for a breakout above the 78-resistance could return, opening the door to revisit the 80 and 83.50 highs.
— Razan Hilal, CMT

TP REACHED ON OUR TRADE ON OILThis morning I posted to sell on Crude Oil, and our TP got filled to close the week with 5 profitable days strike.
Follow for more!

USOIL Buy- Go for buy if entry setup given
- Refine entry with smaller SL for better RR, if your strategy allow
A Message To Traders:
I’ll be sharing high-quality trade setups for a period time. No bullshit, no fluff, no complicated nonsense — just real, actionable forecast the algorithm is executing. If you’re struggling with trading and desperate for better results, follow my posts closely.
Check out my previously posted setups and forecasts — you’ll be amazed by the high accuracy of the results.
"I Found the Code. I Trust the Algo. Believe Me, That’s It."

US CRUDE OIL LONG RESULT Crude Oil price has been in an overall bullish trend and after it broke out of the previously formed symmetrical triangle.
Tried to get in earlier but wasn't getting enough pullback levels tapped.
Almost got our S.l hit and also missed the Tp but still managed to close in profits.
_THE_KLASSIC_TRADER_.

BEARISH BAT ON USOIL was a huge successWhat a successful trading opportunity on usoil, the bearish bat pattern was in alignment with the weekly order block. A full video breakdown of this trade and more will be posted soon, and the link is attached to this video for you all to learn.

USOILUSOIL will be bullish this week due to geopolitics and especially Iran/Israel War and Hormuz Strait closure.
Disclosure: We are part of Trade Nation's Influencer program and receive a monthly fee for using their TradingView charts in our analysis.

Crude oil fluctuates in a narrow range, waiting for direction
💡Message Strategy
Middle East ceasefire eases supply concerns, but risk premium remains
Oil prices rose more than 1% on the day as investors weighed the status of the ceasefire between Iran and Israel. Although both sides have announced an end to hostilities, US intelligence reports show that Iran's nuclear capabilities have only been temporarily damaged. ING analysts pointed out that although immediate concerns about supply disruptions have subsided, potential risks remain, a factor that may support spot prices in the short term.
Previously, crude oil prices soared after the US military action on Iranian infrastructure, but prices have retreated as the ceasefire continues. Although the geopolitical premium has been reduced, it has not been fully digested.
API shows a sharp drop in inventories, traders await EIA report
Industry data from the American Petroleum Institute (API) showed that US crude oil inventories fell sharply by 4.23 million barrels in the week ending June 20, far higher than the expected drop of 800,000 barrels. Gasoline and distillate inventories increased by 400,000 barrels each.
Market focus now turns to the US Energy Information Administration (EIA) report scheduled for release on Wednesday. Traders were expecting a 1.2 million-barrel draw in inventories, and confirmation of that figure by the EIA, widely viewed as an industry benchmark, would reinforce expectations of tighter supply.
📊Technical aspects
From the daily chart level, crude oil fluctuates upward in the medium term and tests around 67. The K-line closes with a large real negative line, which has not yet destroyed the moving average system and is still supported. The medium-term objective upward trend remains unchanged.
However, from the perspective of momentum, the MACD indicator crosses downward above the zero axis, indicating that the bullish momentum is weakening. It is expected that the medium-term trend of crude oil will fall into a high-level oscillation pattern.
The short-term trend of crude oil (1H) is in a narrow range of consolidation, with a small fluctuation. The oil price repeatedly crosses the moving average system, and the short-term objective trend direction fluctuates. In terms of momentum, the MACD indicator fast and slow lines slowly rise below the zero axis, and the long and short positions are in a stalemate, with no obvious advantage on one side. It is expected that the trend of crude oil will maintain a consolidation pattern during the day.
💰Strategy Package
Short Position:67.00-67.20,SL:67.80,Target: 65.50-64.50
Long Position:64.00-64.20,SL:63.50,Target: 65.50-66.50

WTI USOILKey Factors Affecting US Oil Prices Today:
Geopolitical Developments:
Oil prices had surged earlier in June due to US airstrikes on Iranian nuclear sites and fears of supply disruptions through the Strait of Hormuz. However, prices fell sharply after a ceasefire was announced between Israel and Iran, easing immediate supply concerns.
Inventory Data:
Market participants are awaiting US crude and fuel inventory reports. Recent data showed a significant drawdown in US crude stocks, supporting prices despite geopolitical easing.
Demand Signals:
US refinery utilization has increased, and gasoline demand is near multi-year highs, indicating strong domestic consumption that underpins oil prices.
Market Sentiment:
After a recent two-day plunge (Brent fell over 6%), oil prices are recovering as investors reassess the durability of the ceasefire and ongoing demand fundamentals.

Here is the latest analysis of the crude oil market trendOn Wednesday, international oil prices stabilized and rebounded after two consecutive days of correction, as the market reassessed the short-term easing of the Middle East situation and changes in crude oil supply. Brent crude oil futures rose by $0.75, or 1.1%, to $67.89 per barrel; WTI crude oil rose by $0.71 to $65.08. Previously, U.S. air strikes damaged key Iranian facilities. Although they did not completely destroy its capabilities, they triggered short-term market concerns about supply chain disruptions.
When geopolitical tensions temporarily eased, the market also turned its attention to inventory data. The latest data from the American Petroleum Institute (API) showed that for the week ending June 20, U.S. crude oil inventories fell by 4.23 million barrels, far exceeding the market expectation of a 2.5 million barrel decline, indicating that refinery demand remained strong. Under the dual effect of the mitigation of geopolitical risks and the bullish API inventory data, oil prices showed signs of stabilization, but the foundation for the rise was still fragile.
In the next few trading days, the safety of the Strait of Hormuz and the EIA official inventory report will become the key to whether the bulls can continue. In the current volatile pattern, it is necessary to remain cautious and pay close attention to changes in the technical support area and U.S. policy dynamics.
However, in terms of momentum, the MACD indicator has formed a bearish crossover below the zero axis, signaling a weakening of bullish momentum. This suggests that the medium-term trend of crude oil is likely to fall into a high-level consolidation pattern.
you are currently struggling with losses,or are unsure which of the numerous trading strategies to follow,You have the option to join our VIP program. I will assist you and provide you with accurate trading signals, enabling you to navigate the financial markets with greater confidence and potentially achieve optimal trading results.
Trading Strategy:
sell@67.0-68.0
TP:63.0-64.0

Tariff Panic = Opportunity | WTI Long SetupWTI Oil has finally dipped into my long-watched buy zone, driven by macro fear and an aggressive tariff agenda. The current drop aligned perfectly with my long-term execution plan. I’ve placed this trade based on key historical demand levels with my stop-loss and take-profit clearly defined. I’m prepared for deeper drawdown, but this area remains high-conviction for me. Execution > Prediction.
Technicals:
• Key Level: Price tapped into a major demand zone dating back to 2021 lows, which had been protected ever since.
• Liquidity Sweep: This drop mitigated every low formed post-2021 — clearing out late longs and stop hunts.
• Trendline Break Anticipation: I expect a potential trendline breakout from the long-term descending structure.
• SL/TP Defined: This trade has structure. It’s not a hope-based setup, it’s pre-planned and managed.
• Consolidation + Accumulation: This is where strong hands prepare, and I’m joining in.
Fundamentals:
• Tight supply, rising global demand, and structural underinvestment in oil exploration.
• Chinese reopening + Russian ban tighten market availability.
• Central banks expected to support demand via easing cycles.
• Oil Bearish Catalyst (Short-Term):
• US tariff wave: Trump announced a total 54% tariff on China and baseline tariffs on all trading partners.
• Escalating fears of global economic slowdown pushed prices to $58.80, a 4-year low.
The bearish panic gave bulls like us a gift. This is how real trades are born - not in euphoria, but in blood.
Note: Please remember to adjust this trade idea according to your individual trading conditions, including position size, broker-specific price variations, and any relevant external factors. Every trader’s situation is unique, so it’s crucial to tailor your approach to your own risk tolerance and market environment.

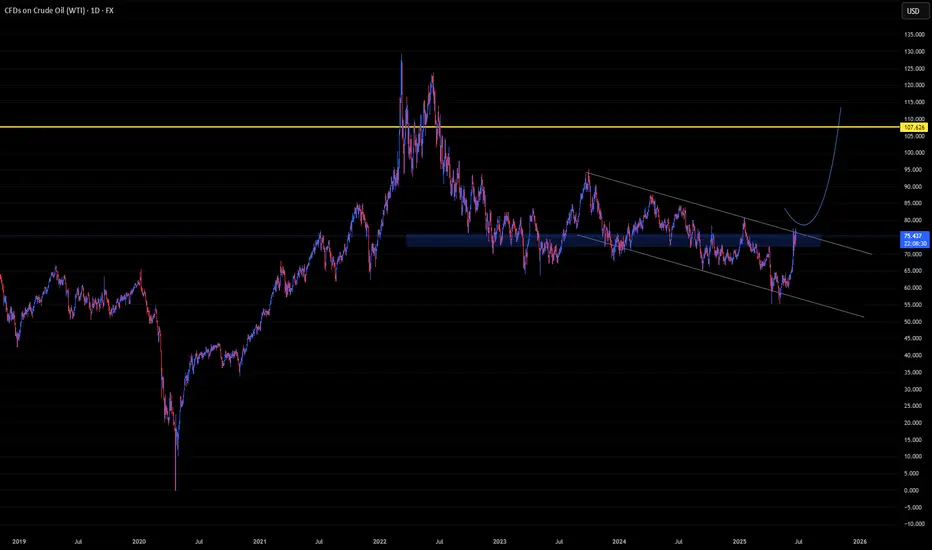
U-oyela Ongahluziwe Nenkunzi.Considering the current countries in conflict - FX:USOIL is in the middle of it. This will lead in a high demand but low supply of the commodity resulting in a soaring bullish move, fundamentally. Technically, the commodity has created a LL in the current year, tapping lows last touched since 2021 and has further recovered from last years close of 71.899.
FX:USOIL reaching highs of $110.00 is therefore likely.
***The best way to take advantage of this commodity or any other is to cherry pick stocks that are sensitive to it e.g. JSE:SOL is sensitive to FX:USOIL .***