USOIL - Another Bullish Move!Hello Traders !
Amid escalating tensions between Iran and Israel and following US strikes on Iranian nuclear sites, the Iranian parliament has approved the closure of the Strait of Hormuz.
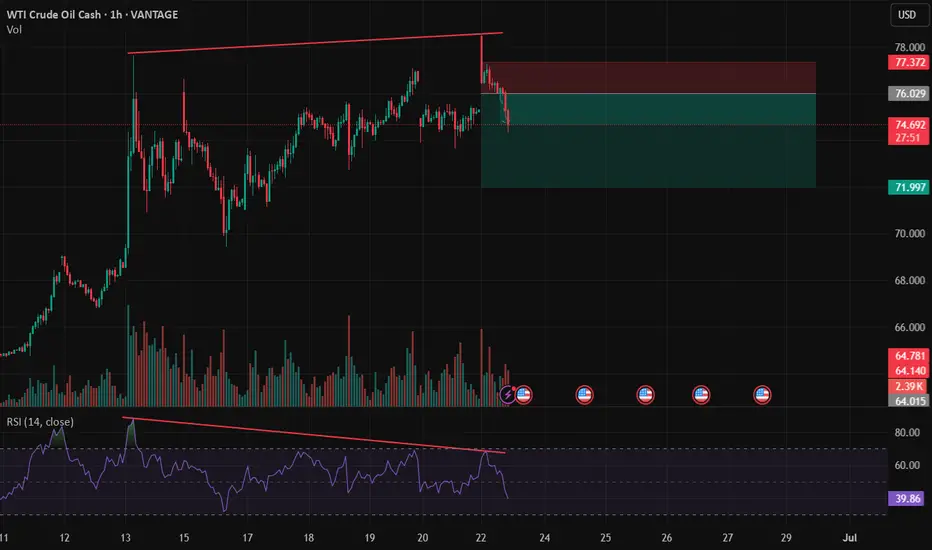
So, I expect another bullish move in USOIL price🚀
______________
TARGET: 77.200🎯
USDWTI trade ideas

WTI Oil: further downside?Front page news this morning focussed on the ceasefire between Israel and Iran, first announced by US President Donald Trump on his Truth Social platform. However, reports recently emerged of Iran firing missiles, seemingly violating the ceasefire, but no confirmation has been received yet. The point is that things remain somewhat uncertain as of writing.
The technical front, nevertheless, is interesting on WTI Oil (West Texas Intermediate), and ultimately points to a moderate pullback before heading lower.
Monthly descending triangle in play
The flow on the monthly chart reveals that price action completed a descending triangle in April this year, formed between US$95.00 and US$64.41. Following the breach of the lower boundary and refreshing year-to-date (YTD) lows of US$55.15, a determined pullback materialised and resulted in the unit testing the upper barrier of the pattern. As you can see, the test has held for now, with June poised to end the month considerably off its best levels.
Given that price has aggressively rejected the upper boundary of the triangle formation, and if we see WTI push to fresh YTD lows, this would unearth a possible bearish scenario in the direction of support from US$42.57.
Daily Fibonacci resistance
Across the page on the daily chart, you will note that recent flow touched gloves with support at US$64.55, a level complemented by a 1.272% Fibonacci projection ratio at US$64.76, a trendline support (extended from the low of US$55.40), and a neighbouring 61.8% Fibonacci retracement level at US$63.70. Given that the 1.272% Fibonacci projection ratio also represents an ‘alternate’ AB=CD support pattern, traders that are long from US$64.55 may aim for the 38.2% and 61.8% Fibonacci retracement ratios of US$69.53 and US$72.59. Consequently, both of these lines serve as potential resistance levels to watch.
H1 confluence
With monthly price suggesting further selling, and daily resistance on the table, the H1 chart shines the spotlight on two levels of resistance at US$68.35 and US$70.14. However, I am more drawn to the latter level as a potential resistance. This is because it converges closely with the 38.2% Fibonacci retracement ratio on the daily timeframe mentioned above at US$69.53, as well as a nearby 1.618% Fibonacci projection ratio on the H1 chart at US$69.13.
As a result, my focus will be on H1 resistance between US$70.14 and US$69.13.
Written by FP Markets Chief Market Analyst Aaron Hill


USOIL: Target Reached!Noice! I mean my dss is fully functional and working ! This is going to be my permanant edge.

Is the oil market signalling de-escalation?After an initial 6% spike at the open, U.S. crude oil futures reversed sharply—falling into negative territory—as markets priced in the possibility that Iran's latest retaliation may be more symbolic than escalatory.
According to President Donald Trump, Iran gave advance notice before launching missiles at a U.S. base in Qatar, allowing defences to intercept the attack and resulting in no reported casualties.
While Tehran publicly described the strike as “devastating and powerful,” the lack of impact on the ground and the pre-warning have fuelled speculation that Iran was aiming to save face without triggering a broader conflict.
The swift reversal in oil prices reflects that sentiment. For now, the market appears to be signaling that escalation may pause here.

USOIL - BullishUSOIL is testing its support level after a good retracement. This is also a trend line support. Buying at current level with stop loss below support level.

Crude Oil Eyes 3-Year Channel BreakoutCrude Oil trades between Israel-Iran-Conflict supply risks, overbought momentum, and the potential for a 3-year channel breakout.
While upside risks from a possible Strait of Hormuz closure remain uncertain, a firm hold above $78 could extend gains toward $80 and $83.50, keeping oil on a bullish edge for H2 2025.
A pullback into the channel may ease inflation concerns and reassert bearish pressure below the $80 mark. Key support lies at $72 for a potential downside resumption.
- Razan Hilal, CMT

USOIL Is Very Bullish! Long!
Take a look at our analysis for USOIL.
Time Frame: 1D
Current Trend: Bullish
Sentiment: Oversold (based on 7-period RSI)
Forecast: Bullish
The market is on a crucial zone of demand 73.546.
The oversold market condition in a combination with key structure gives us a relatively strong bullish signal with goal 79.365 level.
P.S
We determine oversold/overbought condition with RSI indicator.
When it drops below 30 - the market is considered to be oversold.
When it bounces above 70 - the market is considered to be overbought.
Disclosure: I am part of Trade Nation's Influencer program and receive a monthly fee for using their TradingView charts in my analysis.
Like and subscribe and comment my ideas if you enjoy them!

WTI Crude Oil (USOIL) Technical Analysis: Bullish Reversal FacesOf course. Here is a detailed analysis of the provided financial chart for USOIL (WTI Crude Oil).
### Executive Summary
This is a **weekly (1W) Heikin Ashi chart** for CFDs on WTI Crude Oil (USOIL). The chart displays a long-term view, with a prominent downtrend from a peak in 2022. However, there has been a very strong bullish reversal in the most recent weeks. The analysis points to a critical juncture where the price is testing a key long-term resistance level. The bullish momentum is strong, but it faces significant hurdles ahead.
### Detailed Breakdown
#### 1. Asset and Chart Type
* **Asset:** USOIL (WTI Crude Oil), traded as a Contract for Difference (CFD).
* **Timeframe:** 1W (Weekly). Each candle represents one week of price action. This chart is used for analyzing long-term trends.
* **Chart Type:** Heikin Ashi. Unlike standard candlesticks, Heikin Ashi candles are calculated using averages, which smooths out price action and makes trends easier to identify. Long green candles with no lower wicks indicate strong buying pressure, while long red candles with no upper wicks indicate strong selling pressure.
#### 2. Current Price Action
* The last visible candle is a **strong green Heikin Ashi candle**, indicating significant bullish momentum during that week.
* The data for this candle shows: **Open 69.22, High 77.10, Low 69.22, Close 75.41**. This represents a gain of **+4.19%** for the week.
* The price has bounced sharply from a recent low and is now in its third consecutive week of gains.
#### 3. Key Technical Indicators
**a) Fibonacci Retracement:**
* This tool is drawn from a significant low (marked as 1 at **$68.01**) to a major high (marked as 0 at **$123.24**). It's used to identify potential support and resistance levels.
* The price has been trading between the 0.618 and 1 levels for a prolonged period.
* The recent low was found just below the `1` level ($68.01), indicating a potential double-bottom or failure to break lower.
* The price has since reclaimed the `0.786` level ($79.83) and is currently trading around the **$75.41** mark. The next major resistance levels based on this tool are:
* **0.786:** $79.83
* **0.618:** $89.11
* **0.5:** $95.63
**b) Moving Average (MA):**
* A **50-period Moving Average (MA 50)** is present on the chart (the blue line), with a current value of **69.89**.
* On a weekly chart, the 50-week MA is a critical long-term trend indicator.
* The price has been consistently below the 50-week MA since late 2022, confirming the long-term bearish trend.
* **Crucially, the current price is attempting to break above this moving average.** A sustained close above the 50-week MA would be a strong bullish signal. Conversely, if this level acts as resistance and the price is rejected, it could signal a continuation of the downtrend.
**c) Relative Strength Index (RSI):**
* The RSI (14) is shown at the bottom. The purple line (RSI) is currently at **63.33** and its moving average (yellow line) is at **41.95**.
* The RSI is pointing upwards and has decisively crossed above its moving average, indicating **building bullish momentum**.
* It is not yet in the "overbought" territory (typically above 70), which suggests there could be more room for the price to move higher before becoming extended.
**d) Fibonacci Time Zones:**
* The vertical blue lines numbered 0, 1, 2, 3, 5, 8 are Fibonacci Time Zones. They are used to forecast potential turning points in the market based on time intervals.
* The recent major low occurred very close to the "8" time zone marker, which may have contributed to the timing of this reversal.
### Synthesis and Potential Scenarios
* **Bullish Scenario:** The combination of strong green Heikin Ashi candles, a rising RSI, and a bounce from a key long-term low points to strong short-term bullish momentum. If the price can decisively break and hold above the **50-week MA (around $70)** and the **Fibonacci 0.786 level ($79.83)**, the next major target would be the **0.618 level at $89.11**.
* **Bearish Scenario:** The long-term trend remains bearish as long as the price is below the 50-week MA. This level, combined with the psychological resistance at $80, could prove to be a formidable barrier. If the price fails to break through, it could be rejected back down to test recent lows around the **$68.00** area.
In conclusion, the chart shows a classic battle between short-term bullish momentum and a long-term bearish trend. The price's interaction with the **50-week moving average** in the coming weeks will be critical in determining the next major directional move for WTI Crude Oil.

Oil buy setup H1Hello! Friends,
Greetings. Please leave a Like if you like the idea.
Before start talking about technical Let's share your LOVE by giving me LIKES to support this work. Thanks in advance.

Double topDouble top with RSI divergency. If you have the strength to ride all the way down to neck line you going to be well rewarded.
USOIL Bullish breakout from symmetrical triangle pattern🚨 USOIL Breakout Alert! 🚨
1H Time Frame | Symmetrical Triangle Breakout
Crude oil (USOIL) has broken out bullishly from a symmetrical triangle pattern — confirming strong upward momentum. 📈
🎯 Entry Level: 74.20
📍 Technical Targets:
1st Resistance: 75.70
2nd Resistance: 76.80
This setup signals a potential continuation of bullish momentum. Keep an eye on volume confirmation and price action near resistance levels.
💬 Drop your thoughts in the comments!
📲 Like, follow, and join us for more real-time market insights.
Trade smart
,
– Livia 😜

The situation escalates? Crude oil gains remain stable
💡Message Strategy
The daily chart of WTI crude oil shows a 30% increase from late May to mid-June, with prices stagnating below resistance near $76. The Commodity Channel Index (CCI) has been overbought since late May and is now approaching a potential buy signal below 100.
Volatility peaked on June 14 and has since fallen back, suggesting that oil prices could see a correction if tensions in the Middle East do not escalate further. But now that the United States is out of the game and the situation could escalate at any time, crude oil is still in a bullish market.
📊Technical aspects
From the daily chart level, crude oil prices have broken through the upper resistance of the range in the medium term and tested a new high of 75.00. The moving average system is in a bullish arrangement, and the medium-term objective trend is upward. The current trend is in the upward rhythm of the main trend. The MACD indicator fast and slow lines overlap with the bullish column above the zero axis, indicating that the bullish momentum is currently full, and it is expected that the medium-term trend is expected to usher in a wave of rising rhythm.
The short-term (1H) trend of crude oil fluctuated and then broke through upward, and the oil price tested a new high near 78.40. The moving average system gradually opened upward, and the short-term objective trend direction was upward.
In terms of momentum, the MACD indicator fast and slow lines opened upward near the zero axis, and the bullish momentum was dominant. It is expected that the trend of crude oil will maintain a high level of fluctuation upward.
💰Strategy Package
Long Position:74.50-75.50,SL:73.50
Short-term target is around 77.00-78.00

OILThe proposed closure of the Strait of Hormuz by Iran's parliament is a significant development because the strait is a vital global energy artery, handling a substantial portion of the world's oil and gas. If closed, it would disrupt global energy supplies, potentially leading to a surge in oil prices and impacting international trade. While the plan is not yet finalized, the mere possibility of such action introduces significant geopolitical risk and could have far-reaching economic consequences.

USOIL BEST PLACE TO SELL FROM|SHORT
USOIL SIGNAL
Trade Direction: short
Entry Level: 73.94
Target Level: 72.14
Stop Loss: 75.12
RISK PROFILE
Risk level: medium
Suggested risk: 1%
Timeframe: 2h
Disclosure: I am part of Trade Nation's Influencer program and receive a monthly fee for using their TradingView charts in my analysis.
✅LIKE AND COMMENT MY IDEAS✅

WTI Crude Oil Long Setup Amid Rising Geopolitical TensionsWTI is forming a bullish structure with potential for further upside. Geopolitical tensions between the U.S. and Iran are adding pressure to the supply side, supporting higher oil prices. A long position aligns with both technical momentum and the increasing risk premium.

USOIL WTIKey Offshore Oil and Gas Installations at Risk of Iranian Attack
Based on recent escalations and Iran's retaliatory capabilities, the following offshore installations are most vulnerable:
Strait of Hormuz Infrastructure
Why at risk: A critical global chokepoint handling 21 million barrels of oil daily. Iran has repeatedly threatened closure if provoked.
Potential targets: Tanker routes, underwater pipelines, and monitoring stations.
Qatar’s North Field Gas Facilities
Why at risk: Directly adjacent to Iran’s South Pars field (recently attacked by Israel). Shared reservoirs mean disruptions could cascade.
Vulnerability: Iran could target Qatari platforms to amplify global gas shortages.
Saudi/UAE Offshore Fields
Key sites:
Saudi Arabia’s Safaniya (world’s largest offshore oil field).
UAE’s Upper Zakum oil field.
Why at risk: Iran views Gulf states as Israeli allies; striking them would disrupt U.S.-aligned economies.
Israeli Mediterranean Gas Rigs
Leviathan and Tamar fields:
Provide 90% of Israel’s electricity.
Already targeted by Iranian proxies (e.g., Hezbollah rockets in 2023).
Bahrain/Kuwait Offshore Facilities
Strategic value: Proximity to Iran enables rapid drone/missile strikes. Past attacks (e.g., 2019 Aramco) demonstrate capability.
Why These Targets?
Retaliatory logic: Iran’s energy infrastructure (e.g., South Pars) was damaged by Israeli strikes. Targeting adversaries’ assets aligns with its "escalate to deter" strategy.
Global leverage: Disrupting Hormuz or major fields could spike oil prices 30–50%, pressuring Western governments.
Technical feasibility: Iran’s naval drones, cruise missiles, and mines can penetrate offshore defenses.
Immediate Threats
Target Risk Level Potential Impact
Strait of Hormuz Critical Global oil prices surge; 20% of LNG shipments halted
Qatar’s North Field High 10% of global LNG supply disrupted; Europe/Asia energy crisis
Israeli Gas Rigs High Israel’s energy security crippled; regional conflict escalation
Conclusion
Iran’s most likely retaliation targets are offshore installations in the Strait of Hormuz, Qatar, and Israeli Mediterranean fields, leveraging proximity and asymmetric tactics. Such attacks would aim to inflict maximum economic damage while avoiding direct confrontation with the U.S. or NATO. Global energy markets face severe disruption if hostilities escalate further.
A successful breakout above this descending trendline and resistance zone (near $74–$75) would confirm a bullish reversal, potentially opening the way for further upside toward $80 and $100 as next target.
US crude inventories have declined recently, reducing oversupply fears and supporting prices.
Global oil demand is forecast to grow by 720,000 barrels per day in 2025, while supply increases are more modest.
OPEC+ decisions to maintain production cuts or limit increases have also contributed to price support.
Summary
Oil prices are testing and potentially breaking out of a long-term descending trendline formed since mid-2022.
breakout will be long buy hope that we see 80$ per barrel.
#usoil #oil

OIL 2 Best Places For Buy Very Clear , Don`t Miss This 1000 PipsHere is my opinion on oil , we have a very aggressive movement to upside and this is normal right now , i`m looking to buy this Pair if the price go back to retest my support and this will be the best place to buy it for me , and if the price moved directly without retest it i will wait the price to break the other res and then i can enter a buy trade and targeting the highest level the price touch it , also if the price go back to retest my support and go up and closed above the other res i will add one more entry with the same target.

USOIL may saturated and is about to swing downUSOIL may reach a saturation point and is likely to swing down, at least in the Short Term.
Technically, the price has tested the upper boundary of the descending channel near the key psychological resistance at $75 per barrel but failed to close above it, despite a brief breakout. This reflects the strength of the 75 resistance zone.
Moreover, the RSI entered the overbought zone, and Bearish Divergence between price and RSI occured, which further increases the probability of a correction.
Therefore, at this stage, crude oil prices potentially pull back to the $70 level before determining the next directional move.
From a fundamental perspective, the recent surge in oil prices has been primarily driven by geopolitical tensions in the Middle East.
However, historically, the situation tends to cause only short-lived spikes in oil prices. Sustainable gains in oil prices require real demand support. Although the conflict persists, markets are less reactive, likely due to the absence of supply chain disruptions or transport route closures.
Additionally, the US decision to hold the strike and increase diplomat time has given investors time to adjust their portfolios, potentially for profit-taking from previously accumulated long positions.
As a result, oil prices may pull back during this period.
Now, considering the long-term factors, there are several reasons why oil prices are unlikely to rise significantly beyond The current levels:
Oversupply:
Global crude oil production has been increasing, particularly from non-OPEC+ countries such as the United States, Canada, and Brazil. At the same time, OPEC+ members have been gradually raising their output as well, resulting in a market where supply exceeds demand.
Sluggish Demand Growth:
Oil demand is growing slowly due to a lackluster global economic outlook, the rising adoption of electric vehicles, and ongoing efforts to reduce fossil fuel consumption. Additionally, increasing risks such as new taxation and geopolitical tensions have led to investment slowdowns in certain regions.
Rising Inventories:
Global oil stockpiles have been steadily increasing, exerting downward pressure on prices.
Major entities have released their West Texas Intermediate (WTI) crude oil price forecasts for 2025 and 2026. J.P. Morgan projects prices at $66 per barrel for 2025 and $58 for 2026. The U.S. Energy Information Administration (EIA) offers a slightly different outlook, forecasting $62 per barrel in 2025 and $59 in 2026. Meanwhile, Trading Economics anticipates a price of $63.28 by the end of Q2 2025, rising to $65.70 in 2026.
Analysis by: Krisada Yoonaisil, Financial Markets Strategist at Exness


SCALPING POSSITION US IOLus now on way to finish wave z
stp loss: 66.836
tp :67582
Like and folow our profile for more free analyse forex crypto stocks future anything
note :for help or ask for the best place fore entre just inbox me

Short-Term Overpricing Signals Oil ConsolidationFenzoFx—Crude Oil is retesting broken resistance at $67.5 while the Stochastic remains overbought, suggesting short-term pricing pressure.
A pullback into the Bullish Fair Value Gap may offer a low-risk entry before the uptrend resumes.

crude carving out shallow complex w4 to at least a 6708 print? crude looks to be carving out a complex wave 4 in an ascending wedge that should extend toward 6708. I'm looking for the D wave down to commence anytime now. lets see if this will play out.
