WTI Oil H4 | Multi-swing-low support at 61.8% Fibo retracementWTI oil (USOIL) is falling towards a multi-swing-low support and could potentially bounce off this level to climb higher.
Buy entry is at 72.92 which is a multi-swing-low support that aligns with the 61.8% Fibonacci retracement.
Stop loss is at 69.10 which is a level that lies underneath a swing-low support.
Take profit is at 77.60 which is a multi-swing-high resistance.
High Risk Investment Warning
Trading Forex/CFDs on margin carries a high level of risk and may not be suitable for all investors. Leverage can work against you.
Stratos Markets Limited (tradu.com ):
CFDs are complex instruments and come with a high risk of losing money rapidly due to leverage. 63% of retail investor accounts lose money when trading CFDs with this provider. You should consider whether you understand how CFDs work and whether you can afford to take the high risk of losing your money.
Stratos Europe Ltd (tradu.com ):
CFDs are complex instruments and come with a high risk of losing money rapidly due to leverage. 63% of retail investor accounts lose money when trading CFDs with this provider. You should consider whether you understand how CFDs work and whether you can afford to take the high risk of losing your money.
Stratos Global LLC (tradu.com ):
Losses can exceed deposits.
Please be advised that the information presented on TradingView is provided to Tradu (‘Company’, ‘we’) by a third-party provider (‘TFA Global Pte Ltd’). Please be reminded that you are solely responsible for the trading decisions on your account. There is a very high degree of risk involved in trading. Any information and/or content is intended entirely for research, educational and informational purposes only and does not constitute investment or consultation advice or investment strategy. The information is not tailored to the investment needs of any specific person and therefore does not involve a consideration of any of the investment objectives, financial situation or needs of any viewer that may receive it. Kindly also note that past performance is not a reliable indicator of future results. Actual results may differ materially from those anticipated in forward-looking or past performance statements. We assume no liability as to the accuracy or completeness of any of the information and/or content provided herein and the Company cannot be held responsible for any omission, mistake nor for any loss or damage including without limitation to any loss of profit which may arise from reliance on any information supplied by TFA Global Pte Ltd.
The speaker(s) is neither an employee, agent nor representative of Tradu and is therefore acting independently. The opinions given are their own, constitute general market commentary, and do not constitute the opinion or advice of Tradu or any form of personal or investment advice. Tradu neither endorses nor guarantees offerings of third-party speakers, nor is Tradu responsible for the content, veracity or opinions of third-party speakers, presenters or participants.
USDWTI trade ideas

Trump’s “ambiguous” statement, where will oil prices go?
💡Message Strategy
Trump's remarks are repeated, and the geopolitical premium still limits the downward space of oil prices
Trump said that the United States "may or may not" join Israel's actions against Iran. Analysts pointed out that if the United States is officially involved in the conflict, oil prices may rise by $5; if peace talks are launched, they may fall by the same amount.
The geopolitical focus is still on the Strait of Hormuz
Iran produces 3.3 million barrels of oil per day, but more importantly, about 19 million barrels of crude oil are transported through the Strait of Hormuz. The escalation of the conflict may threaten the safety of the waterway.
The Fed's policy turn to dovish failed to effectively support oil prices
Although the Fed hinted that it may cut interest rates twice this year, Chairman Powell emphasized that the decision still depends on inflation data, and Trump's upcoming new round of import tariffs may push up prices and limit the boost in oil demand brought about by loose policies.
📊Technical aspects
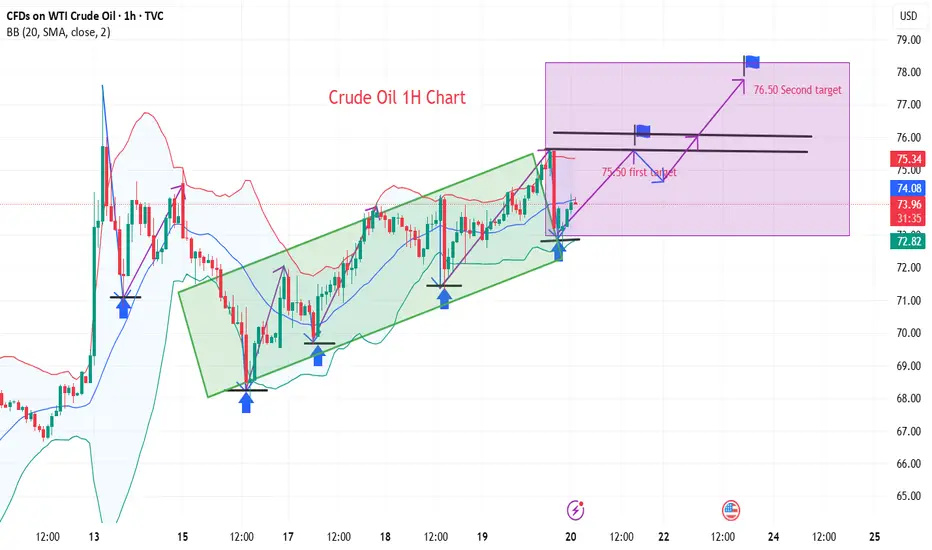
From the daily chart level, crude oil prices in the medium term broke through the upper resistance of the range and tested a new high of 75.50. The moving average system is in a bullish arrangement, and the medium-term objective trend is in the direction.
The current trend is in the upward rhythm of the main trend. The MACD indicator fast and slow lines overlap with the bullish column above the zero axis, indicating that the bullish momentum is currently full, and it is expected that the medium-term trend is expected to usher in a wave of rising rhythm.
💰Strategy Package
Long Position:73.00-73.50,SL:72.50
The first target is around 75.50
The second target is around 76.50
If the situation in the Middle East escalates, the room for crude oil to rise will be enlarged
Today's crude oil trading strategy, I hope it will be helpful to 1. Technical Support at the $74 Safety Cushion
Current prices sit squarely in the $74-$78 trading range, with $74 acting as a proven safety cushion—history shows prices rebounding each time they test this level. The $75.03 dip is a hair's breadth from this buffer, testing its resilience.
2. Why the Pullback?
- **Geopolitical Fatigue**: Markets are shrugging off Iran's Strait of Hormuz blockade threats, like crying wolf too often.
- **OPEC+ Supply Jitters**: Despite Saudi Arabia potentially limiting exports due to domestic power demand, the group's production hike announcement has fueled oversupply concerns.
3. Underlying Tensions Remain
Iran's rhetoric may be empty so far, but the standoff resembles two foes clutching weapons mid-argument—any escalation could send prices surging. This dip likely reflects market indecision, as traders await the first move.
4. Trading Strategies for Different Styles
- **Aggressive Traders**:
Consider light long positions near $75, like resting your foot on the gas before a stoplight turns green. Set stop-loss below $74 (breaching the safety cushion signals a trend shift) and target $78 initially, eyeing higher levels on a breakout.
- **Conservative Traders**:
Stick to range trading: buy near $74-$75 and sell around $77-$78, like cruising on a flat road for steady gains. Keep position sizes small and take profits promptly.
5. Key Watchout: Strait of Hormuz Realities
Monitor for concrete disruptions—oil tanker attacks or navigation system glitches would confirm the "wolf has arrived." Adjust positions decisively based on pre-set plans: add to longs on threats, or cut losses if diplomacy defuses tensions.
The market resembles a ship in choppy waters—opportunities and risks coexist. Stay vigilant and flexible, like a driver scanning the road ahead while ready to brake or steer. In this game, survival outpaces quick profits.
Today's crude oil trading strategy, I hope it will be helpful to you
USOIL buy@74~74.5
SL:73
TP1:75.5~76.5
TP2:77~78

US oil Oil prices could rise due to high geopolitical uncertainties Prices Poised to Rise Amid Heightened Geopolitical Tensions
Oil prices have remained steady in recent days, driven by the anticipation of potential diplomatic resolutions between Iran and Israel. However, with diplomacy now off the table and news emerging of a U.S. strike on Iran, the market is reacting swiftly.
Given the current geopolitical climate, it’s normal to expect a surge in oil prices. However, traders should be aware that oil is highly volatile—it tends to spike rapidly but often struggles to maintain upward momentum.
While a price increase is likely, as illustrated in the attached chart, the level of risk remains elevated. Please exercise caution when trading under these conditions.
More details are provided in the chart.
Thank you, and good luck!

WTI Short PositionBelieve stability within the Middle East market will bring the price down so it could rebound back up once liquidity has been cleared

Oil panic buying after Iran Strikes?President Donald Trump has confirmed that the U.S., in coordination with Israel, has conducted three strikes on Iranian nuclear facilities.
Will there be panic buying of WTI and Brent at the open?
In response, Iran’s parliament has approved a proposal to close the Strait of Hormuz, a key global oil shipping route. The final decision lies with Iran’s Supreme National Security Council and Supreme Leader Ayatollah Ali Khamenei.
If a blockade is enforced, oil prices could rise sharply. ClearView Energy Partners estimates a short-term closure could add between $8 and $31 per barrel. JP Morgan has suggested that a full-scale conflict and complete shutdown could drive prices to $130.

XTIUSD H4 AnalysisXTIUSD Showing a bearish Flag. If it breaks this zone above, Most probably can fly upto 81.00 and higher. If no, Can rally between 72, 68 or even 66. Trading Analysis from 23-06-25 to 27-06-25. Take your risk under control and wait for market to break support or resistance on smaller time frame. Best of luck everyone and happy trading.🤗

US-Oil will further push upside After Testing TrendlineHello Traders
In This Chart XTIUSD HOURLY Forex Forecast By FOREX PLANET
today XTIUSD analysis 👆
🟢This Chart includes_ (XTIUSD market update)
🟢What is The Next Opportunity on XTIUSD Market
🟢how to Enter to the Valid Entry With Assurance Profit
This CHART is For Trader's that Want to Improve Their Technical Analysis Skills and Their Trading By Understanding How To Analyze The Market Using Multiple Timeframes and Understanding The Bigger Picture on the Charts


Crude Oil Market Trend Forecast for Next WeekThe oil price continued its upward trend this week, despite a brief correction on Friday. As of Friday's Asian session, Brent crude oil futures dropped by $1.57, or 2%, to $77.28 per barrel. However, the cumulative weekly gain reached 3.9%, marking three consecutive weekly increases. Geopolitical risks continued to fuel market sentiment. Oil prices surged nearly 3% on Thursday after Israel bombed Iranian nuclear targets, following Iran's missile strikes on Israel after its earlier missile attack on an Israeli hospital. The focus of the current crude oil market has shifted entirely from supply-demand fundamentals to geopolitical risks. Although Iran's crude oil exports have not been substantially disrupted, investors have started to price in the worst-case scenario. If the situation further deteriorates and affects shipping routes through the Strait of Hormuz, global energy prices may face a new round of sharp volatility.
In the short term, oil prices still exhibit upward potential, with the current trend maintaining an overall upward trajectory. The MACD indicator's fast and slow lines overlap with bullish bars above the zero axis, signaling robust bullish momentum. This suggests that the medium-term trend is expected to usher in an upward rally.
you are currently struggling with losses,or are unsure which of the numerous trading strategies to follow,You have the option to join our VIP program. I will assist you and provide you with accurate trading signals, enabling you to navigate the financial markets with greater confidence and potentially achieve optimal trading results.
Trading Strategy:
buy@72.0-72.5
TP:75.0-75.5

Crude Oil Market: Geopolitical Risk Premium Soars Sharply Crude Oil Market: Geopolitical Risk Premium Soars Sharply
(1) Strait of Hormuz: Global Energy Artery in Crisis
As the gateway for 20% of global crude oil transportation, every disturbance in the Strait of Hormuz grips market nerves. The Iranian Revolutionary Guard has now deployed missile boats and mine-laying vessels at the strait's narrowest point (just 33 km). The UK Maritime Security Agency warns that Iran may adopt a "gradual blockade"—first causing shipping chaos through electronic jamming, then escalating to mine blockades.
Historical experience shows that even partial blockades can drive tanker insurance premiums up by over 900% and increase transportation costs by 50-100%. Current ultra-large crude carrier (VLCC) freight rates have risen 22% from last month, with many shipping companies evaluating routes around the Cape of Good Hope, which would extend Asian crude oil arrival times by 15-20 days.
(2) Supply Side: Production Increase Plans Meet Geopolitical Storm
Although OPEC+ plans to continue increasing production by 411,000 bpd in July, market focus has fully shifted to Middle East supply disruption risks. Iran currently maintains exports of 1.1 million bpd, but if the conflict escalates, this figure could drop to zero within 48 hours. More crucially, alternative export channels for Saudi Arabia, the UAE, and other countries (such as the East-West Pipeline) have a total capacity of only 3.5 million bpd, unable to fully compensate for the shortfall from the Strait of Hormuz blockade.
U.S. shale oil also can't solve the urgent problem: although production just hit a record 9.33 million bpd, labor shortages and rising drilling costs have caused new well investments to fall by 12%, and analysts expect production growth to slow to below 3% in the second half of the year.
(3) Demand Side: Risk Aversion Overshadows Real Weakness
Despite U.S. gasoline demand hitting a five-year seasonal low and European imports falling 5.1% year-on-year, geopolitical risks have triggered panic buying. The near-month contract price of Shanghai crude oil futures jumped 12% this week, and the SC-WTI spread turned to a premium of $3.16/bbl for the first time, reflecting Asian market concerns about regional supply disruptions. More notably, Brent crude net long positions have increased to a ten-week high, with speculative funds wildly betting on geopolitical premiums.
Analysis of crude oil trend next week, hope it helps you
USOIL buy@74~74.5
SL:72
TP:75.5~76.5

$OIL - Strait of Hormuz closure = $120 a Barrel. MARKETSCOM:OIL - Strait of Hormuz closure = $120 a Barrel. 🛢️
~20% of global oil passes through the Strait of Hormuz. (near Iran)
→ That’s over 17 million barrels per day (2023 data).
If Strait of Hormuz get closed or war escalates in this area, I'm expecting MARKETSCOM:OIL to sky-rocket to $120 a barrel.
Weekly Break-out + Hammer candle confirmed. ✅
What's your prediction? Will the war escalate and create global oil disruption?

Analysis of crude oil trend next week, hope it helps you I. Next Week's Crude Oil Trend Analysis
(1) Supply Side: Gas Stations Signal Shortages, but Refineries Keep Pumping More
The supply dynamics present a paradox. OPEC+ is like a massive refinery deciding to continue increasing crude oil production by 411,000 barrels per day in July, marking the third consecutive month of output hikes. Strangely, however, U.S. gas stations (crude oil inventories) saw a sudden sharp drop in supplies last week—ending June 13, inventories fell by 11.473 million barrels, the largest decline since November last year. A closer look reveals that refineries produced more gasoline, with inventories jumping by over 5 million barrels, indicating robust oil refining but weak consumer demand for gasoline, suggesting a supply glut.
Additionally, U.S. shale oil wells may be facing headwinds. Reports suggest that U.S. shale oil production might peak in the second quarter of this year and then gradually decline in the second half. This is analogous to farmers planting fewer crops when vegetable prices are low—oil wells reduce extraction when oil prices are deemed unprofitable.
(2) Demand Side: Summer Arrives, but Where Are the Fuel-Hungry Cars?
Logically, with summer in the Northern Hemisphere, more people driving for trips should mean a peak season for gasoline demand. But reality shows U.S. gasoline demand has dropped to its lowest level for this period in five years, akin to an ice cream shop seeing fewer customers in summer. Europe’s situation is grimmer, with crude oil imports down 5.1% year on year, as they aggressively develop clean energy like wind and solar power, reducing dependence on oil.
There’s also the U.S. dollar factor. Although the dollar weakened slightly last Friday (the U.S. Dollar Index fell 0.16%), it remains relatively strong overall. This is like shopping where the price tag stays the same, but your money buys less, making purchases feel costlier. As a result, other countries may cut back on U.S. dollar-denominated crude oil purchases.
Analysis of crude oil trend next week, hope it helps you
USOIL sell@74.5~75
SL:76
TP:73.5~73

WTI USOIL WEEKLY CHARTKey Offshore Oil and Gas Installations at Risk of Iranian Attack
Based on recent escalations and Iran's retaliatory capabilities, the following offshore installations are most vulnerable:
Strait of Hormuz Infrastructure
Why at risk: A critical global chokepoint handling 21 million barrels of oil daily. Iran has repeatedly threatened closure if provoked.
Potential targets: Tanker routes, underwater pipelines, and monitoring stations.
Qatar’s North Field Gas Facilities
Why at risk: Directly adjacent to Iran’s South Pars field (recently attacked by Israel). Shared reservoirs mean disruptions could cascade.
Vulnerability: Iran could target Qatari platforms to amplify global gas shortages.
Saudi/UAE Offshore Fields
Key sites:
Saudi Arabia’s Safaniya (world’s largest offshore oil field).
UAE’s Upper Zakum oil field.
Why at risk: Iran views Gulf states as Israeli allies; striking them would disrupt U.S.-aligned economies.
Israeli Mediterranean Gas Rigs
Leviathan and Tamar fields:
Provide 90% of Israel’s electricity.
Already targeted by Iranian proxies (e.g., Hezbollah rockets in 2023).
Bahrain/Kuwait Offshore Facilities
Strategic value: Proximity to Iran enables rapid drone/missile strikes. Past attacks (e.g., 2019 Aramco) demonstrate capability.
Why These Targets?
Retaliatory logic: Iran’s energy infrastructure (e.g., South Pars) was damaged by Israeli strikes. Targeting adversaries’ assets aligns with its "escalate to deter" strategy.
Global leverage: Disrupting Hormuz or major fields could spike oil prices 30–50%, pressuring Western governments.
Technical feasibility: Iran’s naval drones, cruise missiles, and mines can penetrate offshore defenses.
Immediate Threats
Target Risk Level Potential Impact
Strait of Hormuz Critical Global oil prices surge; 20% of LNG shipments halted
Qatar’s North Field High 10% of global LNG supply disrupted; Europe/Asia energy crisis
Israeli Gas Rigs High Israel’s energy security crippled; regional conflict escalation
Conclusion
Iran’s most likely retaliation targets are offshore installations in the Strait of Hormuz, Qatar, and Israeli Mediterranean fields, leveraging proximity and asymmetric tactics. Such attacks would aim to inflict maximum economic damage while avoiding direct confrontation with the U.S. or NATO. Global energy markets face severe disruption if hostilities escalate further.
A successful breakout above this descending trendline and resistance zone (near $74–$75) would confirm a bullish reversal, potentially opening the way for further upside toward $80 and $100 as next target.
US crude inventories have declined recently, reducing oversupply fears and supporting prices.
Global oil demand is forecast to grow by 720,000 barrels per day in 2025, while supply increases are more modest.
OPEC+ decisions to maintain production cuts or limit increases have also contributed to price support.
Summary
Oil prices are testing and potentially breaking out of a long-term descending trendline formed since mid-2022.
breakout will be long buy hope that we see 80$ per barrel.
#usoil #oil

Diversion def high_accuracy_signal(df):
df = df .rolling(10).mean()
df = df .rolling(50).mean()
df = compute_rsi(df , 14)
df = df .rolling(5).mean()
df = (
(df > df ) &
(df > 55) & (df < 70) &
(df > 2 * df )
)
return df [ ]
def compute_rsi(series, period=14):
delta = series.diff()
gain = delta.where(delta > 0, 0)
loss = -delta.where(delta < 0, 0)
avg_gain = gain.rolling(period).mean()
avg_loss = loss.rolling(period).mean()
rs = avg_gain / avg_loss
rsi = 100 - (100 / (1 + rs))
return rsi

USOIL: Strong Bearish Sentiment! Short!
My dear friends,
Today we will analyse USOIL together☺️
The in-trend continuation seems likely as the current long-term trend appears to be strong, and price is holding below a key level of 73.969 So a bearish continuation seems plausible, targeting the next low. We should enter on confirmation, and place a stop-loss beyond the recent swing level.
❤️Sending you lots of Love and Hugs❤️

WTI POSSIBLE TRADE SETUPPotential Trade Setup on WTI
WTI has been on a strong 2-week rally, following the geopolitical escalation where Israel launched a preemptive attack on Iran. This event sparked a 2% surge, keeping prices hovering around $77 for the past two weeks.
Despite the bullish momentum, I am anticipating a healthy pullback before looking to engage.
My eyes are on two key zones:
- April High Region (Previous resistance turned support)
- 50% Fibonacci Retracement (Measured from recent rally low to high)
🧭 Trading Plan:
1. BUY: is currently the only play, and as I anticipate for a two-level of pullback on the 4H chart.
🟢 Risk-to-Reward:
Targeting 1:3 R/R on either entry.

Analysis of crude oil trend next week, hope it helps youNext Week's Crude Oil Trend Analysis
(1) Price Movement and Market Sentiment
The crude oil market on last Friday (June 21) resembled a roller coaster that slightly dipped at the end. WTI crude oil futures closed at $74.93 per barrel, down 0.28% from the previous day, but still up 2.67% for the entire week; Brent crude oil fell more, dropping 2.33% to close at $77.01 per barrel. This is analogous to driving uphill, slightly sliding back near the peak but still trending upward overall. Investors now have mixed feelings: while worrying that escalating Middle East tensions will push oil prices higher, they also believe the U.S. may not intervene in the conflict immediately, so oil prices may not rise temporarily. As a result, everyone is on the sidelines, hesitant to trade.
(2) Geopolitics: Where is the Switch on the Powder Keg?
The Middle East is now like a barrel filled with gunpowder, and whether the U.S. will throw a match has become crucial. Israel and Iran are still attacking each other—Israel bombed Iran's gas fields, and Iran struck Israel's refineries. More tensely, the U.S. said it would decide whether to join the conflict in the next two weeks, and five aircraft carriers have already headed to the Middle East, like placing a lighter beside the powder keg, ready to ignite the fire at any moment. However, the market thought the U.S. might not take action immediately last Friday, so oil prices fell slightly first.
There is also the critical Strait of Hormuz. Iran has been threatening to block it. If it actually does, 20% of global maritime crude oil transportation will be affected, and oil prices may soar like a rocket. Now the market is like watching a suspense movie, not knowing when Iran will press the "blockade" button or talk about a ceasefire with Europe.
Next week's crude oil market will swing between geopolitical risks and supply-demand changes. If Middle East conflicts ease, the impact of OPEC+ production increases may emerge, and oil prices may fall; if conflicts escalate, especially if Iran blocks the Strait of Hormuz, oil prices may rise sharply. Investors should flexibly adjust their trading strategies according to the actual market conditions and not stubbornly adhere to one view. At the same time, it is necessary to stay calm, not be affected by short-term market fluctuations, and avoid making impulsive trading decisions.
Analysis of crude oil trend next week, hope it helps you
USOIL sell@74.5~75
SL:76
TP:73.5~73

Weekly crude oil chart shows continued bullish outlook.Last week's candlestick chart closed with a strong bullish candle at the channel's upper boundary. This week's close formed a pin bar.
Two consecutive weeks of candlestick patterns.Creating a Harami pattern
Strong bullish signals
Patiently observe market developments.

Analysis of crude oil trend next week, hope it helps youThe Middle East currently resembles a barrel filled with gunpowder, ready to explode at any moment. Israel and Iran continue to attack each other—Israel bombed Iran's nuclear facilities, while Iran fired missiles at Israeli cities. More worryingly, the U.S. may decide to join the conflict within the next two weeks, and five U.S.-UK aircraft carriers are converging on the Middle East, akin to lighting a match beside the powder keg. However, Iran has also held talks with European nations in Geneva, stating that if Israel halts its attacks first, it is willing to discuss nuclear issues. This creates a paradox: while the risk of war grows, there is also hope for negotiations—similar to two market factions, one fearing war will drive oil prices higher, and the other believing talks could push prices down.
The Strait of Hormuz, a critical global oil transport corridor, sees massive oil shipments pass through daily. Iran has repeatedly threatened to block the strait, and if it does, oil prices could skyrocket like a rocket. So far, however, Iran has not taken such action, and the market is watching closely to see if it will.
Trading Strategy
If oil prices rebound to the $74.5–$75 range and candlestick charts show prices stalling (forming consecutive long upper shadows) with trading volume decreasing rather than increasing, consider opening light short positions with 25% of funds. When prices retreat to $73.5, close 40% of short positions to take profits. If prices continue to fall, hold the remaining short positions for a target of $72.5. However, if prices break through $76, immediately trigger a stop loss to prevent further losses from a potential upward trend.
Analysis of crude oil trend next week, hope it helps you
USOIL sell@74.5~75
SL:76
TP:73.5~73

USOILKey Offshore Oil and Gas Installations at Risk of Iranian Attack
Based on recent escalations and Iran's retaliatory capabilities, the following offshore installations are most vulnerable:
Strait of Hormuz Infrastructure
Why at risk: A critical global chokepoint handling 21 million barrels of oil daily. Iran has repeatedly threatened closure if provoked.
Potential targets: Tanker routes, underwater pipelines, and monitoring stations.
Qatar’s North Field Gas Facilities
Why at risk: Directly adjacent to Iran’s South Pars field (recently attacked by Israel). Shared reservoirs mean disruptions could cascade.
Vulnerability: Iran could target Qatari platforms to amplify global gas shortages.
Saudi/UAE Offshore Fields
Key sites:
Saudi Arabia’s Safaniya (world’s largest offshore oil field).
UAE’s Upper Zakum oil field.
Why at risk: Iran views Gulf states as Israeli allies; striking them would disrupt U.S.-aligned economies.
Israeli Mediterranean Gas Rigs
Leviathan and Tamar fields:
Provide 90% of Israel’s electricity.
Already targeted by Iranian proxies (e.g., Hezbollah rockets in 2023).
Bahrain/Kuwait Offshore Facilities
Strategic value: Proximity to Iran enables rapid drone/missile strikes. Past attacks (e.g., 2019 Aramco) demonstrate capability.
Why These Targets?
Retaliatory logic: Iran’s energy infrastructure (e.g., South Pars) was damaged by Israeli strikes. Targeting adversaries’ assets aligns with its "escalate to deter" strategy.
Global leverage: Disrupting Hormuz or major fields could spike oil prices 30–50%, pressuring Western governments.
Technical feasibility: Iran’s naval drones, cruise missiles, and mines can penetrate offshore defenses.
Immediate Threats
Target Risk Level Potential Impact
Strait of Hormuz Critical Global oil prices surge; 20% of LNG shipments halted
Qatar’s North Field High 10% of global LNG supply disrupted; Europe/Asia energy crisis
Israeli Gas Rigs High Israel’s energy security crippled; regional conflict escalation
Conclusion
Iran’s most likely retaliation targets are offshore installations in the Strait of Hormuz, Qatar, and Israeli Mediterranean fields, leveraging proximity and asymmetric tactics. Such attacks would aim to inflict maximum economic damage while avoiding direct confrontation with the U.S. or NATO. Global energy markets face severe disruption if hostilities escalate further.
A successful breakout above this descending trendline and resistance zone (near $74–$75) would confirm a bullish reversal, potentially opening the way for further upside toward $80 and $100 as next target.
US crude inventories have declined recently, reducing oversupply fears and supporting prices.
Global oil demand is forecast to grow by 720,000 barrels per day in 2025, while supply increases are more modest.
OPEC+ decisions to maintain production cuts or limit increases have also contributed to price support.
Summary
Oil prices are testing and potentially breaking out of a long-term descending trendline formed since mid-2022.
A confirmed breakout above the $74–$75 resistance zone would mark a bullish reversal, supported by tightening supply, geopolitical risks, and improving demand.
Traders should watch for confirmation signals and potential corrective pullbacks before further upside.
Failure to hold above key support levels could resume the downtrend.
#usoil #oil

Crude Oil BreakoutOil has been in a descending wedge pattern for quite a while, the last 19 months or so. It is just now breaking out, price target is between $100-$110 a barrel but could go higher we will have to see how inflation progresses.

ALL EYES ON WTI Nice and simple: If this breaks up, Stocks and Crypto Dump. If this rejects, nice pump incoming...
What happens in the Strait.. will dictate all...
