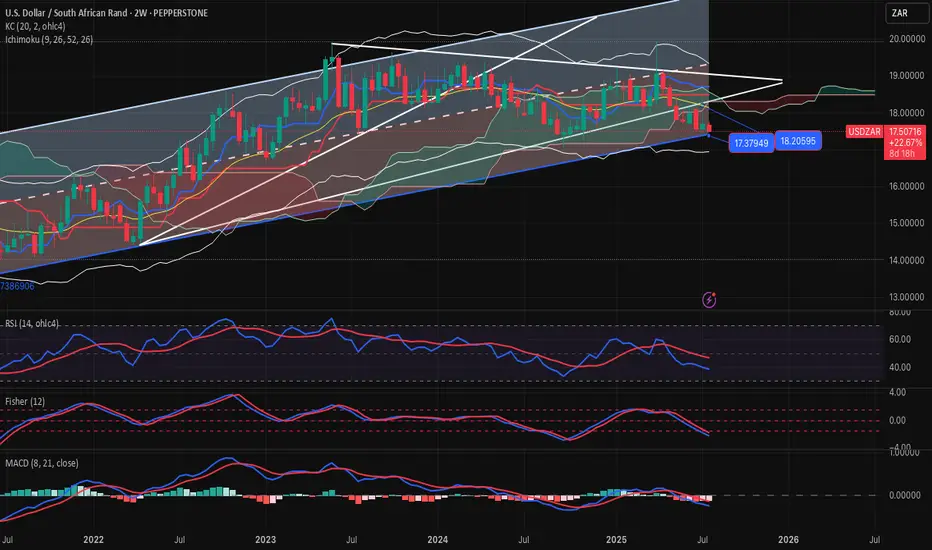
USDZAR-BUY strategy 2-weekly chart Reg. ChannelThe pair is overall on negative mode long-term basis. However, judging the bottom of the channel 17.3700 area or slightly below, BUY entry might look interesting for a recovery medium-term.
Gold is under pressure4 again and medium-term is is overbought, considering that, the pair may find benefit moving back towards 18.1000 area again.
Strategy BUY into 17.35-17.45 region for profit target 18.0975.
USDZAR trade ideas
buy then sell!Hello all. I had a time to check some other pairs as USDZAR. I don't trade this pair but for who wants to trade, I think there is a very good OPP. to go buy and sell one after another. be happy(wink)

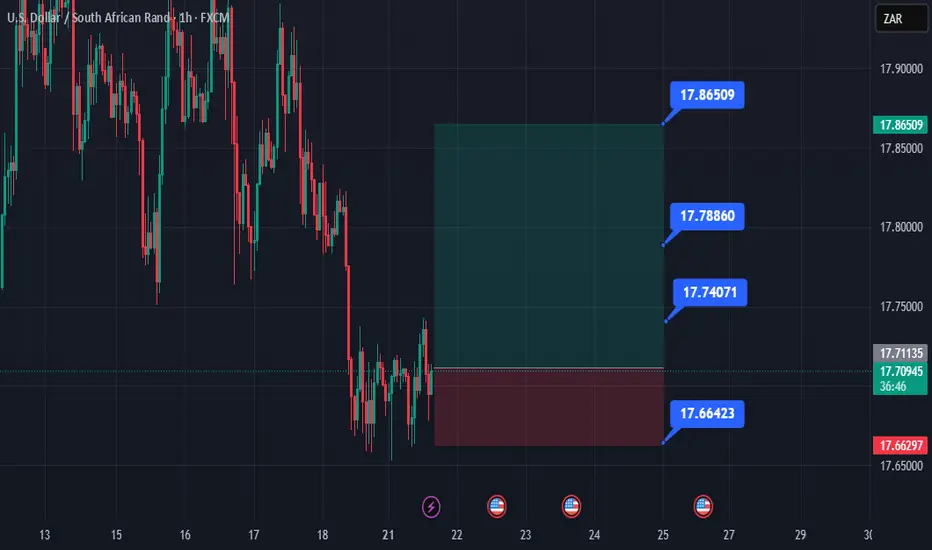
USDZAR-BUY strategy 9 hourly chart The pair is remaining to be within a larger trading band. We are in negative mode, but slightly becoming oversold. Based on the ranges we have seen, one could attempt to be in BUYING mode, but careful as always. gold is strong, but am still having the view to see recovery. Other assets(if we wish to use that term) like BTC and ETH are also overbought, and could drag gold down, hence an improvement for USDZAR over time.
Strategy BUY @ 17.6875-17.7350 and take profit near 17.8875 again.

UsdZar-Buy Scenario123 Levels, Inverse Head and Shoulders, Trendline Breakout and retest, Bullish Pennant Formation

A bullish reversal , price broke structure to the upside Price is currently at premium price on a bigger TF and on H4 we see bearish trend violated and retraced back to premium price range

USDZAR-BUY strategy - RANGE 3 hourly chartThe pair is still within a wider range, and it feels we may remain so for a little longer. The direction feels moving higher again with cloud suport 17.7300 area, and i mproving indicators.
Strategy BUY @ 17.7875-17.8350 and take profit near 17.9875 for now.
USDZAR Bullish ideaAs we can see this is our USDZAR quarterly shift idea were we are anticipating price to rally to the upside toward our draw on liquidity objectives. We had a weekly volume imbalance and monthly mean threshold order block show us support after we took out major liquidity points. We also showed more support on our daily FVG and a market shift taking place after a displacement. We are anticipating a rally for USDZAR and will be looking to see how price plays out.
USDZAR is an exotic pair that is part of the emerging markets and emerging markets/exotic pairs can usually lead ahead of major forex pair or lag between major forex pairs so this can also help us with our intermarket analysis of forex pairs when determining our dollar strength against other basket currencies.

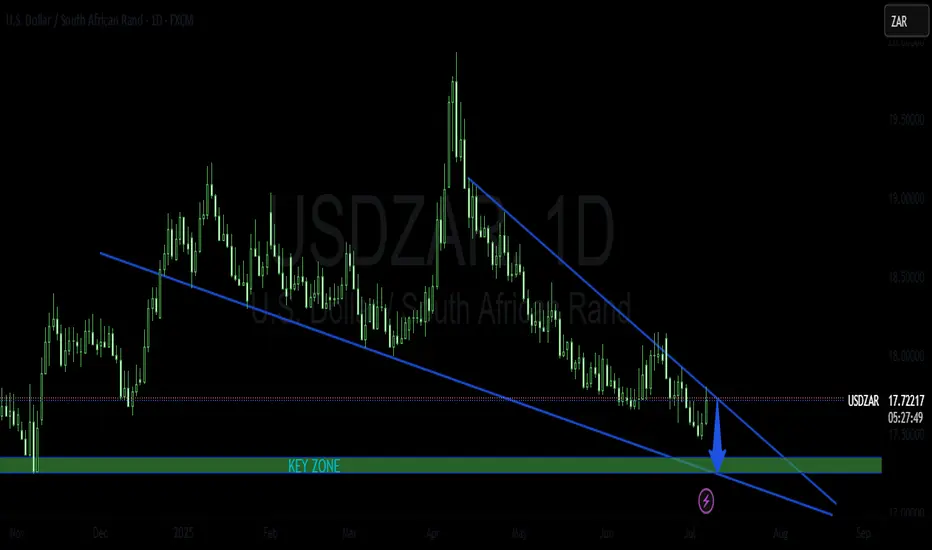
USDZAR Support CallingUSDZAR will short towards the support area at 17,73. Currently price is showing strong bearish reversal signs. Sells active from 19,91 to 17,73


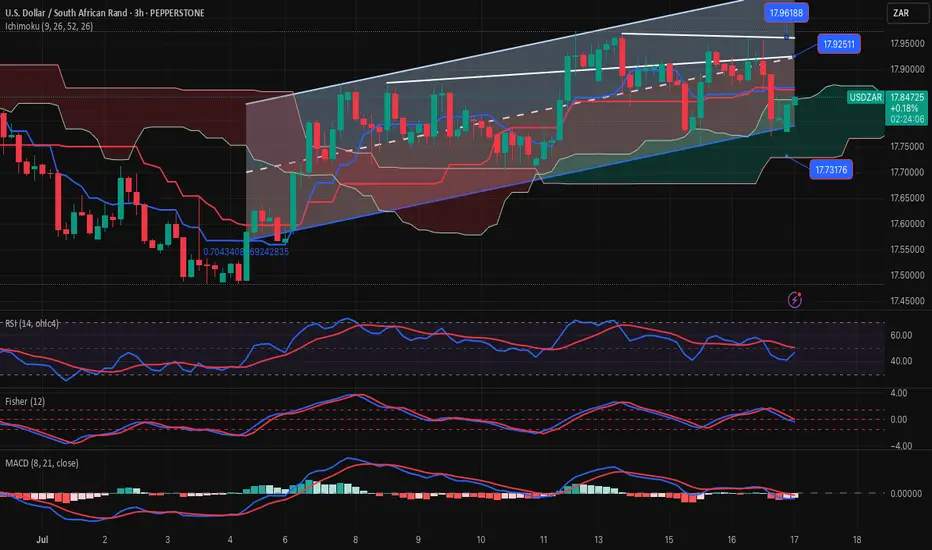
USDZAR-BUY strategy 3 houely chart Reg. ChannelThe pair seems to show some strength, and think we have a chance to test 17.9150 again in the short-term. The indicators provide support as long as 17.6900 is not violated on a close.
Strategy BUY @ 17.7350-17.7550 and take profit near 17.8875.

USDZARSpeculators are still net-long USDZAR, but the position is shrinking.
This suggests weakening bullish conviction → early bearish shift.
Broad USD weakness across markets (possible Fed dovishness, softer inflation, etc.).
mproved sentiment for emerging markets.
Possible support from commodities and local rate differentials. So we very bearish.
This is what 30 years of ANC government gets youWhile the ANC fills its pockets, the electorate are either too dumb or too desperate to notice. Corruption cover-up after corruption cover-up continues to blight the country.
Expect 26-28 USDZAR by 2028.

Rand Pressured but Potential Recovery on the HorizonThe U.S. Dollar Index (DXY) strengthened to 97.80 following President Trump’s announcement of sweeping new trade tariffs, including a 35% levy on Canadian imports set to begin August 1, and additional blanket duties on several other nations. This added to bullish dollar sentiment already supported by yesterday’s labour market data showing a seven-week low in U.S. unemployment claims.
With no immediate pressure on the Federal Reserve to cut interest rates, the greenback remains the currency of choice for risk-off flows. This renewed strength is placing emerging market currencies under strain, particularly the South African rand.
USD/ZAR climbed sharply, touching the 17.80 handle as investors reacted to the potential for South Africa to be included in the next wave of U.S. tariffs, possibly as high as 40%. However, local fundamentals suggest a possible reversal.
Recent South African manufacturing data beat expectations, and diplomatic engagements between President Cyril Ramaphosa and U.S. officials are providing a counterweight to the tariff headlines.
Technical View (USD/ZAR):
The currency pair is currently range-bound in a sideways channel. A breakout above resistance at 18.05 would likely extend dollar gains, while a move below 17.60 could open the door to a short-term rand recovery. Traders should be cautious and watch for clear directional confirmation.

USDZAR SELLSUSDZAR price is stuck in consolidation. Price action has printed a triple top pattern indicating a strong sell signal towards the support at 17,74

USDZAR-BUY strategy Daily chart GANNThe short-term shows some weakness, but some of the models I use, provide support for higher levels. The daily chart shows we may see a move back towards 18.0400 CLOUD area.
Strategy BUY @ 17.7350-17.7650 and take profit @ 18.0250 for now.

USDZAR-SELL strategy 3 Hourly chart GANNThe pair has some resistance near 17.8500 area, and we are little negative for some indicators. The move lower will be minor and should not carry high expectation of large decline. I think we are building towards sharper move higher in the medium0term.
Strategy sell @ 17.7850-17.8350 and take profit near 17.6750.

USDZAR SHORT TRADE PLANThe pair has been trading inside a bearish trend. It recently tested the boarder of the descending wedge pattern and from this point I will be looking for the reversal.
Please do your own analysis before placing any trades.
Cheers and Happy Trading !!!
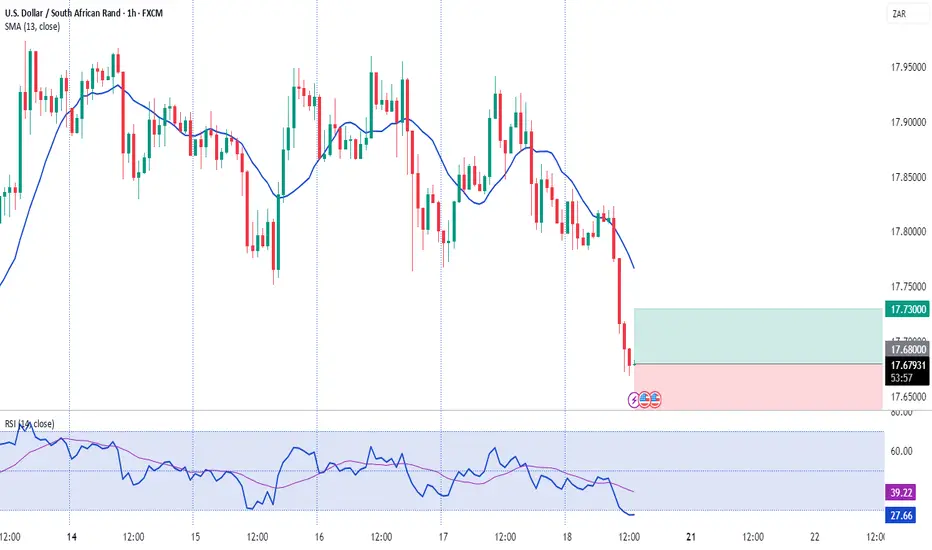
USDZAR-BUY strategy 3 hourly chartThe pair was not able to move lower, and broke 17.6400 area instead. The issue was negative environment, and a descending wedge warning of move higher over-time. The move lower did not happen within the wedge. Gold also moved lower helping weakening of the ZAR.
Now the picture is near overbought state, but we should keep focus on BUY side lower. I feel maybe near 17.6750 -17.6900 is the buying zone for now.
Strategy BUY @ 17.6450-17.6900 and take profit near 17.8250 for now.

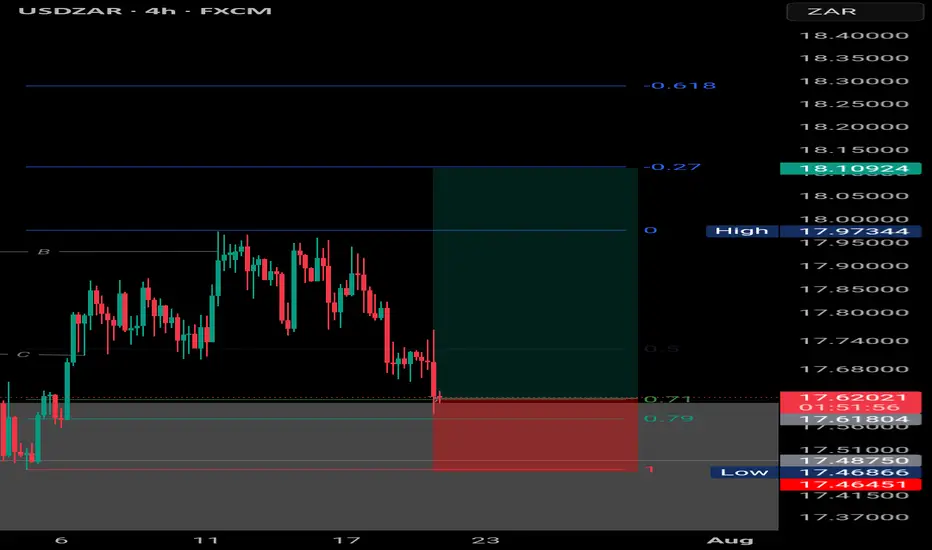
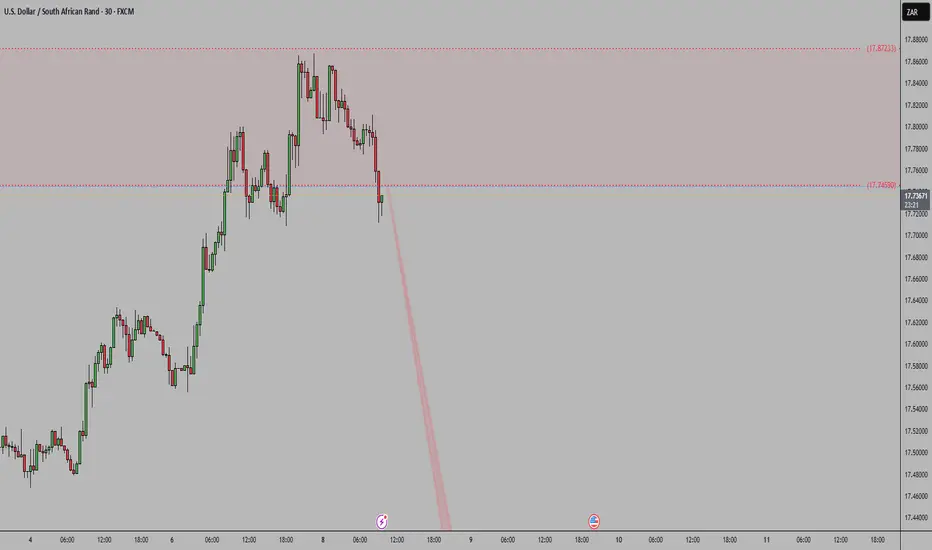
USDZAR-SELL strategy 6 hourly chartThere is selling pressure within a descending wedge, which means over-time we will see recovery. For now though short-term time frames are negative and likely we may see 17.4500 test.
Strategy SELL @ 17.5500-17.5975 and take profit near 17.4500.

USDZAR: Sell Trigger on 4HGood morning and happy weekend everyone,
today I bring the chart of the UsdZar pair which shows a sell trigger via my LuBot Ultimate indicator which goes in favor of the short-term trend and the bearish market structure, both on the 4H and on the Daily, highlighted by the color of the candles in red.
The signal is also confirmed by the reversal signals shown above and a close below the previous 2 candles.
The indicator automatically shows exit levels that I will follow for my trade as the stop loss is far enough away to give the market room to breathe if it needs it and to avoid unnecessary stops. Stop which will subsequently be approached if the market moves in the direction of the trade.
The take profit is at the right distance given that we are close to a support zone indicated by the green area of the indicator.
Finally, the EVE indicator below has not shown any major excesses of volatility so we could still expect a strong movement before a possible reversal.
FX:USDZAR FOREXCOM:USDZAR SAXO:USDZAR FX_IDC:USDZAR OANDA:ZARJPY OANDA:EURZAR OANDA:GBPZAR OANDA:CHFZAR SAXO:AUDZAR SAXO:NZDZAR
