USDZAR-BUY strategy 4-HourlyThe pair is locked in within a range of 18.6800-18.9500 for now. We should be playing this accordingly, and since GOLD is trading around 1,924, we may see some ZAR weakness in coming sessions.
Strategy BUY @ 18.7000-18.7300 and take profit @ 18.9150 for now. SL let's say near 18.6500 below.
USDZAR trade ideas

USDzar shortinterval:30 min
time identified: 16:22 (UTC+2)
DESCRIPTION:
we are seeing a possible downward move on the usdzar for the next 2000 pips. we had a bullish break from a recent rectangular range, we broke the bearish trendline but we are still confident that this is still a bearish move and that we were just experiencing a pullback . we still below the 200 ema

USDZAR ForecastThe bullish bias is still in play, and the A-B-C zigzag correction retraced relatively deep to close to 78,6. We have an invalidation level for the bullish bias key to focus on it.

September 22nd: A watchlistHere is the watchlist for today:
EURUSD M30 we have a 123 formed which is currently trading in the red zone if entered, for now you may wait for price to trade back up above the neckline or wait for the H1 123 that is possibly forming now.
NZDUSD M30 there is a GS formed, we are currently waiting for price to approach +1R if this was entered.
EURAUD M30 we have a 123 formed, the neckline is very low.
EURGBP M30 we have a 123 formed, the neckline is very low.
GBPJPY M30 we have a 123 formed with an mcc.
AUDCAD M30 we have a H&S formed, its not the most symmetrical.
NZDCHF M30 we have a possible GS forming.
Thats it from my side, no more trades form this afternoon. Happy hunting

USDZAR ↗️ ↘️Hello everyone,
We are waiting for now for a breakout to down from the price 18,80550
or to continue raising to the up from the price 19000
please like comment and follow to support us.

#USDZAR needs a close below 18.80 for further strengthUSDZAR has held the 18.80 support level for now but the long upper tails over the 19.00 level shows the rand bulls in control of price action for now. A daily close below 18.80 should bring about levels of 18.60 and 18.40. 200dma sits at 18.26 and the pair has a tendency to mean revert back to the 200dma before finding support in the recent past.

USDZAR-SELL strategy 4 HourlyI feel we are still in a don trend and as long we manage to remain below GANN 19.0300 area, the pressure should be downside.
The base line is positive but same time we are below CLOUD as well.
Strategy SELL @ 18.9300-18.9750 and place stop-loss @ 19.1200 (based on a model I had build and let's see if it makes sense). Profit order @ 18.6700 for now.

USDZAR Long Supply And Demand Trade Setup-Price broke uwpard ML
-Price removed opposing pivot supply
-DBR created
-Valid 1TF swing or use 4hr demand
as HTF and wait for new LTF conf day-trades.
-Spread will be wide + comossions high...
Ideally not for most traders.

Buy on USDZAR - Possible movehi guys hope you well. Has been a while.
USDZAR BUY. Possible move to the upside. Good luck.
Please note: THIS IS NOT FINANCIAL ADVISE. TRADING IS RISKY AND YOU CAN LOSE YOUR CAPITAL.


USDZAR: some rand weakness?A price action above 18.95 supports a bullish trend direction.
Increase long exposure for a break above 19.25.
However, the ideal entry is close to the 50% Fibonacci retracement level.
The target price is set at 19.60.
The stop-loss price is set at 18.65.
Remains a risky trade.

USD/ZARHi everybody when i see the usd/jpy and usd/zar i get from them that maybe we can see the diminishing in dollar value and rising in precious metals price (south africa most income is from exporting precious metals) okay may it makes you weird but that is the reality .....ther is no alternative for fed to avoid from printing money again......
Gooooood luuuuuuck

USDZAR Ascendıng trıangle Hello Everyone we are tradıng now thıs ascendıng channel untıl waıtıng for a breakout
the breakout from the up or down from thıs channel,
the breakout suppost to be to downtrend 18.500 or to uptrend on the 19.300 after retesting it on that price,
until that time we have a trade with the ascending triangle
Set the \TP : 19.300
SL : 18.900
Please support us with a like comment and follow and thank you

USDZAR SCALP SELLThis is just a quick scalp sell to start the week off. I know, I know; it's a counter trend trade....but I'm 98% sure that this trade will hit tp. Might even have a 3rd entry between 19.10-19.18 zone. Happy Trading!!

USDZAR ForecastThe USDZAR seems ready to be bullish, no long ago we anticipated a correction for wave (2) which then occurred and traded to a 50% Fibonacci retracement.
The upside will last a lot longer we can expect it to break the previous high with a Fibonacci projection of 1.61.8 as that is common for wave 3s to extend to that level.

USDZAR long tradeis it trying to pull back to long. push the resistance zone and going up immediately.


USDZAR-SELL strategyThe pair is revolving around GANN support 18.8400 area, and for now, our previous shorts may be aborted and SELL again in the range of 18.8900-18.9500. This is a personal decision to make.
The stochastic is negative as well as the RSI, and pressure is likely to remain because of that.
Strategy SELL @ 18.9250-18.9700 and place stop-loss above 19. 0800 for now. Profit order Q@ 18.7850.

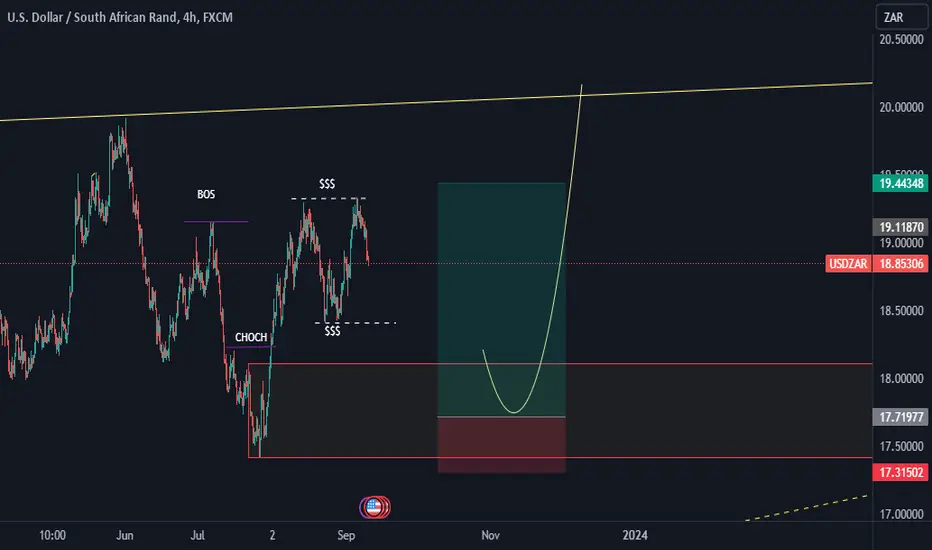
USDZARUSDZAR
sentiment Bullish for the week liquidity below needs to be collected below price goes higher
wait for demand to be collected before going long
USDZAR BUYUSDZAR price drops sweetly to newly established support at 18.85 early this week 11-15 September. Price recently broke out a bullish channel and this looks to me like a retest. Now would be a good time to buy and exploit the possible weekly and monthly pullback.

USDZARUSDZAR is set to continue with its uptrend following the inverse head and shoulder on the daily timeframe

USDZAR ANALYSISHello guys, this particular pair has been carefully analyzed and awaiting a pullback and confirmation for buys ..
I will only be interested in SHORT if price breaks the demand zone creating a new low with visible confirmation
GOODLUCK!!

USDZAR-SELL strategy daily chartThe pair starts showing a direction towards the south. The GANN fan provides resistance @ 19.2200 and 19.3350 area (trend line resistance).
The stochastic is negative, and this suggest lower levels to be seen.
Strategy SELL or remain or add short @ 19.1500-19.2100 and place stop-loss above 19.3350.
Profit order near 18.7300 but monitor 18.8700 support.
