UPDATE I was wrong with USD/ZAR - Now it's undecidedWith trading it's not about certainties but probabilities.
And in this case I was soo optimistic about the rand breaking its Inverse Cup and Handle and heading to R16.50.
But instead the USD/ZAR rallied to R19.74.
Apart from the negativity kicking in with the US, there is one thing I didn't really consider. And that is the US Dollar is going to hurt - no doubt.
But the rand and emerging economies will more likely hurt even worse. Because despite it all we still follow the big boys (DOw, SP500, UK100)
Hence when the US sneezes, the world catches a cold.
But then we have other reasons for the rand weakening
1. 🗳️ Political Uncertainty in SA
Coalition tensions and governance concerns are making investors nervous, pushing money out of SA.
2. 📉 Lower SARB Interest Rates
South Africa cut rates again, making the rand less attractive to yield-seeking investors.
3. 🌍 Global Risk-Off Mode
Traders are fleeing emerging markets amid global tensions—hurting the rand, boosting the dollar.
4. 💼 Weak SA Economic Outlook
Low growth, high unemployment, and power issues reduce confidence in South Africa’s economy.
5. 🇺🇸 Stronger Dollar Demand
U.S. dollar gaining strength globally due to safe-haven demand and higher relative rates
So, yes - We are seeing some rand strength now and we are back to R18.88.
We will need to wait for the next formation before we make any deductions on where it is likely to go.
It could break up with the Falling Flag and run up to R20.00.
Or it could stabilise and form an Inverse Cup and Handle again and drop to R17.50.
We need to wait and see. I can't always post my winners - or else I wouldn't be an actual trader.
Disclosure: I am part of Trade Nation's Influencer program and receive a monthly fee for using their TradingView charts in my analysis.
USDZAR trade ideas

USDZAR-NEUTRAL BUY 3 hourly chart regression channelThe move lower was expected and I have exited 19.0000 when it tested. it went further south, and this is normal behavior, but I feel comfortable to exit and remain on side lines cuerrently with the pair. If one wishes to trade:
1. strategy BUY near 18.8850 - 18.9100 and take oprofit near 19.0450
2. strategy SELL @ 19.0500-19.1150 and take profit near 18.8750 for now.

USDZAR-SELL strategy 12 hourly RegressionI was unable to update my yesterday's SELL idea, but overall no change to the believe that should continue to see a proper correction in the short-term.
Strategy SELL @ 19.3000-19.6000 (wide ranges of course) and take profit near 19.0275 for now.

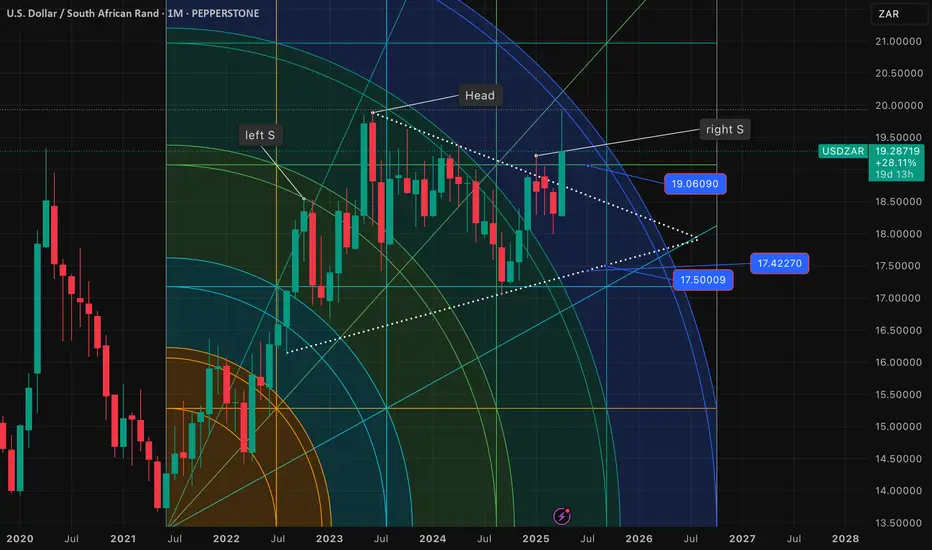
USDZAR-SELL strategy Monthy chart GANN SQSome weeks back I had posted a monthly chart with a viewpoint of a likely S-H-S top formation, and that at that time the right shoulder still suggested we would see 19.3500 or more. Now we have formed this right shoulder pattern, and likely some more consolidation adding to the shoulder.
The overall view is long-term a larger decline to unfold and a break of the neck line (shown) may translate to 15.3000 objective roughly. so for those trading long-term, and have deep pockets, this may be an interesting pattern to look at.
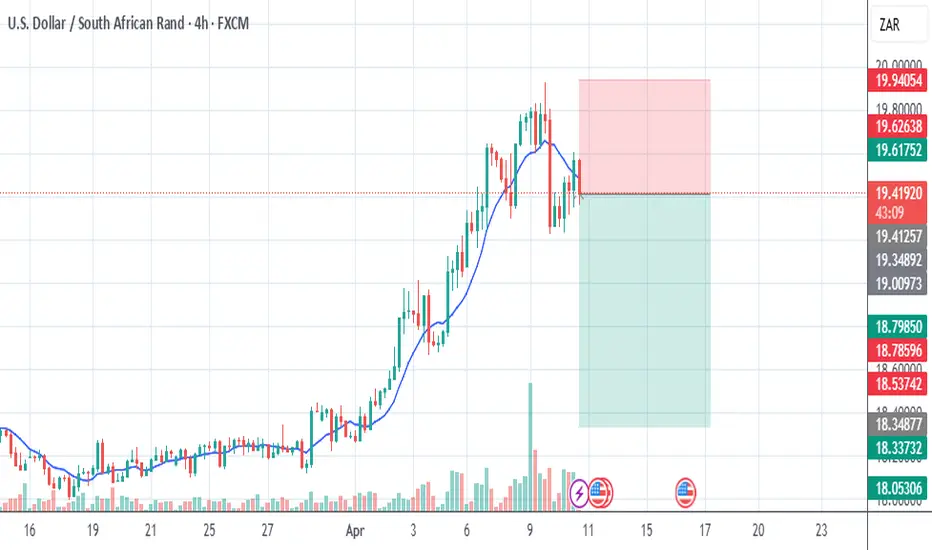
USDZAR-SELL strategy 3D chart KCThe pair's range has been large, and judging the regression channel, we should see reasonable move lower over time. For now, there is still upward pressure existing, but if we are able to remain or sell between the 19.45-19.65 range, eventually a return to mid-channel level 18.9500 seems feasible.
Strategy SELL @ 19.4500-19.6500 and take profit near 18.9750.

usdzar sell tradeThe Relative Strength Index (RSI) is showing a downward trend, indicating weakening momentum. Additionally, the Moving Average Convergence Divergence (MACD) is showing a bearish crossover, further supporting the potential for a downward move
USDZAR bearish setupUSDZAR has met a solid resistance after a quick climb to 19. Level. Price should try to retest 19.65 as a nearest resistance, before it continues to dump

USD/ZAR Poised for a Strong Breakout as Market Forces Align1️⃣ Key Technical Insights from the Chart
A. Wyckoff Accumulation & Support Zone
The chart suggests Wyckoff accumulation with a Spring phase (H) and Test (H) in October 2024 at the 17.80 - 18.00 zone.
This Spring phase often signals a liquidity grab, where smart money accumulates before a trend reversal.
The current price level (18.06 - 18.12) is near the support line for SC Accumulation (D), reinforcing the idea of a bullish move from here.
💡 Macro Connection:
If US inflation surprises higher (March 11 CPI), interest rate expectations shift hawkish, and USD strengthens, reinforcing the Wyckoff accumulation phase leading to an upward breakout.
If global risk sentiment worsens, USD could also see inflows as a safe-haven, confirming the upward trajectory.
B. Harmonic Pattern & Fibonacci Levels
The Bearish Gartley/XABCD pattern has completed its correction phase at Point A (~18.06) and now shows signs of reversal.
The B point rejection near 1.238 Fibonacci extension indicates exhaustion of the bearish move.
The chart suggests a bullish continuation, targeting 19.26 by March 20, 2025, based on projected Fibonacci extensions.
💡 Macro Connection:
If US Nonfarm Payrolls (April 5) and Fed Meeting (March 19) reinforce strong USD fundamentals, the technical bullish move aligns with macroeconomic data.
A rise in bond yields above 4.5% on the 10-year Treasury could confirm the expected upside.
C. Elliott Wave Structure
The chart labels a completed 5-wave impulse up followed by an ABC corrective pattern, aligning with Elliott Wave theory.
The current structure suggests the start of a new Wave 3 rally, which is typically the strongest and most extended move.
Potential upside target: 19.26 (aligning with Wave 3 extension).
💡 Macro Connection:
If March and April macro data support continued USD strength, this Elliott Wave 3 scenario could materialize.
A higher inflation surprise could extend this move to 19.50+ in the next few months.
2️⃣ Key Fundamental Factors Supporting the Bullish Scenario
🔹 U.S. Inflation & Interest Rates (March 11, March 19)
Higher CPI would delay rate cuts, strengthening USD.
Fed’s March 19 statement will confirm if rates remain “higher for longer.”
🔹 U.S. Economic Growth (March 27, April 5)
If GDP data (March 27) comes in strong, it could fuel USD gains.
Nonfarm Payrolls (April 5) will determine the labor market’s strength.
🔹 South African Economic Risks (March-April)
Load shedding worsening → Weakens ZAR.
Political uncertainty ahead of elections → Triggers risk-off flows into USD.
3️⃣ Key Trading Levels & Strategy Based on the Chart
Key Level Technical Importance Bullish/Bearish
17.80 – 18.00 Strong support & Wyckoff Spring Bullish Bounce Zone
18.50 Minor resistance Bullish above this
18.66 – 18.88 Resistance cluster (AR accumulation) Key breakout level
19.26 Harmonic projection & Fib extension Final bullish target
Trade Idea
Buy near 18.06 - 18.12 if macro factors confirm USD strength.
Confirmation: Break above 18.50 → Bullish continuation.
Final target: 19.26 by March 20, 2025.
📌 Summary: Strong Confluence Between Technical & Macro Factors
✔ Wyckoff Accumulation & Harmonic Pattern suggest reversal from 18.06-18.12
✔ Elliott Wave 3 & Fibonacci targets align with 19.26 projection
✔ Upcoming U.S. macro data supports a strong USD outlook
✔ South African risks (Eskom, political uncertainty) favor ZAR weakness

USDZAR-SELL strategy 6-hourly chart - GANN No change in view, even though markets are severe, and a lot of extreme moves. The overbought status still is valid, and I feel we will see low 19.00s again.\
Strategy SELL @ 19.4750-19.5500 (or if lucky this morning above 19.6000 which I did sell).
Take back @ 19.0750 for now (or first stop 19.1750).

USDZAR-SELL strategy 6-hourly chart GANNThe pair has spiked extremely, and now we are in a very overbought zone again.
The RSI is extreme, plus GANN angles are steep too..
Strategy SELL @ 19.3500-19.4000 and take profit near 19.0450 for now.

USDZAR medium term buyThe rand's appreciation has had a positive impact. However, the dollar index is showing some support structure and a potential direction change. SA's ties with the US comes with more uncertainty and this could have more negative impact on SA's economy. In the long run, the rand loses value and you would not want to buy the rand but hold more dollar unit denominations. Take TP at R19.0000/$1

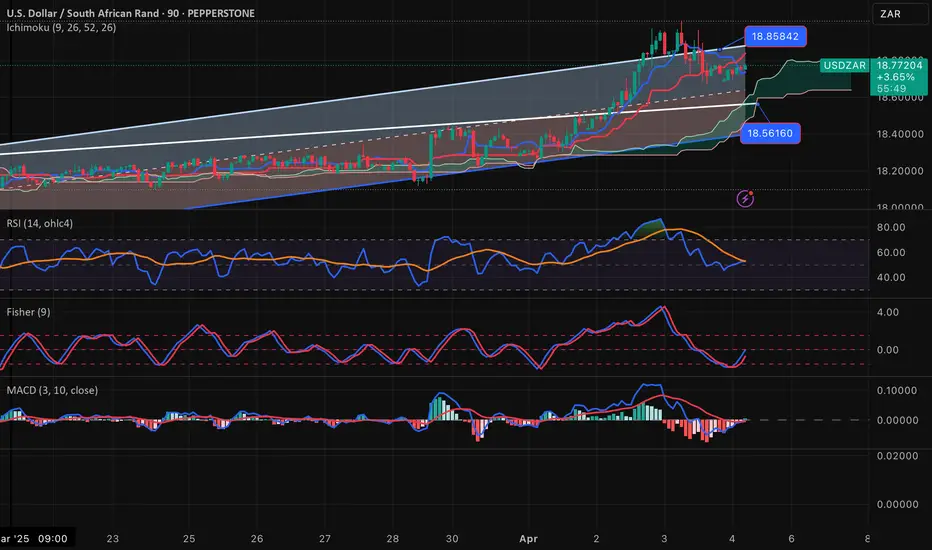
USDZAR-BUY strategy 90 Min chart Regression ChannelThe pair corrected from the lofty heights, and now we are settling around the 18.7250 -18.7500 area. I feel that we are positioning to re-test 19.00 area.
Strategy BUY @ 18.7250-18.7550 and take profit near 18.9950.
USDZAR 4H forecastProjecting an upside direction to complete the impulse sequence. We're in a 3-4-5 of a (3)rd wave. We can project a wave 5 completion. Note** waves 1 and 4 cannot overlap, so we can use wave 1 high as an invalidation level.

USDZAR ShortsUSDZAR has been climbing up rapidly this week, I would like to see price decline from around 18,95 towards 18,71.

USDZAR - SELL strategy 6-hourly chart GANN FANThe pair moved convincingly beyond 18.5300 and that was the catalyst for 18.7300 - 18.8500 area. As mentioned, I had preference on break of 18.5300 not to BUY (sad sad) but to wait for higher sell levels. I do not trade the pair all the time, and am trying to support it trying to provide ideas. Now we have reached 18.80s and RSI is now nicely confident quite extreme. Amidst the trade wars we should expect either side movements and these will be volatile no doubt.
Strategy SELL @ 18.8350 - 18.8800 and take profit near GANN support 18.6250 for now.

USDZAR-BUY strategy 3D chart Heikin AshiI am always interested looking at the other chart types, and time-frames. Short-term we may see some obstacles for the pair and corrective activity is possible. Also this chart based on 3 daily movements suggest resistance 18.5400-18.5500, and it has positive signs for much higher levels to be seen. However, we have not broken out of the range as yet.
From medium-term perspective (not long-term which suggest lower over time) we may see 18.8500 - 19.00 area based on MACD and Fisher form.
Strategy BUY @ 18.4150 - 18.4600 and take profit near 18.8050 first.

USDZAR LongUSAZAR is now net long on the regression break.
It is running into heavy resistance above. I am not taking this trade.

ALL THE TARGET REACHED ON USDZARCheck Out All My Previous Post About USDZAR.
God is good all the time,My analysis was successfully.
Let chill and enjoy the profits,Non Farm Payroll is coming up on Friday.
Let be ready to prepare it.

USDZAR-SELL strategy Monthly ChartThe pair from a long-term perspective, may be a lot lower. Reasons possibly are, ROUNDED TOP or S-H-S pattern whereby the Right Shoulder (RS) is being formed still. That is why maybe we may see a move closer to 19.0000 area before lower again. The neckline is lower 17.3500.
This translates somewhere a possible 15s handle USDZAR in the longer term. Anyway, this is just looking at the pair considering all our options.
Strategy SHORT-TERM still a BUY likely on break 18.5500 area, but SELL when right shoulder has been completed.

USDZAR-SELL strategy 9 hourly chart GANN SQThe pair trades in a very wide range, and my yesterday's ideas.. painted a lower price expectation, and this was not the case. The main issue is, we are within a very large regression channel range, and not seen here, we are at the top end of this now and even beyond it. Same as with the GANN SQ 18.4200 - 18.5300 is the current range, and lower down 18.1600 area. Needless to say, if we break convincingly 18.5300 the next target is 18.7300. For now, we are overbought (not extreme), and GOLD is lower, which also helped the pair moving higher, plus the news from SA yesterday.
We are above CLOUD support as well, adding to the BUYING mode as well.
Strategy SELL @ 18.4900-18.5300 and take profit near 18.3750 for now. If we break beyond 18.5300 would not make it a BUY per se, but a chance to SELL higher up with a more extreme overbought state, would be my strategy.

FIRST PROFIT BOOKED,USDZAR FINALLY BROKE 18:45I am now looking forward to hit 1863 as my main Target for these week.

USDZAR-SELL strategy 6 hourly chart - Regression channelThe pair has rejected 18.4100-18.4500 area (top of regression channel), and now we have settled between 18.2400 - 18.3300 area it seems. The overall picture suggests downside pressure, and for that reason I think we will move back towards 18.1350 again.
Strategy SELL @ 18.2900-18.3300 and take profit near 18.1650 for now.

USDZAR-SELL strategy 6-hourly chart - regression channelThe pair has moved lower 18.1200 area in line with SELL strategy, but fell short heavily sad to say. Thereafter, we spiked and we have finished the day with a hammer top.
The regression channel sloping down ward, shows the expected parameters, and usually a move beyond that, would trigger a move back towards the mid-range of the channel.
the 18.3850 area highlighted some days back, is significant, and it changes the scope a bit. However, for now in line with slight overbought levels and the quick spike, and being slightly above the regression channel top, suggest we may see a pullback again.
there is some dangers of higher levels due to positive indicators, and that is why patience is warranted before selling should be done.
Strategy SELL @ 18.4500 - 18.4950 and take profit near 18.2750 when seen.
