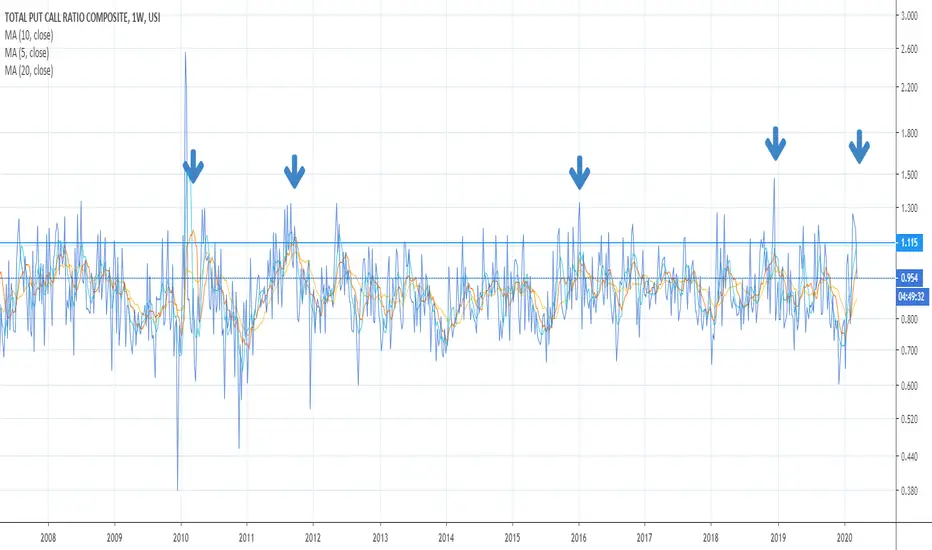
5 10 20 WK P/C NEARING A LONG TERM BUY The chart posted is one of my best tools we are close to the I.T. and LONG TERM BUY
PC trade ideas
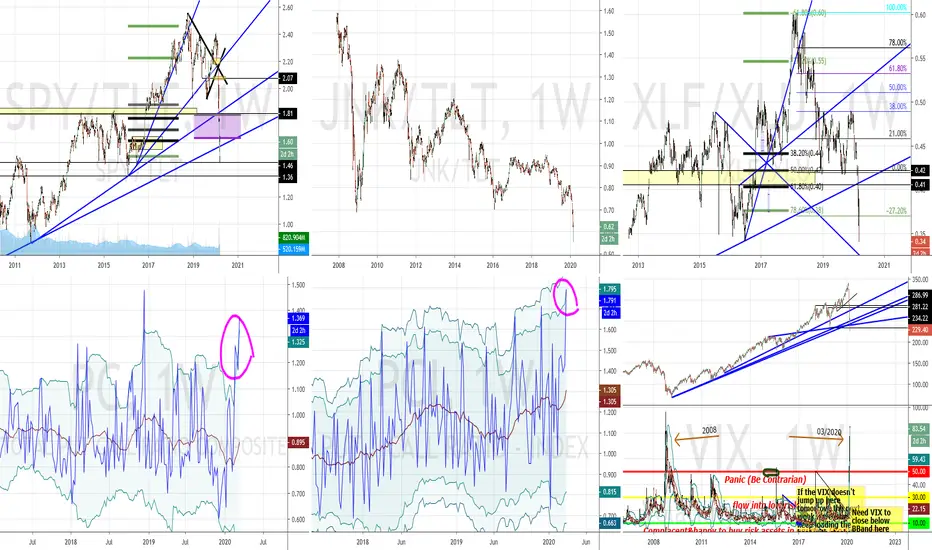
Put-Call Ratio Composite, its Index & the Vix & 2008 LevelsThe Put Call Ration and the Put Call Composite finally match. Also, the VIX is at its highest point since the 2008 financial crisis. Something to watch....
NO PUT CALL BUY SIGNAL YET BASED ON THE 10 AND 20 WK MORE PAINTHE 10 AND 20 WEEK PUT CALL IS A TOOL IN MY MODEL TO BE ON THE RIGHT SIDE FOR A GOOD TREND TRADE WE STILL HAVE NO TRIN BUY SIGNAL AS WELL DO NOT LOOK TO TO BUY ANYTHING YET I STILL HAVE THE 5 TO 7 SPIRALS DUE 3/16 TO 3/21 AND I DO NOT FEEL THAT WE HAVE 5 WAVE DOWN I STILL THING THE SP SEES 2662 TO 2627 AND IWM 121 TO AS LOW AS 108 WAIT TILL ALL THINGS COME IN . THIS WILL BE WAVE A DOWN IN A LONG TERM BEAR .WE WILL HAVE A VERY VERY SHARP RALLY AND IT WILL BE VERY FAST OVER A 3 TO 5 WEEK RUN LIKE 2001 AND A FEW OTHER YEAR I WILL POST IN GREAT DETAIL LATER .BEST OF TRADES .WAVETIMER

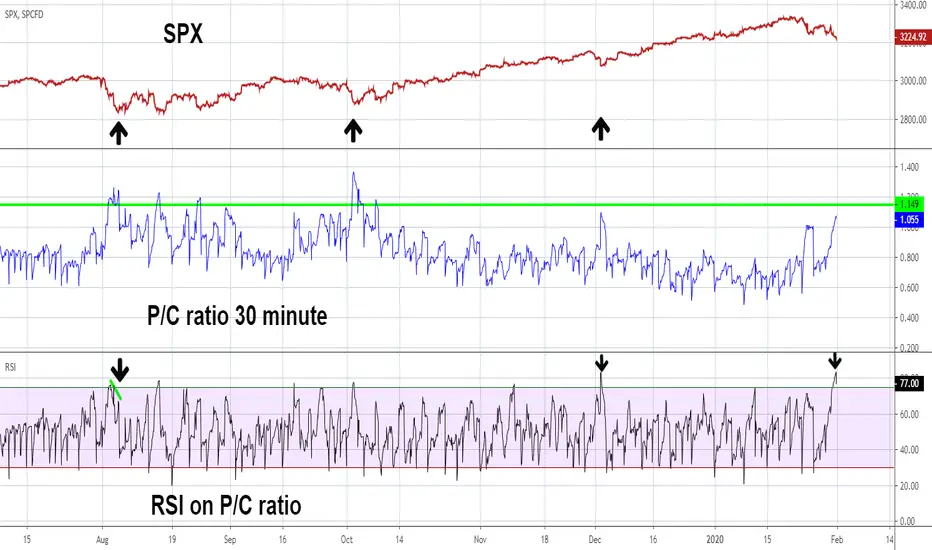
Watch 30 Minute PC Ratio for Possible Buy SignalMy previous post noted the SPX has over the last several months a very reliable 42 trading day cycle of bottoms. The next cycle bottom is due on 2/4/20. Periodic cycles can have leeway, in this case a leeway of two trading days is acceptable, so its possible an SPX bottom could be in place on 1/31/20. If not, watch the 30 minute P/C ratio - chart symbol PC.
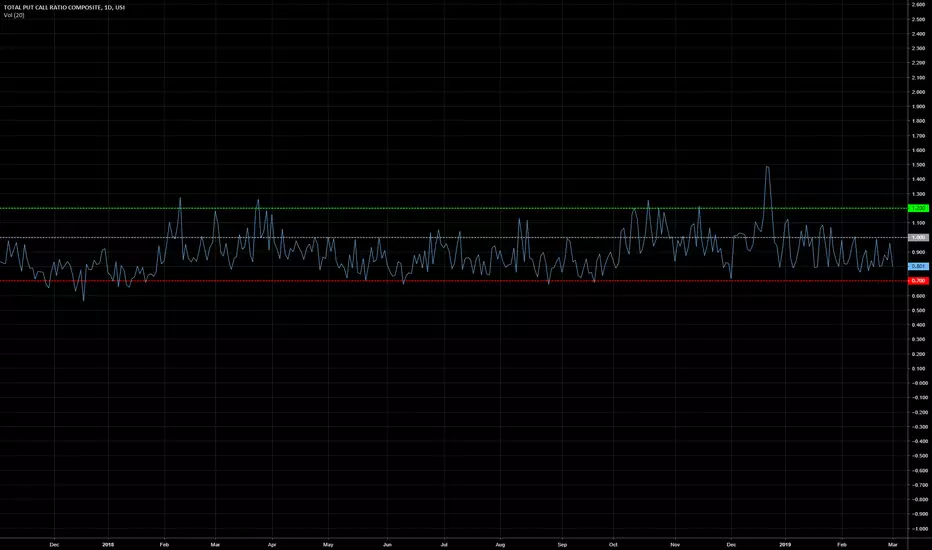
Investors Business Daily uses the PC level of 1.15 as an alert for possible bottoms. The two largest SPX corrections on the chart illustrate that when PC goes above 1.15 bottoms can form.
On 1/31/20 the RSI on the PC Ratio hit its highest level since the tiny 12/3/19 bottom which is evidence that an SPX bottom could already be in place. However the PC ratio could continue to rise above 1.15 with the RSI diverging against the high it made on 1/31/20.
Be on alert February 3rd to the 6th, if the SPX goes below its low made on 1/31/20 with a PC ratio above 1.15 it could be a fantastic opportunity to go long stocks.
Mark
PC - VIX - Chart posted Last week got triggered today!Our forecast for the PC chart (explained in a previous post earlier) was triggered today!
What does this mean?
We have had every market sell begin with this trigger identified.
Please look at this chart or the one posted last week and play with the advance chart key to watch the action as the PC ratio helps us identify the Market top
> we may have seen the top last week as published before.
Lets give the market a few days to leave us with an observable "top"
VIX picked up today and broke out of the Parabolic curve we mentioned.
The Market is really starting to crack.
We might see one last "Throwover rally" in the next few days, so after a pullback (breakdown?) We would be selling into strength
We are now bearish the Market.

PC - VIX - SPX- Waiting for Breakout Trigger! Market Reversal?This chart is a 4 hour candle of the PC (put/calls) that is in Tradingview. It is a bit different than the cboe put/call ratios chart we are familiar with.
However with this PC indicator, we can look at the whole market of stocks. We can expect a change in the market direction - ahead of time!
Take a minute or two and really observe how this PC chart is a contrarian indicator.
It is read same way as the VIX, cboe put/call indicators, and compared to SPX.
When PC readings are high, that is when we should be looking for a bottom in the market, and begin buying!
When the indicator is low (as it is now) we should be expecting a top and look to selling the market!
Here we see the SPX as a red line in the background for reference.
The Blue vertical lines are major SPX market reversal dates.
Notice how this indicator warned us about tops and bottoms?
We are now waiting for the trigger to be pulled. When we break above the little blue line (sloped downward), we will know that "the market top is in".
We should already be in a sold position by then and look for the market prices to collapse downward.
After this happens (it always does) we begin looking for a spike high reversal day in the future...
That's our cue to begin buying stocks at a discount when fear is the highest!
We are anticipating the trigger to be pulled now! Get ready!

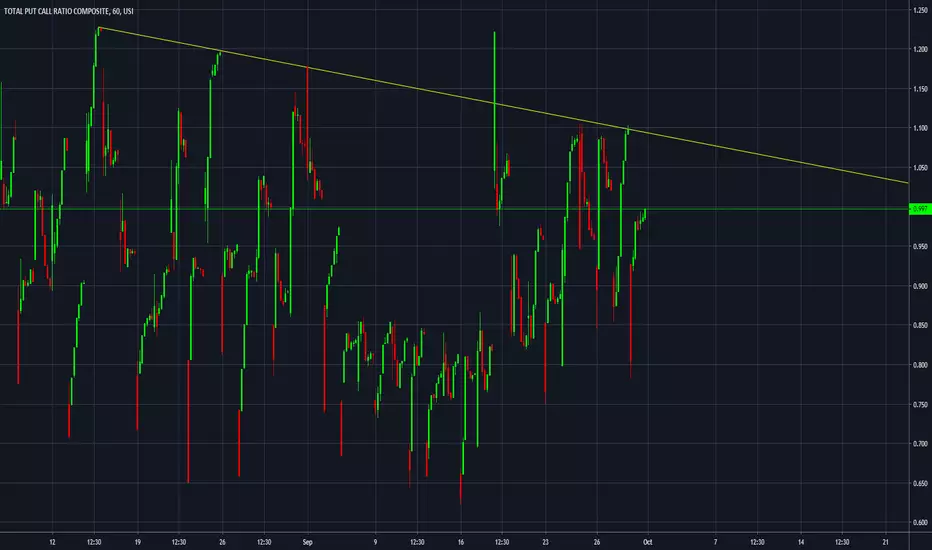
Too Many Bears,.. Buying Too Many PutsWhen measuring market direction,
it is important to consider excessive bullish/bearish sentiment,
to quantify price direction over the near term.
Right now bearish sentiment,traders believing the market will go down,and putting their money behind it
by buying Put Options, rose to a 2019 high in September, and has continued to be elevated again in October.
Simply put, the market will rarely go along with the crowd of bearish sentiment.
In fact more often then not, the market will do exactly the opposite, and continue to rise in price
climbing a proverbial wall of worry that will frustrate bears where it hurts them the most, in their bank accounts.
I'm not saying the market can't or won't go down.
But it won't go down, when a crowd of overly bearish traders expect it to.
THE_UNWIND
10/10/19
NEW YORK

PUT /CALL 10 DAY IS NOW IN BUY SIGNAL ZONE AS WELLWE ALSO HAD A TRIN ON A 10 IN BUY AND WE PRINTED A TRIN ABOVE 2.5 AND TIME WE SEE THIS A LOW IS WITHIN ONE TO 5 DAYS

Put Call Ratio - it may soon be time to sell againPut Call Ratio - it may soon be time to sell again
PUT/CALL SHOULD NOW SEE THE 112 TO 114 ON A TEN DAY WITHIN 3TD THE LIKELY PANIC PHASE HAS JUST STARTED IF 2696 IS BROKEN AND VIX BREAKS ABOVE 22.20

PUT/CALL SHOULD SEE 114 AGAIN OPTION TRADERS PATTERN BASED ON P/C WAS MISSING A PART OF THE PUZZLE EACH TIME WE HIT THE UPPER BANDS THAT WAS THE TRUE LOW POWER IS DRY

SPY PUTCALL ShortLooks like the SPY put/call ratio is bottomed out for the short term, and it's likely we could short for a mean reversion.
